evaluation with GEM-E3 Europe
Nikos Kouvaritakis, Nikos Stroblos and Leonidas Paroussos, ICCS-NTUA
Tamas Revesz and Erno Zalai, CPAS-CUB University
Denise Van Regemorter, CES-KULeuven
Final Report 11.7.2005
Study for the European Commission DG TAXUD Under the contract TAXUD/2003/DE/308
1. GENERAL OVERVIEW
The objective of this study is twofold: first analyze how the implementation of the EU minimum energy tax policy in the new Member States will affect the enlarged EU and secondly analyze how the energy taxation policy can contribute to the climate policy in the enlarged EU. The main elements of the new EU energy tax policy is an upward revision of the existing minimum tax rates on mineral oils and an inclusion of the energy products such as coal, natural gas and electricity in the tax base.
Associated with assumptions regarding climate policy, different directions for the energy taxation policy are explored going from an increase of the minimum energy tax to the possibility of exempting the energy intensive sectors of the entire energy tax or of a CO2 component when a climate policy is implemented. The analysis in this study is done with the GEM-E3 general equilibrium model extended towards the new Member States.
The GEM-E3 model is an appropriate tool to evaluate such policies which have potentially an impact on the economy, the energy system and the environment of each member state and on the interactions between them. As GEM-E3 is a macro-sectoral general equilibrium model, it allows assessing the impact of an energy taxation reform in terms of economic indicators, such as GDP, employment and the balance of trade1 and their sectoral implications, and in terms of environmental indicators, as CO2, SO2, NOx, VOC and PM emissions. Having a specific model for each of the EU countries (Luxembourg, Cyprus and Malta excluded) permits giving an indication on the distributive consequences between countries of energy taxation policy changes.
More precisely, the evaluated scenarios cover the following domain:
1) implementation of the EU energy tax directive (2003/96/EC) in the new Member States
2) implementation of more climate friendly energy tax rates by increasing the 'minimum' energy tax rates EU wide to the equivalent of 10Euro per ton CO2.
3) exemption from the energy taxation, either totally or partly, the sectors subject to other climate policy measures. The sectors considered for exemption are those participating in the allowance trading system2 (electricity and heat generators and energy intensive sectors) as provided in the Directive ((2003)87/EC). The assumed climate policy combines for the first commitment period a domestic carbon tax with the allowance trading system such as to reach the Kyoto target for the EU, the trading system starting already in 2005. For the period beyond 2012 EU wide CO2 taxes of respectively 25€ and 45€ per ton of CO2 inducing a further reduction of the CO2 emission is assumed.
For the recycling of the tax revenues two assumptions are considered, either the tax income is used for reducing the public deficit or it is recycled through a reduction of the employer’s social contribution.
The second section describes the existing tax structure as implemented in GEM-E3 based on the data received from DG TAXUD and IEA Energy Prices & Taxes Statistics, and the EU energy tax directive. In the third section the baseline scenario is briefly described and in the fourth section the policy scenarios are described more precisely and analysed. Finally section 5 concludes. The full detail of the results by country are given in an excel file in annex.
2. ENERGY TAX RATES TO BE IMPLEMENTED IN GEM-E3 2.1. The energy tax rates in 2003
Two sources are used for the computation of the tax rates to be implemented in GEM-E3, the nominal rates for the different fuels collected by TAXUD and the IEA Energy Prices & Taxes Statistics. The year 2003, the latest year for which all the necessary data are available, is the base year for the
1 As a general equilibrium model, it can only give the impact on relative prices but not on the level of inflation.
2 There is no clear definition of a criteria to define such sectors, however it is not within the scope of this proposal to arrive at such a definition, we will limit ourselves to a very general concept given the GEM-E3 sectoral classification.
implemented tax rates. Assumptions have been made by CUB-CES-NTUA to arrive at one rate per energy product and per sector as needed for GEM-E3.
The tax rates finally computed from these two sources are given in the two tables hereafter. For the implementation in GEM-E3, the price increase due to the tax was computed and then used as input for GEM-E3.
Table 1: Energy tax rates in Agriculture and Industry in EURO/GJ in 20033
AT BE DE DK FI FR EL IE IT NL PT
Coal Electricity sector 0.00 0.00 0.00 0.00 0.00 0.00 0.00 0.00 0.00 0.00 0.00
Energy Intensive sectors 0.00 0.00 0.00 0.32 0.40 0.00 0.00 0.00 0.00 0.43 0.00 Other 0.00 0.00 0.00 1.16 1.59 0.00 0.00 0.00 0.00 0.43 0.00 Oil Electricity sector 0.00 0.32 0.41 0.00 0.00 0.46 0.47 0.33 0.04 0.39 0.32 Energy Intensive sectors 0.90 0.32 0.72 0.27 1.25 0.46 0.47 0.34 0.78 0.80 0.32 Other 1.00 0.35 1.26 0.94 1.71 1.01 0.53 0.82 2.05 2.91 1.37 Gas Electricity sector 0.00 0.00 0.39 0.00 0.00 0.00 0.00 0.00 0.01 0.00 0.00 Energy Intensive sectors 0.00 0.30 0.69 0.19 0.44 0.33 0.00 0.00 0.46 0.06 0.00 Other 1.02 0.30 0.69 0.67 0.52 0.33 0.00 0.00 0.49 0.70 0.00
Electricity Electricity sector 0.00 0.00 0.00 0.00 0.00 0.00 0.00 0.00 0.00 0.00 0.00
Energy Intensive sectors 0.00 0.00 3.42 0.93 1.06 0.00 0.00 0.00 0.40 0.27 0.00 Other 5.28 0.00 3.42 3.35 1.26 0.92 0.00 0.00 3.27 1.75 0.00
Oil for transport 7.78 7.78 12.61 9.89 8.57 10.52 6.57 9.88 10.82 9.23 8.04
SP SE UK HU PL SI CZ SK EE LT LV
Coal Electricity sector 0.00 0.00 0.00 0.00 0.00 0.00 0.00 0.00 0.00 0.00 0.00
Energy Intensive sectors 0.00 1.54 0.14 0.00 0.00 0.00 0.00 0.00 0.00 0.00 0.00 Other 0.00 1.82 0.68 0.00 0.00 0.00 0.00 0.00 0.00 0.00 0.00 Oil Electricity sector 0.36 0.00 1.13 0.00 0.00 0.00 0.00 0.47 0.00 0.00 0.00 Energy Intensive sectors 0.36 1.33 0.30 4.02 0.00 0.36 0.00 0.47 0.00 0.32 0.29 Other 1.34 1.67 1.69 6.50 0.67 0.68 0.00 2.43 0.37 0.43 0.15 Gas Electricity sector 0.00 0.00 0.33 0.00 0.00 0.00 0.00 0.00 0.00 0.00 0.00 Energy Intensive sectors 0.00 1.02 0.13 0.00 0.00 0.26 0.00 0.00 0.00 0.00 0.00 Other 0.00 1.20 0.66 0.00 0.00 0.26 0.00 0.00 0.00 0.00 0.00
Electricity Electricity sector 0.00 0.00 0.00 0.00 0.00 0.00 0.00 0.00 0.00 0.00 0.00
Energy Intensive sectors 0.61 0.00 0.39 0.00 0.00 0.00 0.00 0.00 0.00 0.00 0.00 Other 0.61 0.00 1.96 0.00 0.00 0.00 0.00 0.00 0.00 0.00 0.00
Oil for transport 7.89 10.09 20.15 8.76 6.71 8.23 6.14 7.43 4.38 5.64 4.51
Table 2: Energy tax rates for Households in EURO/GJ in 2003
Household AT BE DE DK FI FR EL IE IT NL PT
Coal 0.00 0.00 0.00 8.41 1.59 0.00 0.00 0.00 0.00 0.43 0.00
Oil 2.12 0.51 2.25 7.64 1.94 1.56 0.58 1.30 11.08 5.03 2.42 Gas 1.02 0.34 1.06 7.17 0.48 0.00 0.00 0.00 4.33 2.60 0.00
Electricity 5.56 0.38 5.69 24.79 2.06 2.89 0.00 0.00 11.11 13.50 0.00
Oil for transport 11.03 12.08 17.88 15.37 15.99 15.55 8.37 12.43 14.62 17.07 13.95
Household ES SE UK HU PL SI CZ SK EE LT LV
Coal 0.00 8.46 0.00 0.00 0.00 0.00 0.00 0.00 0.00 0.00 0.00
3 Energy intensive sectors: ferrous and non ferrous ore and metals (NACE-CLIO 13), non metallic mineral products (NACE-CLIO 15),
Oil 2.33 9.59 1.90 8.98 1.34 1.00 0.00 0.47 0.74 0.54 0.60 Gas 0.00 5.90 0.00 0.00 0.00 0.26 0.00 0.00 0.00 0.00 0.00
Electricity 1.42 6.88 0.00 0.00 0.00 0.00 0.00 0.00 0.00 0.00 0.00
Oil for transport 10.59 15.73 21.96 11.02 10.14 11.99 8.35 8.20 6.12 7.50 7.26
2.2. The "minimum" energy tax rates
The "minimum rates" considered are those corresponding to the EU directive (2003/96/EC). These rates only apply on final energy demand exclusive of the non-energy use, and not on energy production or transformation. In the model implementation, the rates are adapted over time to the general relative price evolution in each country.
Table 3: Minimum energy tax rates (EURO/GJ)
Agriculture, industry and services
2004 2010 Coal and coke 0.15
Heavy fuel oil 0.37 Light fuel oil 0.58
Natural Gas 0.15
Electricity 0.14
Oil for transport purposes (diesel) 8.10 8.86 Household
Coal 0.30 Oil 0.58
Natural Gas 0.30
Electricity 0.28
Oil for transport purposes: petrol 10.27 10.27
diesel 8.10 8.86
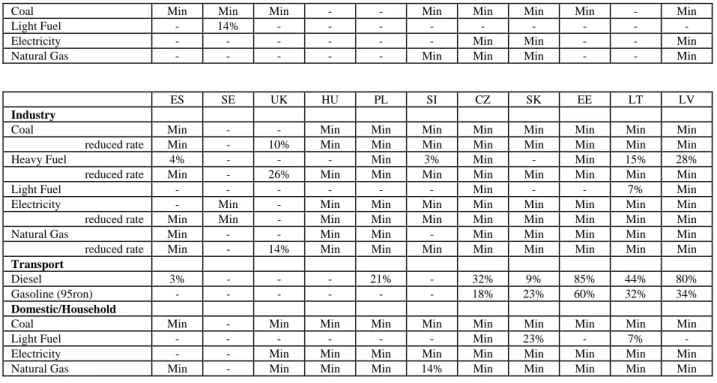
The following table shows the changes for the countries and sectors where the implementation of the minimum rates modifies the existing rates4. The minimum rates imply an increase of the energy tax in all new Member States, as in most of them only transport fuels were taxed and at a lower rate. For Hungary and Slovenia there is no increase in the tax on transport fuels, neither on light fuel for industry and household. For the other new Member States the increase in taxes are relatively comparable as to those implied for Greece, except for the Baltic countries where the increase in tax on transport fuels is higher. The increase is greater for the non oil products as they are mostly not taxed.
Table 4: Tax increase (in %) from minimum tax implementation compared to the tax rates in 2003
AT BE DE DK FI FR EL IE IT NL PT
Industry
Coal Min Min Min - - Min Min Min Min - Min
reduced rate Min Min Min - - Min Min Min Min Min Min
Heavy Fuel - 15% - - - 10% - - 15%
reduced rate Min Min Min 36% - Min Min Min Min Min Min
Light Fuel - 56% - - -
Electricity - Min - - - - Min Min - - Min
reduced rate Min Min Min - - Min Min Min - - Min
Natural Gas - - - Min Min - - Min
reduced rate Min Min Min - - - Min Min - 131% Min Transport
Diesel 4% 4% - - - - 23% - - - 1%
Gasoline (95ron) - - - 21% - - - -
Domestic/Household
4 MIN means that there were no tax and the minimum tax will be applied, % is the tax increase through the minimum tax, - the existing taxes are higher that the minimum tax.
Coal Min Min Min - - Min Min Min Min - Min
Light Fuel - 14% - - -
Electricity - - - Min Min - - Min
Natural Gas - - - Min Min Min - - Min
ES SE UK HU PL SI CZ SK EE LT LV Industry
Coal Min - - Min Min Min Min Min Min Min Min
reduced rate Min - 10% Min Min Min Min Min Min Min Min
Heavy Fuel 4% - - - Min 3% Min - Min 15% 28%
reduced rate Min - 26% Min Min Min Min Min Min Min Min
Light Fuel - - - Min - - 7% Min
Electricity - Min - Min Min Min Min Min Min Min Min reduced rate Min Min - Min Min Min Min Min Min Min Min Natural Gas Min - - Min Min - Min Min Min Min Min reduced rate Min - 14% Min Min Min Min Min Min Min Min Transport
Diesel 3% - - - 21% - 32% 9% 85% 44% 80%
Gasoline (95ron) - - - 18% 23% 60% 32% 34%
Domestic/Household
Coal Min - Min Min Min Min Min Min Min Min Min
Light Fuel - - - Min 23% - 7% -
Electricity - - Min Min Min Min Min Min Min Min Min Natural Gas Min - Min Min Min 14% Min Min Min Min Min
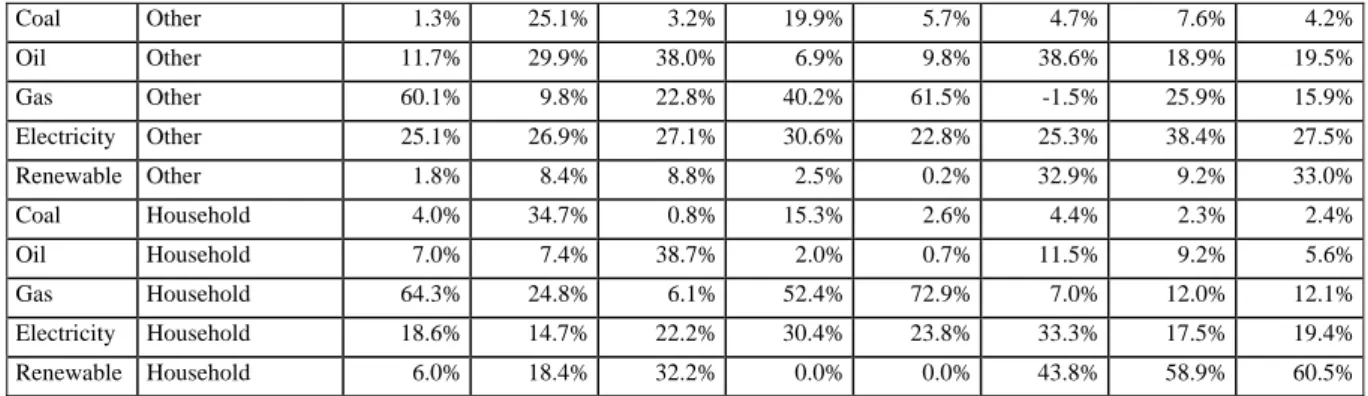
The impact might be somewhat less important than what is suggested in the table when linking it with the shares of the energy products in the total final energy consumption. Table 5 gives, by country, the share of the energy products in the total final energy consumption in each broad sectoral category. The use of coal by household is only significant in Ireland and Poland, practically no gas is used in Greece, Portugal and Sweden; in the industry coal is mainly used for electricity production (not taxed) and in the non-chemical energy intensive industries, where moreover only the energy use is taxed.
Table 5: Share of energy products in total final energy consumption, excluding consumption for transport purposes, in 2000
AT BE DE DK FI FR EL IE IT NL PT ES SE UK Coal Energy Intensive 8.9% 31.2% 22.8% 17.8% 10.4% 19.9% 31.3% 2.9% 12.3% 14.1% 12.8% 8.3% 11.1% 18.6%
Oil Energy Intensive 9.7% 7.3% 5.7% 24.9% 8.2% 11.5% 35.8% 53.8% 17.5% 15.9% 39.7% 22.7% 11.9% 5.5%
Gas Energy Intensive 41.7% 37.8% 44.7% 28.9% 11.8% 37.9% 5.6% 21.8% 44.7% 44.7% 16.1% 40.4% 3.7% 48.5%
Electricity Energy Intensive 27.3% 23.7% 26.7% 28.3% 32.2% 30.6% 27.3% 21.5% 25.5% 25.3% 19.5% 25.2% 34.7% 27.5%
Renewable Energy Intensive 12.4% 0.0% 0.0% 0.1% 37.4% 0.0% 0.0% 0.0% 0.0% 0.0% 11.8% 3.4% 38.7% 0.0%
Coal Other 1.4% 0.9% 1.7% 2.8% 1.7% 2.3% 0.3% 0.8% 2.0% 0.3% 0.9% 1.1% 1.3% 1.7%
Oil Other 20.6% 29.5% 24.4% 32.0% 37.7% 22.7% 49.6% 46.9% 21.3% 9.0% 47.8% 31.3% 28.7% 22.4%
Gas Other 27.0% 40.0% 34.5% 18.3% 5.4% 33.5% 2.1% 18.2% 25.8% 61.7% 5.2% 18.3% 2.9% 39.6%
Electricity Other 41.5% 29.0% 37.4% 41.3% 43.1% 37.1% 42.0% 30.6% 46.4% 28.3% 42.2% 44.6% 54.9% 35.2%
Renewable Other 9.4% 0.7% 2.0% 5.6% 12.1% 4.4% 5.9% 3.3% 4.6% 0.8% 3.9% 4.6% 12.3% 1.1%
Coal Household 3.8% 2.3% 1.5% 0.0% 0.4% 1.5% 0.5% 20.6% 0.2% 0.0% 0.0% 0.4% 0.0% 3.7%
Oil Household 29.1% 39.6% 33.0% 28.5% 30.6% 25.5% 53.8% 36.2% 18.4% 0.9% 24.1% 34.0% 16.7% 7.0%
Gas Household 23.1% 34.8% 40.3% 24.5% 0.6% 24.4% 0.3% 17.6% 56.8% 78.6% 3.5% 17.0% 1.9% 66.5%
Electricity Household 20.0% 21.6% 18.9% 32.8% 42.8% 28.8% 27.4% 24.0% 14.5% 18.5% 30.9% 31.6% 69.5% 22.3%
Renewable Household 24.0% 1.7% 6.4% 14.1% 25.7% 19.7% 18.0% 1.6% 10.1% 2.0% 41.5% 17.0% 11.9% 0.5%
HU PL SI CZ SK EE LT LV Coal Energy Intensive 15.1% 39.8% 6.4% 47.3% 45.2% 9.3% 0.8% 1.4%
Oil Energy Intensive 31.5% 15.8% 9.9% 21.5% 34.1% 11.9% 11.5% 30.3%
Gas Energy Intensive 38.3% 26.6% 50.2% 18.4% 0.0% 47.7% 79.4% 56.1%
Electricity Energy Intensive 15.0% 15.3% 33.5% 12.6% 20.7% 20.8% 7.9% 11.1%
Coal Other 1.3% 25.1% 3.2% 19.9% 5.7% 4.7% 7.6% 4.2%
Oil Other 11.7% 29.9% 38.0% 6.9% 9.8% 38.6% 18.9% 19.5%
Gas Other 60.1% 9.8% 22.8% 40.2% 61.5% -1.5% 25.9% 15.9%
Electricity Other 25.1% 26.9% 27.1% 30.6% 22.8% 25.3% 38.4% 27.5%
Renewable Other 1.8% 8.4% 8.8% 2.5% 0.2% 32.9% 9.2% 33.0%
Coal Household 4.0% 34.7% 0.8% 15.3% 2.6% 4.4% 2.3% 2.4%
Oil Household 7.0% 7.4% 38.7% 2.0% 0.7% 11.5% 9.2% 5.6%
Gas Household 64.3% 24.8% 6.1% 52.4% 72.9% 7.0% 12.0% 12.1%
Electricity Household 18.6% 14.7% 22.2% 30.4% 23.8% 33.3% 17.5% 19.4%
Renewable Household 6.0% 18.4% 32.2% 0.0% 0.0% 43.8% 58.9% 60.5%
The ex-ante price increase, implied by the minimum tax and implemented in the model, is given in the next table. It is the price increase through the minimum tax of the average energy product price inclusive existing energy taxes in 2000 (but excluding VAT).
Table 6: Ex-ante Price Increase through Minimum Tax (for average energy prices of 2000, incl. existing taxes)
AT BE DE DK FI FR EL IE IT NL PT Coal Energy Intensive 8.0% 8.2% 6.5% 0.0% 0.0% 4.2% 6.2% 11.7% 10.3% 0.0% 11.7%
Other 8.0% 8.2% 6.5% 0.0% 0.0% 4.2% 6.2% 11.7% 10.3% 0.0% 11.7%
Oil Energy Intensive 0.0% 1.0% 0.0% 1.9% 0.0% 0.0% 0.0% 0.5% 0.0% 0.0% 0.8%
Other 0.0% 2.0% 0.0% 0.0% 0.0% 0.0% 0.0% 0.0% 0.0% 0.0% 0.0%
Gas Energy Intensive 4.5% 0.0% 0.0% 0.0% 0.0% 0.0% 2.7% 5.1% 0.0% 2.1% 2.4%
Other 0.0% 0.0% 0.0% 0.0% 0.0% 0.0% 2.7% 5.1% 0.0% 0.0% 2.4%
Electricity Energy Intensive 1.2% 1.0% 0.0% 0.0% 0.0% 1.3% 1.1% 0.9% 0.0% 0.0% 0.7%
Other 0.0% 1.0% 0.0% 0.0% 0.0% 0.0% 1.1% 0.9% 0.0% 0.0% 0.7%
Oil for transport Industry 6.2% 6.2% 0.0% 0.0% 1.5% 0.0% 15.1% 0.0% 0.0% 0.0% 5.0%
Coal Household 3.3% 3.2% 2.7% 0.0% 0.0% 3.7% 4.1% 4.4% 8.5% 0.0% 9.2%
Oil Household 0.0% 0.9% 0.0% 0.0% 0.0% 0.0% 0.0% 0.0% 0.0% 0.0% 0.0%
Gas Household 0.0% 0.0% 0.0% 0.0% 0.0% 3.9% 4.4% 3.8% 0.0% 0.0% 1.9%
Electricity Household 0.0% 0.0% 0.0% 0.0% 0.0% 0.0% 1.4% 1.0% 0.0% 0.0% 0.8%
Oil for transport Household 0.0% 0.0% 0.0% 0.0% 0.0% 0.0% 9.8% 0.0% 0.0% 0.0% 0.0%
ES SV UK HU PL SL CZ LV LT EE SK Coal Energy Intensive 7.1% 0.0% 0.6% 11.5% 10.1% 16.0% 16.0% 16.0% 16.0% 16.0% 15.6%
Other 7.1% 0.0% 0.0% 11.5% 10.1% 13.9% 26.9% 13.9% 13.9% 13.9% 15.6%
Oil Energy Intensive 0.2% 0.0% 1.7% 0.0% 12.2% 0.3% 12.3% 2.4% 1.4% 12.4% 0.0%
Other 0.0% 0.0% 0.0% 0.0% 0.0% 0.0% 8.0% 6.0% 0.8% 1.9% 0.0%
Gas Energy Intensive 3.3% 0.0% 0.7% 4.6% 4.4% 0.0% 3.9% 4.6% 4.6% 4.6% 5.7%
Other 3.3% 0.0% 0.0% 4.6% 4.4% 0.0% 3.9% 4.6% 4.6% 4.6% 5.7%
Electricity Energy Intensive 0.0% 1.6% 0.0% 1.0% 1.3% 1.1% 1.1% 1.1% 1.1% 1.1% 1.1%
Other 0.0% 1.6% 0.0% 1.0% 1.3% 1.1% 1.1% 1.1% 1.1% 1.1% 1.1%
Oil for transport Industry 5.8% 0.0% 0.0% 0.5% 14.6% 3.7% 17.9% 32.6% 22.3% 33.9% 8.9%
Coal Household 11.9% 0.0% 3.9% 14.5% 10.2% 17.7% 36.8% 17.7% 17.7% 17.7% 30.7%
Oil Household 0.0% 0.0% 0.0% 0.0% 0.0% 0.0% 6.5% 0.0% 0.5% 0.0% 2.2%
Gas Household 2.7% 0.0% 4.2% 7.8% 5.7% 0.9% 6.6% 7.4% 7.4% 7.4% 11.8%
Electricity Household 0.0% 0.0% 0.9% 1.6% 1.7% 1.8% 2.1% 1.8% 1.8% 1.8% 2.1%
Oil for transport Household 0.0% 0.0% 0.0% 0.0% 0.0% 0.0% 9.1% 15.9% 14.6% 24.3% 10.3%
3. THE BASELINE SCENARIO 3.1. Exogenous assumptions
A baseline scenario elaborated with a CGE model such as GEM-E3, cannot be considered as a forecast. It gives however a consistent general evolution of the economic activity given exogenous assumptions on the main driving forces and represents the benchmark to which to compare the different policy scenarios. One should however have in mind that, in case of scenarios related to the Kyoto target, the evolution of GHG emissions in the baseline scenario conditions the EU global reduction effort, as the target is defined in terms of the 1990 emissions. It is therefore an important parameter in the evaluation of a climate change policy.
It is based on the existing baseline of GEM-E3, constructed within the 5th Framework Research Program project DAT-GEM-E3 in which CES-KULeuven (coordinator), ICCS-NTUA and CPAS- BUES participate. For the period until 2005 it is in line with the Spring EU Commission forecast and for 2005-2030 with the study “European Energy and Transport – Trends to 2030” published by the European Commission Directorate-General for Energy and Transport (January 2003) which assumed an average growth rate around 2%. The assumed oil and gas price evolution is given in the table hereafter5.
Table 7: World energy prices assumptions
International Fuel Price (Euro'00 per toe) 2005 2010 2015 2020 2025 2030
Crude oil 150.4 158.4 174.2 190.0 205.9 221.7
Natural gas 118.8 134.6 150.4 162.3 174.2 182.1
For technical progress general assumptions have been made in line with past observations for energy efficiency and labour productivity and without sectoral or country differentiation. Regarding public policy no specific assumptions regarding climate change are assumed with the exception of the ACEA agreement for car fuel efficiencies and the energy taxes in the EU countries.
The EU minimum tax directive is implemented in the EU15 countries in the baseline, whereas for the new Member States the current rates are considered. The existing rates were translated into an average tax per sector and per energy category (coal, oil, natural gas and electricity) and implemented in GEM- E3.
3.2. The projections for 2000-2030
The endogenous variables of the GEM-E3 model include (in volume for each sector and each country) the supply (production and imports) and demand (use in production, private and public consumption, investments and exports) of goods and services, the sources and uses of material, energy, labour and capital inputs. The model also computes, for each sector and each country, the changes in relative prices of domestic production, exports, imports and changes in primary factor incomes (average wage rate and return on capital). In the following table the macroeconomic growth for the EU, inclusive the New Member States, as a whole is given. The projected average growth rate is around 2.5% with a decoupling of the GDP growth and the energy demand over the entire projection horizon and thus a moderate growth in CO2 emissions. The evolution of the CO2 emissions implies still in 2010 a reduction of approx. 14% of the baseline CO2 emissions for the EU15 in order to reach the Kyoto target translated in terms of CO2 emissions.
Table 8: EU Macroeconomic growth (22 countries)
(annual growth rate except for * where difference)
2005/2010 2010/2015 2015/2020 2020/2025 2025/2030 Macroeconomic Aggregates
Gross Domestic Product 2.5% 2.6% 2.5% 2.4% 2.3%
Employment 0.8% 0.2% 0.0% 0.0% -0.2%
Private Consumption 2.0% 2.2% 2.2% 2.2% 2.1%
Investment 3.9% 2.4% 2.4% 2.3% 2.3%
Final Energy Consumption 1.6% 1.9% 1.8% 1.8% 1.8%
Share Coal* -0.1% -0.1% -0.1% -0.1% -0.2%
Share Oil* -0.3% -0.9% -1.2% -1.2% -1.0%
Share Gas* -0.5% -0.4% -0.3% -0.3% -0.3%
Share Electricity* 0.9% 1.4% 1.6% 1.6% 1.4%
Exports to RW 3.8% 5.0% 4.4% 4.0% 3.4%
Imports from RW 3.1% 1.5% 1.9% 2.2% 2.5%
Real Wage Rate 0.7% 2.8% 3.1% 3.1% 3.3%
Relative Consumer Price 0.9% -0.3% 0.0% 0.2% 0.5%
Terms of Trade -0.5% -1.6% -1.1% -0.7% -0.3%
Current Account (% of GDP)* 0.9% 2.1% 1.7% 1.5% 1.1%
Total Atmospheric Emissions
CO2 Emissions 1.2% 1.3% 1.1% 1.1% 1.0%
NOX Emissions -3.5% 1.4% 1.2% 1.2% 1.1%
SO2 Emissions 0.9% 1.2% 1.1% 1.1% 1.0%
VOC Emissions -0.8% 1.7% 1.5% 1.5% 1.4%
PM Emissions 1.1% 1.3% 1.2% 1.2% 1.1%
The sectoral evolution for the domestic production and the EU exports are given in the next table.
They imply a slow shift towards a more service oriented economy though still limited. It is rather more pronounced in the exports in the period 2005/2010. This shift towards less energy intensive sectors contributes to the slower growth of CO2 emissions.
Table 9: EU sectoral evolution (22 countries)
(annual growth rate)
Sectoral Aggregates 2005/2010 2010/2015 2015/2020 2020/2025 2025/2030 Domestic Production in Volume
Agriculture 1.5% 1.9% 1.9% 1.8% 1.8%
Energy Production 0.4% 0.9% 0.7% 0.7% 0.7%
Ferrous and non ferrous metals 2.5% 2.2% 1.9% 1.8% 1.5%
Chemical Products 2.0% 2.5% 2.3% 2.1% 1.8%
Other energy intensive 2.1% 2.0% 1.8% 1.8% 1.6%
Electric Goods 2.4% 2.6% 2.3% 2.1% 1.8%
Transport equipment 3.4% 2.8% 2.5% 2.4% 2.1%
Other Equipment Goods 3.3% 2.7% 2.4% 2.2% 1.9%
Consumer Goods Industries 1.8% 2.3% 2.2% 2.1% 2.0%
Construction 3.0% 2.2% 2.2% 2.2% 2.1%
Telecommunication Services 2.1% 2.5% 2.4% 2.4% 2.3%
Transport 2.3% 3.0% 2.8% 2.8% 2.5%
Services of credit and insurances 1.9% 2.5% 2.4% 2.4% 2.3%
Other Market Services 2.2% 2.5% 2.4% 2.4% 2.3%
Non Market Services 1.7% 1.7% 1.7% 1.7% 1.7%
Exports in Volume
Agriculture 8.0% 1.9% 1.9% 1.8% 1.7%
Energy Exports 0.2% 0.8% 0.7% 0.7% 0.6%
Ferrous and non ferrous metals 4.3% 2.2% 2.0% 1.9% 1.6%
Chemical Products 1.4% 2.5% 2.3% 2.2% 2.0%
Other energy intensive -4.1% 2.0% 1.9% 1.8% 1.7%
Electric Goods -3.5% 2.7% 2.5% 2.3% 2.0%
Transport equipment -3.3% 2.7% 2.5% 2.4% 2.1%
Other Equipment Goods 1.9% 2.8% 2.5% 2.3% 2.0%
Consumer Goods Industries 8.0% 2.3% 2.2% 2.1% 2.0%
Construction 6.0% 2.2% 2.3% 2.3% 2.3%
Telecommunication Services -5.5% 2.6% 2.6% 2.6% 2.5%
Transport 4.1% 3.2% 3.1% 3.0% 2.9%
Services of credit and insurances 4.7% 2.6% 2.6% 2.6% 2.5%
Other Market Services 5.3% 2.5% 2.5% 2.5% 2.4%
Non Market Services 1.7% 2.0% 2.0% 2.0% 2.0%
4. THE POLICY SCENARIOS
4.1. The EU enlargement and the minimum energy tax directive (scenario 1)
4.1.1. Assumptions
The energy tax directive in its agreed form is implemented in the new Member States. The tax rates implemented in this scenario were computed following the same procedure as the one used for the computation of average tax rates for the EU15 in the baseline. As the GEM-E3 model runs in 5 year period, the transitional regulation as foreseen in the EU directive are not relevant for this exercise as most are allowed till January 2008.
Two possibilities for the revenue recycling are considered:
1. the revenues are used to decrease the public deficit which alleviates the financial constraint of private economic agents and reduces the interest rate. This is modelled by imposing that the EU current account remains constant relative to GDP compared to the reference case, limiting the resource allocation induced by the policy to the EU.
2. the revenues are recycled through a decrease of the social security contributions such as to ensure budget neutrality compared to the reference scenario; the reduction is uniform across all sectors. In this scenario the current account can freely adjust.
4.1.2. Results for the EU
The macroeconomic results for the EU as a whole are reproduced in Table 10. The impact of the policy is limited to the new Member States where the minimum taxes are implemented and induces hardly any change at EU level.
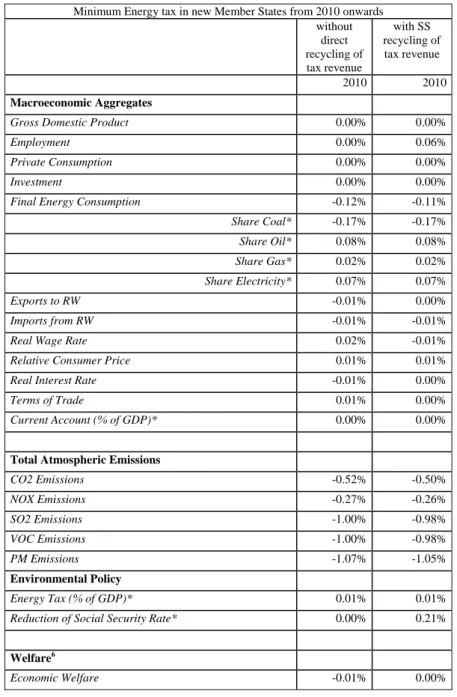
Table 10: Macroeconomic impact at EU level (22 countries) of the implementation of the minimum energy tax in the new Member States
(% difference compared to reference, except for * where difference) Minimum Energy tax in new Member States from 2010 onwards
without direct recycling of tax revenue
with SS recycling of tax revenue 2010 2010 Macroeconomic Aggregates
Gross Domestic Product 0.00% 0.00%
Employment 0.00% 0.06%
Private Consumption 0.00% 0.00%
Investment 0.00% 0.00%
Final Energy Consumption -0.12% -0.11%
Share Coal* -0.17% -0.17%
Share Oil* 0.08% 0.08%
Share Gas* 0.02% 0.02%
Share Electricity* 0.07% 0.07%
Exports to RW -0.01% 0.00%
Imports from RW -0.01% -0.01%
Real Wage Rate 0.02% -0.01%
Relative Consumer Price 0.01% 0.01%
Real Interest Rate -0.01% 0.00%
Terms of Trade 0.01% 0.00%
Current Account (% of GDP)* 0.00% 0.00%
Total Atmospheric Emissions
CO2 Emissions -0.52% -0.50%
NOX Emissions -0.27% -0.26%
SO2 Emissions -1.00% -0.98%
VOC Emissions -1.00% -0.98%
PM Emissions -1.07% -1.05%
Environmental Policy
Energy Tax (% of GDP)* 0.01% 0.01%
Reduction of Social Security Rate* 0.00% 0.21%
Welfare6
Economic Welfare -0.01% 0.00%
6 Economic welfare corresponds to the change of the utility function derived from the change in consumption and leisure, total welfare includes the environmental benefits/damages expressed in utility equivalent derived from the change in emissions (cf. annex with short description of GEM-E3). Local benefits are the benefits from the reduction of local pollutant such as NOx, SO2, PM and VOC expressed in monetary terms.
Total Welfare 0.00% 0.01%
Local Benefits (% of GDP)* 0.01% 0.01%
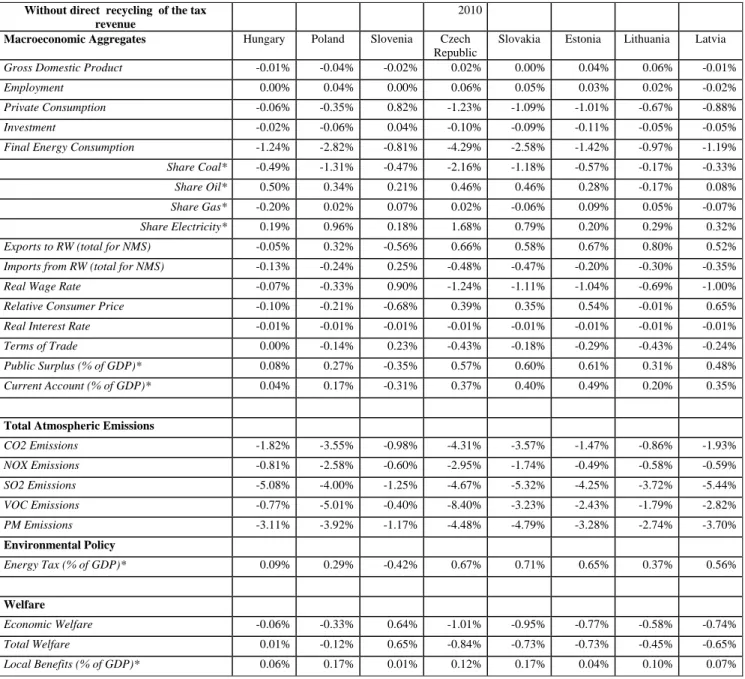
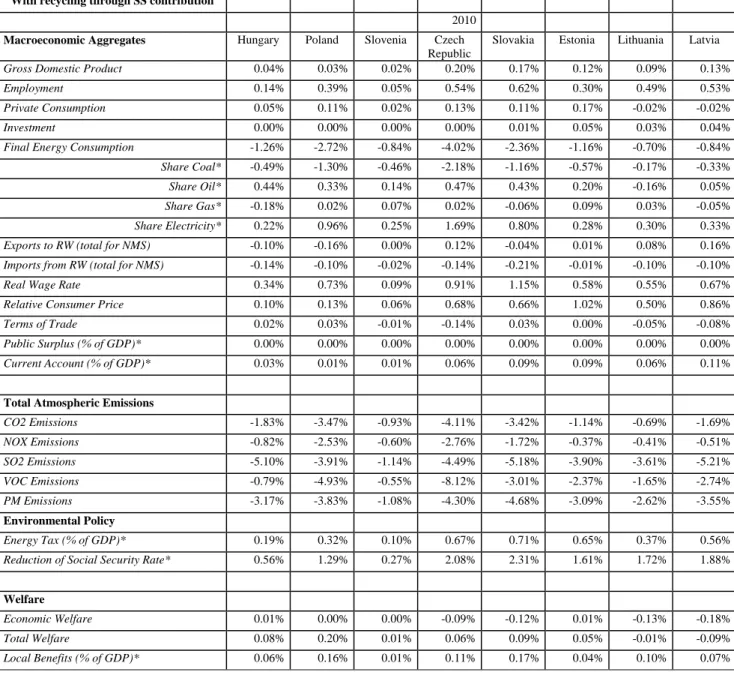
In the New Member States the impact is larger, as can be seen in Table 11. Final energy consumption decreases from 1 to 4% with only a very small impact on economic growth and welfare. The CO2 emissions are more reduced than the energy consumption because of the decreasing share of coal. The share of coal and gas are decreasing because oil is already partly taxed in most countries. Also electricity increases its share because the price of electricity increases relatively less as the minimum tax per GJ is the same for coal, gas and electricity. As expected, a recycling of the tax income through a reduction of the employers' social security contribution allows limiting more the negative impact of the policy measure than a recycling within the public budget, as it reduces the distortion in the labour market. This is observed both in terms of welfare and of employment in all new Member States. The impact on employment is the greatest in those countries where the reduction in the social security rate is the highest.
Table 11: Macroeconomic impact for the new Member States in 2010
(% difference compared to reference, except for * where difference)
Without direct recycling of the tax revenue
2010
Macroeconomic Aggregates Hungary Poland Slovenia Czech
Republic
Slovakia Estonia Lithuania Latvia
Gross Domestic Product -0.01% -0.04% -0.02% 0.02% 0.00% 0.04% 0.06% -0.01%
Employment 0.00% 0.04% 0.00% 0.06% 0.05% 0.03% 0.02% -0.02%
Private Consumption -0.06% -0.35% 0.82% -1.23% -1.09% -1.01% -0.67% -0.88%
Investment -0.02% -0.06% 0.04% -0.10% -0.09% -0.11% -0.05% -0.05%
Final Energy Consumption -1.24% -2.82% -0.81% -4.29% -2.58% -1.42% -0.97% -1.19%
Share Coal* -0.49% -1.31% -0.47% -2.16% -1.18% -0.57% -0.17% -0.33%
Share Oil* 0.50% 0.34% 0.21% 0.46% 0.46% 0.28% -0.17% 0.08%
Share Gas* -0.20% 0.02% 0.07% 0.02% -0.06% 0.09% 0.05% -0.07%
Share Electricity* 0.19% 0.96% 0.18% 1.68% 0.79% 0.20% 0.29% 0.32%
Exports to RW (total for NMS) -0.05% 0.32% -0.56% 0.66% 0.58% 0.67% 0.80% 0.52%
Imports from RW (total for NMS) -0.13% -0.24% 0.25% -0.48% -0.47% -0.20% -0.30% -0.35%
Real Wage Rate -0.07% -0.33% 0.90% -1.24% -1.11% -1.04% -0.69% -1.00%
Relative Consumer Price -0.10% -0.21% -0.68% 0.39% 0.35% 0.54% -0.01% 0.65%
Real Interest Rate -0.01% -0.01% -0.01% -0.01% -0.01% -0.01% -0.01% -0.01%
Terms of Trade 0.00% -0.14% 0.23% -0.43% -0.18% -0.29% -0.43% -0.24%
Public Surplus (% of GDP)* 0.08% 0.27% -0.35% 0.57% 0.60% 0.61% 0.31% 0.48%
Current Account (% of GDP)* 0.04% 0.17% -0.31% 0.37% 0.40% 0.49% 0.20% 0.35%
Total Atmospheric Emissions
CO2 Emissions -1.82% -3.55% -0.98% -4.31% -3.57% -1.47% -0.86% -1.93%
NOX Emissions -0.81% -2.58% -0.60% -2.95% -1.74% -0.49% -0.58% -0.59%
SO2 Emissions -5.08% -4.00% -1.25% -4.67% -5.32% -4.25% -3.72% -5.44%
VOC Emissions -0.77% -5.01% -0.40% -8.40% -3.23% -2.43% -1.79% -2.82%
PM Emissions -3.11% -3.92% -1.17% -4.48% -4.79% -3.28% -2.74% -3.70%
Environmental Policy
Energy Tax (% of GDP)* 0.09% 0.29% -0.42% 0.67% 0.71% 0.65% 0.37% 0.56%
Welfare
Economic Welfare -0.06% -0.33% 0.64% -1.01% -0.95% -0.77% -0.58% -0.74%
Total Welfare 0.01% -0.12% 0.65% -0.84% -0.73% -0.73% -0.45% -0.65%
Local Benefits (% of GDP)* 0.06% 0.17% 0.01% 0.12% 0.17% 0.04% 0.10% 0.07%
With recycling through SS contribution
2010
Macroeconomic Aggregates Hungary Poland Slovenia Czech
Republic
Slovakia Estonia Lithuania Latvia
Gross Domestic Product 0.04% 0.03% 0.02% 0.20% 0.17% 0.12% 0.09% 0.13%
Employment 0.14% 0.39% 0.05% 0.54% 0.62% 0.30% 0.49% 0.53%
Private Consumption 0.05% 0.11% 0.02% 0.13% 0.11% 0.17% -0.02% -0.02%
Investment 0.00% 0.00% 0.00% 0.00% 0.01% 0.05% 0.03% 0.04%
Final Energy Consumption -1.26% -2.72% -0.84% -4.02% -2.36% -1.16% -0.70% -0.84%
Share Coal* -0.49% -1.30% -0.46% -2.18% -1.16% -0.57% -0.17% -0.33%
Share Oil* 0.44% 0.33% 0.14% 0.47% 0.43% 0.20% -0.16% 0.05%
Share Gas* -0.18% 0.02% 0.07% 0.02% -0.06% 0.09% 0.03% -0.05%
Share Electricity* 0.22% 0.96% 0.25% 1.69% 0.80% 0.28% 0.30% 0.33%
Exports to RW (total for NMS) -0.10% -0.16% 0.00% 0.12% -0.04% 0.01% 0.08% 0.16%
Imports from RW (total for NMS) -0.14% -0.10% -0.02% -0.14% -0.21% -0.01% -0.10% -0.10%
Real Wage Rate 0.34% 0.73% 0.09% 0.91% 1.15% 0.58% 0.55% 0.67%
Relative Consumer Price 0.10% 0.13% 0.06% 0.68% 0.66% 1.02% 0.50% 0.86%
Terms of Trade 0.02% 0.03% -0.01% -0.14% 0.03% 0.00% -0.05% -0.08%
Public Surplus (% of GDP)* 0.00% 0.00% 0.00% 0.00% 0.00% 0.00% 0.00% 0.00%
Current Account (% of GDP)* 0.03% 0.01% 0.01% 0.06% 0.09% 0.09% 0.06% 0.11%
Total Atmospheric Emissions
CO2 Emissions -1.83% -3.47% -0.93% -4.11% -3.42% -1.14% -0.69% -1.69%
NOX Emissions -0.82% -2.53% -0.60% -2.76% -1.72% -0.37% -0.41% -0.51%
SO2 Emissions -5.10% -3.91% -1.14% -4.49% -5.18% -3.90% -3.61% -5.21%
VOC Emissions -0.79% -4.93% -0.55% -8.12% -3.01% -2.37% -1.65% -2.74%
PM Emissions -3.17% -3.83% -1.08% -4.30% -4.68% -3.09% -2.62% -3.55%
Environmental Policy
Energy Tax (% of GDP)* 0.19% 0.32% 0.10% 0.67% 0.71% 0.65% 0.37% 0.56%
Reduction of Social Security Rate* 0.56% 1.29% 0.27% 2.08% 2.31% 1.61% 1.72% 1.88%
Welfare
Economic Welfare 0.01% 0.00% 0.00% -0.09% -0.12% 0.01% -0.13% -0.18%
Total Welfare 0.08% 0.20% 0.01% 0.06% 0.09% 0.05% -0.01% -0.09%
Local Benefits (% of GDP)* 0.06% 0.16% 0.01% 0.11% 0.17% 0.04% 0.10% 0.07%
For the sectoral results (Table 12) only the case with recycling through the SS contributions is reproduced hereafter (the other results are given in annex). At sectoral level, the energy intensive sectors are the most affected by the policy with a shift to consumer goods and service sectors and this both for domestic production and exports.
Table 12: Sectoral impact in the New Member States of the implementation of the minimum energy tax in these countries when recycling through reduction of
employers' social security contributions in 2010
(% difference compared to reference)
Sectoral Aggregates Hungary Poland Slovenia Czech
Republic
Slovakia Estonia Lithuania Latvia Domestic Production in Volume
Agriculture 0.02% 0.07% 0.02% 0.36% 0.40% 0.10% 0.19% 0.18%
Energy Production -0.64% -1.18% -0.42% -1.07% -0.86% -0.27% -0.24% -0.40%
Ferrous and non ferrous metals -0.34% -0.59% -0.37% -0.55% -0.93% -0.06% 0.00% -0.10%
Chemical Products -0.32% -0.04% 0.01% -0.04% 0.03% -0.01% 0.08% 0.15%
Other energy intensive -0.15% -0.13% -0.06% 0.16% 0.06% 0.03% 0.00% 0.02%
Electric Goods 0.01% -0.04% -0.02% -0.01% 0.13% 0.09% 0.00% 0.11%
Transport equipment -0.03% 0.01% 0.04% -0.35% -0.16% -0.48% -0.34% -0.41%
Other Equipment Goods 0.01% -0.10% 0.02% -0.10% 0.00% 0.03% -0.02% 0.11%
Consumer Goods Industries -0.04% 0.05% 0.05% 0.36% 0.40% 0.11% 0.18% 0.12%
Construction 0.02% -0.02% 0.00% 0.06% 0.06% 0.03% 0.02% 0.01%
Telecommunication Services 0.04% -0.04% 0.03% 0.29% 0.29% 0.15% 0.12% 0.10%
Transport 0.02% -0.23% 0.03% 0.26% 0.19% 0.11% 0.10% 0.23%
Services of credit and insurances 0.03% 0.20% 0.02% 0.14% 0.10% 0.25% 0.05% -0.05%
Other Market Services 0.03% 0.05% 0.03% 0.04% 0.09% 0.12% 0.02% 0.04%
Non Market Services 0.11% 0.03% 0.01% 0.21% 0.20% 0.04% 0.02% 0.04%
Exports in Volume
Agriculture 0.03% -0.21% 0.06% 0.29% 0.40% -0.09% -0.02% -0.14%
Energy Exports -0.03% -0.20% 0.01% -0.83% -0.36% -0.07% 0.04% 0.02%
Ferrous and non ferrous metals -0.43% -0.85% -0.53% -0.84% -1.20% -0.06% 0.02% -0.10%
Chemical Products -0.49% -0.05% 0.01% -0.25% -0.12% -0.03% 0.05% 0.15%
Other energy intensive -0.33% -0.20% -0.12% 0.33% 0.14% -0.01% 0.03% 0.07%
Electric Goods 0.03% 0.05% 0.04% 0.09% 0.28% 0.08% 0.11% 0.18%
Transport equipment -0.03% -0.01% 0.04% 0.18% 0.19% -0.05% 0.08% 0.09%
Other Equipment Goods 0.05% 0.04% 0.04% 0.26% 0.27% 0.02% 0.06% 0.19%
Consumer Goods Industries -0.10% -0.01% 0.06% 0.37% 0.57% -0.01% 0.12% 0.11%
Construction 0.01% 0.01% 0.04% 0.39% 0.32% -0.01% 0.27% 0.17%
Telecommunication Services 0.07% 0.00% - 0.46% 0.55% -0.13% 0.18% 0.13%
Transport 0.03% -0.45% 0.09% 0.44% 0.30% 0.10% 0.19% 0.27%
Services of credit and insurances 0.11% 0.25% 0.07% 0.37% 0.38% -0.08% 0.20% -0.04%
Other Market Services 0.00% 0.00% 0.05% 0.21% 0.08% -0.02% 0.07% 0.12%
Non Market Services 0.08% 0.25% 0.06% 0.20% 0.40% 0.04% 0.16% 0.12%
Price of Exports rel. to EU average
Agriculture -0.01% 0.16% -0.03% -0.16% -0.21% 0.07% 0.02% 0.11%
Ferrous and non ferrous metals 0.18% 0.37% 0.22% 0.37% 0.53% 0.01% -0.03% 0.03%
Chemical Products 0.23% 0.03% 0.00% 0.13% 0.08% 0.03% -0.02% -0.06%
Other energy intensive 0.15% 0.09% 0.05% -0.15% -0.06% 0.00% -0.01% -0.03%
Electric Goods -0.01% -0.02% -0.02% -0.03% -0.14% -0.04% -0.05% -0.09%
Transport equipment 0.01% 0.00% -0.01% -0.10% -0.13% 0.00% -0.03% -0.10%
Other Equipment Goods -0.02% -0.02% -0.02% -0.11% -0.14% -0.01% -0.02% -0.08%
Consumer Goods Industries 0.05% 0.01% -0.02% -0.13% -0.19% 0.01% -0.05% -0.02%
Construction 0.03% 0.02% 0.01% -0.24% -0.18% 0.04% -0.16% -0.08%
Telecommunication Services -0.04% 0.01% -0.04% -0.31% -0.34% 0.10% -0.11% -0.08%
Transport -0.04% 0.22% -0.06% -0.23% -0.16% -0.05% -0.10% -0.13%
Services of credit and insurances -0.08% -0.17% -0.08% -0.30% -0.27% 0.08% -0.14% 0.04%
Other Market Services -0.03% -0.14% -0.05% -0.21% -0.16% 0.06% -0.04% -0.08%
Non Market Services 0.04% -0.20% 0.08% -0.17% -0.37% 0.11% -0.10% -0.02%
This scenario with the minimum energy taxation implemented in all EU countries is used as the reference scenario for the evaluation of the following scenarios, the choice of recycling strategy depending on the policy scenario evaluated.
4.2. Upgrading the minimum tax proposal (scenario 2) 4.2.1. Assumptions
The levels of the minimum taxes in the directive remaining rather low, this scenario assumes a gradual upwards adjustment of these rates to take into account the EU climate policy goals. The higher rates would be applied in the whole EU, inclusive the new Member States, above the minimum rates. The national taxes continue to be applied if they are higher than the upgraded minimum tax.
The setting of the scenario is similar to the one built in the previous energy tax study. To increase the
"environmental friendliness" of energy taxation, the minimum rates are made dependent on the carbon content of the energy product and their level are increased so that it would correspond in 2010 to 10€/t of CO2. The choice of this level is arbitrary as such, but could be justified on the ground that it is a bit lower than the estimates of marginal CO2 abatement costs associated with the EU Kyoto target, obtained in model simulations (CAFE simulations with the PRIMES model).
The structure of the rates for different energy products corresponding to these two target levels is displayed in the table below, also showing the current level of EU minimum rates for the sake of comparison.
Table 13: The level of tax rates for different energy products corresponding to a carbon tax of 10€/t.
10€/tCO2 EU minimum rates 2004
Energy product €/GJ €/GJ €/Phys. unit
Coal 0.97 0.15-0.30 0.15-0.3/GJ
Heavy fuel oil 0.77 0.37 15/ton
Light fuel oil/gas oil 0.73 0.58 21/1000 l
Natural gas 0.56 0.15 0.15-0.3/GJ
Petrol 0.69 10.27 359/1000 l
Diesel 0.73 8.10 302-330 /1000 l
Electricity 1.18 0.14 0.5 -1.0/MWh
The rate on electricity is computed taking into account the CO2 emissions of the electricity sector and the electricity production in 2000 in the EU according to EUROSTAT statistics. It reflects the EU average fuel use for electricity production.
The EU energy taxes are output taxes in the scenario in the sense that only the final use of energy is taxed. This means that energy products used to produce electricity are not taxed, but only final electricity consumption. Neither any non-energy use energy products is taxed. Such a tax provides incentives for the improvements in energy efficiency but not for CO2 reduction in the energy transformation sector.
Again, two possibilities for the revenue recycling are considered:
1. the revenues are used to decrease the public deficit which alleviates the financial constraint of private economic agents and reduces the interest rate.
2. the revenues are recycled through a decrease of the social security contributions.
4.2.2. Results for the EU
The results at EU level for the scenario are given in Table 14, detailed results by country are given in annex. Though the tax slightly reduces the EU exports, the recycling of the tax revenue through SS contribution has a positive effect on employment and private consumption. With this level of the tax,
the CO2 emissions are reduced by 4% compared to the reference7, while the Kyoto target imposes a reduction of 14% for EU15 given the reference used in this exercise. The mechanism at play is the same as in the minimum tax scenario: the cost increase through the energy tax is partly compensated by the reduction in the social security rate and this limits the impact of this measure on domestic and foreign demand. It is important to remember that in most countries and sectors, the intra-EU exports represent more than 50% of total exports and this limits the negative effect of the export price increase when a harmonised policy is implemented in the EU.
The recycling strategy imposed in this scenario is important for the results. The reduction of the SS contributions by reducing the labour cost allows limiting the price increase due to the energy tax. It has also a positive effect on the real wage and hence on labour income and private consumption and hence a positive impact on welfare. This is not the case when no specific recycling strategy is imposed, the impact on the interest rate remaining very small and does not allow to compensate for the increased energy cost through its impact on investment and consumption.
The impact is greater in the new Member States as the level of energy taxation remain lower there than in most EU15 countries, even with the implementation of the minimum tax. The reduction in CO2 emissions in the New Member States varies between 4 and 12%, compared to an average of 2% in EU15.
In terms of overall welfare, the policy measure is slightly positive, mostly in the New Member States, when recycling the revenue through a reduction of the SS rate, as this policy measure allows a reduction in the labour market distortion. The positive impact goes mainly through an increased private consumption.
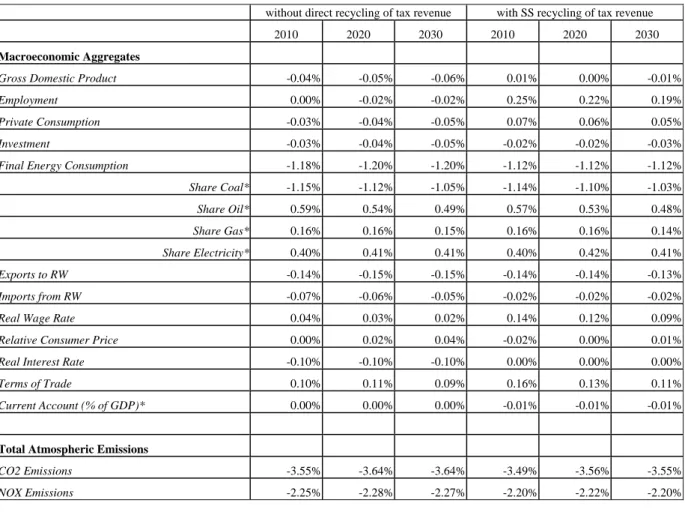
Table 14: Macroeconomic impact at EU level (22countries) of upgrading the minimum energy tax to an equivalent of 10 € per ton CO2
(% difference compared to reference, except for * where difference)
without direct recycling of tax revenue with SS recycling of tax revenue
2010 2020 2030 2010 2020 2030 Macroeconomic Aggregates
Gross Domestic Product -0.04% -0.05% -0.06% 0.01% 0.00% -0.01%
Employment 0.00% -0.02% -0.02% 0.25% 0.22% 0.19%
Private Consumption -0.03% -0.04% -0.05% 0.07% 0.06% 0.05%
Investment -0.03% -0.04% -0.05% -0.02% -0.02% -0.03%
Final Energy Consumption -1.18% -1.20% -1.20% -1.12% -1.12% -1.12%
Share Coal* -1.15% -1.12% -1.05% -1.14% -1.10% -1.03%
Share Oil* 0.59% 0.54% 0.49% 0.57% 0.53% 0.48%
Share Gas* 0.16% 0.16% 0.15% 0.16% 0.16% 0.14%
Share Electricity* 0.40% 0.41% 0.41% 0.40% 0.42% 0.41%
Exports to RW -0.14% -0.15% -0.15% -0.14% -0.14% -0.13%
Imports from RW -0.07% -0.06% -0.05% -0.02% -0.02% -0.02%
Real Wage Rate 0.04% 0.03% 0.02% 0.14% 0.12% 0.09%
Relative Consumer Price 0.00% 0.02% 0.04% -0.02% 0.00% 0.01%
Real Interest Rate -0.10% -0.10% -0.10% 0.00% 0.00% 0.00%
Terms of Trade 0.10% 0.11% 0.09% 0.16% 0.13% 0.11%
Current Account (% of GDP)* 0.00% 0.00% 0.00% -0.01% -0.01% -0.01%
Total Atmospheric Emissions
CO2 Emissions -3.55% -3.64% -3.64% -3.49% -3.56% -3.55%
NOX Emissions -2.25% -2.28% -2.27% -2.20% -2.22% -2.20%