https://doi.org/10.1007/s41064-020-00093-1 ORIGINAL ARTICLE
A New Method of Improving the Azimuth in Mountainous Terrain by Skyline Matching
Balázs Nagy1
Received: 20 August 2019 / Accepted: 23 January 2020 / Published online: 26 February 2020
© The Author(s) 2020
Abstract
Augmented reality (AR) applications have a serious problem with the accuracy of the azimuth angle provided by mobile devices. The fusion of the digital magnetic compass (DMC), accelerometer and gyroscope gives the translation and rotation of the observer in 3D space. However, the precision is not always appropriate since DMC is prone to interference when using it near metal objects or electric currents. The silhouette of ridges separates the sky from the terrain and forms the skyline or horizon line in a mountainous scenery. This salient feature can be used for orientation. With the camera of the device and a digital elevation model (DEM) the correct azimuth angle could be determined. This study proposes an effective method to adjust the azimuth by identifying the skyline from an image and matches it with the skyline of the DEM. This approach does not require manual interaction. The algorithm has also been validated in a real-world environment.
Keywords Computer vision · Visual orientation · Mobile application · Augmented reality Zusammenfassung
Eine neue Methode zur Verbesserung des Azimuts im Bergland auf Basis des Matchings der Horizontlinie. Augmented Reality (AR)-Anwendungen haben oft ein Problem mit der begrenzten Genauigkeit des Azimuts, das von mobilen Geräten geliefert wird. Die Verknüpfung eines digitalen Magnetkompasses, eines Beschleunigungsmessers und eines Vermessungskreisels liefern die Translation und Rotation eines Beobachters im 3D-Raum. Die Genauigkeit ist jedoch nicht immer brauchbar, weil ein Magnetkompass anfällig für Störungen ist, vor allem verursacht durch Metall und elektrische Ströme. Die Silhouette von Bergen bildet die Horizontlinie, die für eine Richtungsbestimmung (Orientierung) genutzt werden kann. Mit einer Kamera und einem digitalen Höhenmodell (DEM) konnte mit guter Genauigkeit das Azimut bestimmt werden. Die Untersuchung schlägt eine effektive Methode vor, um das Azimut eines Magnetkompasses durch Vergleich der Horizontlinie aus einem Bild mit der gerechneten Horizontlinie aus einem DEM zu bestimmen. Dieser Ansatz benötigt keinen manuellen Eingriff.
Der Algorithmus wurde in realen Umgebungen validiert.
1 Introduction
Humans can interpret the environment by processing infor- mation that is contained in visible light radiated, reflected, or transmitted by the surrounding objects. Computer vision algorithms try to perceive images coming from sensors.
Due to bigger and higher resolution screens, smart devices have become suitable for navigation since they are equipped with necessary sensors, such as global navigation satellite
system (GNSS), DMC, accelerometer, and gyroscope.
Despite GNSS, the earth’s magnetic field can be used to obtain a rough estimate of the position and orientation of the observer, the precision of mobile sensors is not high enough for AR applications. The compass can be biased by metal and electric instruments nearby although frequent calibration, so measuring the magnetic north is not reliable.
Several studies, for example (Blum et al. 2013; Hölzl et al.
2013) have examined sensor reliability in real-world tests and showed the error of DMC could be as high as 10◦–30◦ . However, the error of gyroscope and accelerometer are also increasing with the elapsed time, and the accuracy of GNSS could be up to several meters, they are not that critical from the perspective of this research.
* Balázs Nagy
balazs.nagy@outlook.com
1 Department of Mathematics, Corvinus University of Budapest, Budapest, Hungary
Visual localization is a six-dimensional problem of find- ing the position (longitude, latitude, elevation) and orienta- tion (pan, tilt, roll) from a single geotagged photo. Visual orientation from an image requires that the position of the observer is at least roughly given, the photo is taken not far from the ground, and the camera is approximately horizon- tal. That means the problem can be reduced to a one-dimen- sional instance in which the pan angle or in other words, the azimuth need to be determined. Computer vision can help to improve the precision of the sensors by capturing visual clues whose real-world positions are accurately known. This study proposes a method that can exploit the skyline from an image and match it with the panoramic or synthetic skyline extracted from a rendered DEM in real-time. Thus, the ori- entation of the observer can be improved, which is critical in AR applications.
In this paper, the focus is on mobile mountaineering apps that annotate mountain photos by matching images with 3D terrain models and geographic data. Nowadays, the ideal hik- ing app should have the following key features: rendered 3D terrain models, highly detailed spatial data, and AR mode with automatic orientation. Popular AR apps such as Peak- Visor and PeakFinder AR have a well-developed mountain identification function. Some can render the digital terrain model and label the name of peaks nearby and additional information. In some cases, uploaded images can be anno- tated, as well. However, the horizontal orientation is usu- ally imprecise; thus, fine-tuning is required by the user for the perfect result. One of the few applications that employs sophisticated artificial intelligence algorithms is PeakLens, but it focuses solely on this function. The forthcoming and fully panoramic 360◦ version of this app by La Salandra et al.
(2019) can be used with Virtual Reality (VR) devices too.
Lütjens et al. (2019) give a good example of how VR can offer intuitive 3D terrain visualization of geographical data.
The main contribution of this study is a novel edge-based procedure for automatic skyline extraction and a real-time method that increases the accuracy of the azimuth for a future AR application whose operation is demonstrated in
Fig. 1. An original photo taken by the camera can be shown in Fig. 1a; Fig. 1b introduces the DEM with pertinent geo- graphical data; the fusion of the image and information of interest can be seen in Fig. 1c. There are three main steps in the present approach:
1. Panoramic skyline determination from DEM.
2. Skyline extraction from the image.
3. Matching the two skylines.
The rest of the paper is organized as follows: Sect. 2 over- views relevant works in this field; Sect. 3 describes the pro- posed method; Sect. 4 presents the experimental results.
Finally, conclusions and outlook are drawn in Sect. 5.
2 Related Work
In recent years, there has been considerable interest in the challenging task of visual localization in mountainous ter- rain. In natural scenarios, vegetation changes rapidly as well as lighting and weather conditions. Since the most stable and informative feature is the contour of the mountains, i.e., the skyline, thus it can be used for orientation.
Many experts examine the so-called drop-off problem when the observer or an Unmanned Aerial Vehicle (UAV) is dropped off into an unfamiliar environment and try to locate its position. Preliminary work by Stein and Medioni (1995) focuses primarily on pre-computed panoramic sky- line matching with manually extracted skylines. Tzeng et al.
(2013) investigate a user-aided visual localization method in the desert using DEM. Once the user marks the skyline in the query image manually, this feature is looked up in the database of panoramic skylines that is rendered from the DEM. Camera pose and orientation estimation from an image and a DEM were studied by Naval et al. (1997). This non-real-time approach classifies the sky and non-sky pixels by a previously trained neural network. Peaks and peak-like protrusions are used as feature points in the matching phase,
Fig. 1 AR application for peak identification
where pre-calculated synthetic skylines are stored in a data- base which is not favourable in a real-time AR app due to the computation and storage needs.
Fedorov et al. (2016) propose a framework for an outdoor AR application for mountain peak detection called Snow- Watch, and describe the data management approach of it.
Sensor inaccuracy and position alignment are partially dis- cussed in their paper. In contrary to the present study, they take in input the device orientation as well, and they reached a slightly higher peak position error ( 1.32◦ ) on their manu- ally annotated dataset. SwissPeaks is another AR app that overlays peaks that is presented by Karpischek et al. (2009).
The main limitation of the app is that the correct azimuth should be set manually since visual feature extraction or matching was not implemented. Lie et al. (2005) examine skyline extraction by a dynamic programming algorithm that looks for the shortest path on the edge map based on the assumption that the shortest path between image boundaries is the skyline. A similar solution is investigated by Hung et al. (2013), where a support vector machine is trained for classifying skyline and non-skyline edge segments. A comparison of four autonomous skyline segmentation tech- niques that use machine learning is reviewed by Ahmad et al. (2017). The above-mentioned studies focus only sky- line extraction, and their outcomes are hard to compare with the results of this paper.
A non-real-time procedure for visual localization is sug- gested by Saurer et al. (2016). They introduce an approach for large-scale visual localization by extracting skyline from query images and using a collection of pre-generated, vector- quantized panoramic skylines that are determined at regular grid positions. For sky segmentation they use dynamic pro- gramming but their solution requires manual interaction by the operator in case of challenging pictures, which amounted to 40% of the samples. An early attempt has been made by Behringer (1999) to use computer vision methods for improving orientation precision. Due to computation com- plexity, this solution was tested in non-real-time. Baboud et al. (2011) also present an automatic, but non-real-time solution for visual orientation with the aim of annotation and augmentation of mountain pictures. From geographi- cal coordinates and camera FOV, this system automatically determines the pose of the camera relative to the terrain model by using contours extracted from the 3D model. They use an edge-based algorithm for skyline detection, and they propose a novel metric for fine-matching based on the fea- sible topology of silhouette-maps. However, the algorithm is sophisticated, it is not suitable for AR applications. An unsupervised method for peak identification in geotagged photos is examined by Fedorov et al. (2014). They extract the panoramic skyline by edge detection from the rendered DEM, but they do not address exactly how to obtain the skyline from an image.
It is worth to note that infra-red cameras are also put in an application for localization in mountain area, see e.g., Woo et al. (2007). They designed a procedure for UAV navigation based on peak extraction. Special sensors that are sensitive in the IR range could work better under lousy weather or weak light conditions. Unfortunately, a real-world test is not presented in their study.
Visual localization in an urban environment is a related problem. Several studies have been carried out on visual- aided localization and navigation in cities where the sky region is more homogeneous than other parts of the image.
For instance, Ramalingam et al. (2010) employ skyline, and 3D city models for geolocalization in GNSS challenged urban canyons. Zhu et al. (2012) match the panoramic sky- line extracted from a 3D city model with a partial skyline from an image.
3 Method
The proposed method consists of three main stages. The first stage is to determine the panoramic skyline from the DEM by a geometric transformation suggested by Zhu et al.
(2012). After that, the skyline from the image has to be extracted. Finally, the matching is carried out by maximizing the correlation between the two skyline vectors. C++ and OpenSceneGraph were used for panoramic skyline determi- nation. The image processing task and matching were car- ried out by MATLAB (Image Processing Toolbox). Finally, georeferencing was made with the help of Google Earth Pro and QGIS.
3.1 Panoramic Skyline Determination
Panoramic skyline is a vector obtained from the 3D model of the terrain. In this research, publicly available DEMs, SRTM and ASTER were used, sampled at a spatial resolu- tion between 30m and 90m. Depending on the distance of the viewpoint from the target and properties of the terrain in the corresponding geographical area that could be a bit coarse, but in most cases, this resolution was satisfactory.
Figure 2a shows a rendered DEM, where the black triangle is the position of the camera, which was determined by GNSS.
The 360◦ panoramic skyline was calculated from this point by a coordinate transformation, as Fig. 2b shows, where – C(X0,Y0,Z0) is the position of the camera,
– D(X, Y, Z) is an arbitrary point of the DEM, – D�(x�,y�,z�) is the projection of point D.1
1 y�=Y0.
Hereby, each point can be described by the azimuth angle:
and the elevation angle:
where
is the distance between C and D′ and
is the distance between C and D. A 3D to 2D transformation was applied since the height information or the radial dis- tance is no longer required. Azimuth angle 𝜙 and the eleva- tion angle 𝜃 describe any point D in the DEM. Finally, the greatest 𝜃 value determines the demanded point of the sky- line for each 𝜑 . Figure 2c illustrates the panoramic skyline
𝜑=
⎧⎪
⎨⎪
⎩
0, ifX=X0andZ=Z0
arcsin
�z�−Z0 𝜌
�
, ifX≥X0
−arcsin
�z�−Z0 𝜌
�
+𝜋, ifX<X0
𝜃=arcsin
(Y−y� r
) ,
𝜌=
√
(x�−X0)2+ (z�−Z0)2
r=
√
(X−X0)2+ (Y−Y0)2+ (Z−Z0)2
projected on a satellite image. The sharp edges on the left corner, indicate the border of the DEMs because the sky- line was calculated only at a reasonable distance. Figure 2d shows the panoramic skyline vector that will be used in the matching stage.
3.2 Skyline Extraction
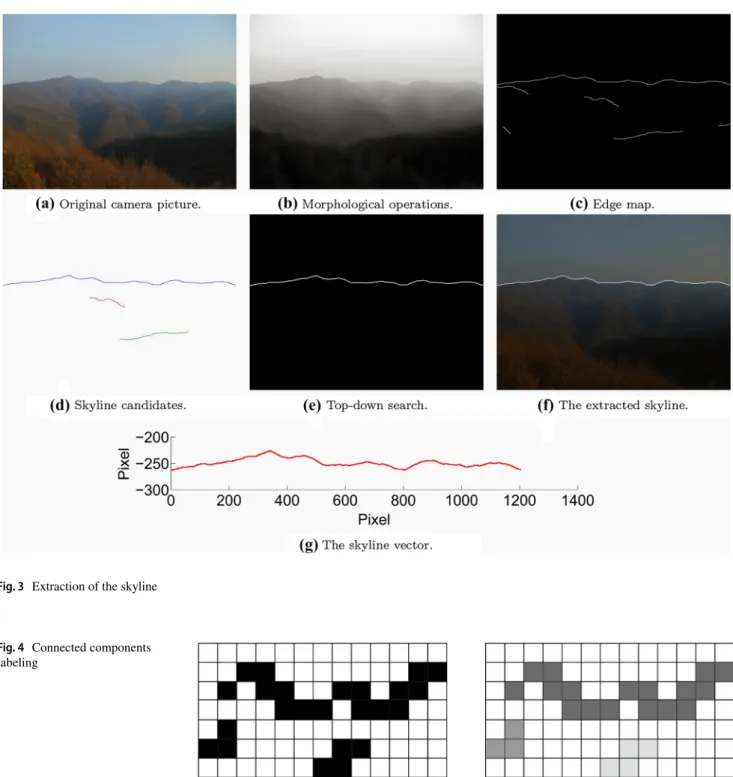
The skyline sharply demarcates terrain from the sky on a landscape photo. An automatic edge-based method is pre- sented in this study for skyline extraction. The idea is based on the experience that large and wide connected components in the upper region of the image usually belong to the sky- line (Fig. 3).
In the feature extraction step connected components labeling was used, which is a well-known algorithm for finding blobs in a binary image and assign a unique label to all pixels of each connected component. Figure 4a shows an input binary image with disjoint edge segments that coloured to different shades of grey in the output, see Fig. 4b. A flood-fill algorithm was applied for finding 8-connected components, i.e., pixels with touching edges or corners. A detailed review on connected components labeling is found in He et al. (2017). It is not necessary to detect the whole skyline since, in most cases, recognizing
Fig. 2 The determination of panoramic skyline
only an essential part of it is enough for matching. On the other hand, it is crucial to extract a piece from the real skyline and not a false edge.
In the preprocessing step morphological operations were carried out to enhance the greyscale image and remove noise. Morphological closing (dilation and erosion) elimi- nate small holes, while morphological opening (erosion and dilation) removes small objects from the foreground that are
smaller than the structuring element. A disk-shaped structur- ing element was used either for closing and opening but with different radius (5 and 10 pixels). Details on morphology can be found in Szeliski (2011).
The algorithm selects the skyline from skyline candi- dates in multiple steps. The candidates (C) were sorted by the function S(C) =𝜇(C) +2𝜌(C) , where 𝜇 measures the number of pixels in the candidate and 𝜌 is the span of the
Fig. 3 Extraction of the skyline
Fig. 4 Connected components labeling
candidate, i.e., the difference between the rightmost and the leftmost pixel coordinates in the image space. Based on the experiments, this function that takes into account the size and the span of C with double weight is proved to be the most efficient. Therefore, larger and broader skyline candi- dates are preferred.
The main steps of the approach are listed below and also illustrated in Fig. 3.
1. Preprocessing
(a) The first step is to resize the original image to 640×480 pixels and adjust the contrast (Fig. 3a).
(b) Based on the observations, the sky is in the sharp- est contrast to the terrain in the blue colour chan- nel in RGB colour space. Thus the blue channel was used as a greyscale picture.
(c) Morphological closing and opening operations are applied for smoothing the outlines, reducing noise, and thereby ignoring the useless details, e.g., edges of tree branches or rocks (Fig. 3b).
(d) The edge detection is carried out by Canny edge detector results in a bitmap that contains the most distinctive edges on the image (Fig. 3c).
2. Connected components labeling detects the connected pixels on the edge map determining the skyline candi- dates. The top three skyline candidates were chosen by the evaluating function S (Fig. 3d).
3. A top-down search selects the first edge pixels from the most probable candidates in each column because the skyline should be on the upper region of the image (Fig. 3e).
4. Since it might make a hole in the real skyline, a bridge operation fills the one-pixel gaps.
5. A second connected component analysis eliminates the left-over pieces from the edge map and selects the larg- est one as the presumed skyline (Fig. 3f).
6. Finally, the skyline was vectorized in order to make matching more effective (Fig. 3g).
3.3 Skyline Matching
The last stage of the proposed method is matching the pano- ramic skyline and the recognized fragment of the skyline from the image. That point from where the skyline vectors interlock was looked for, i.e., the image skyline fits into the panoramic skyline, from where 𝜑 could be obtained.
For a proper comparison, the Horizontal Field of View (HFOV) of the camera and the panoramic skyline2 need to
be synchronized via the sampling rate of the two signals.
For the sake of simplicity, the first index of the panoramic skyline vector corresponds to 0◦ (north) as a reference point.
In the case of a partially extracted image skyline, the gap also should be considered in accordance with HFOV, i.e., the total width of the skyline is estimated.
Then, normalized cross-correlation (a⋆b) was used which is often applied in signal processing tasks as a meas- ure of similarity between a vector a (panoramic skyline) and shifted (lagged) copies of a vector b (extracted skyline) as a function of the lag k. After calculating the cross-correlation between the two vectors, the maximum of the cross-corre- lation function indicates the point K where the signals are best aligned:
From K the azimuth angle 𝜑 can be determined, and the estimated horizontal orientation can be acquired. As it was mentioned above, the camera is supposed to be approxi- mately horizontal when the picture was taken, though the skyline could be slightly slanted. However, cross-correlation proved to be insensitive to this kind of inaccuracy, thus this approach is appropriate for matching the skylines. An exam- ple of matching the two skylines is presented in Fig. 5.
4 Experimental Results
The goal of this study was to develop a procedure that can determine the exact orientation of the observer in a moun- tainous environment by a geotagged camera picture and a DEM. The main contribution of this paper was an edge- based skyline extraction method. Thus the first part of this section demonstrates the results on sample images. The sec- ond part is about calculating 𝜑 and comparing the results with the ground truth azimuth angles ( 𝜑̂ ) determined by traditional cartographic methods using reference objects in the image.
K= argmax
0◦≤k<360◦
((a⋆b)(k)).
Fig. 5 Matching of the panoramic skyline (blue curve) and the sky- line extracted from the image (red curve)
2 The HFOV of the panoramic skyline is 360◦.
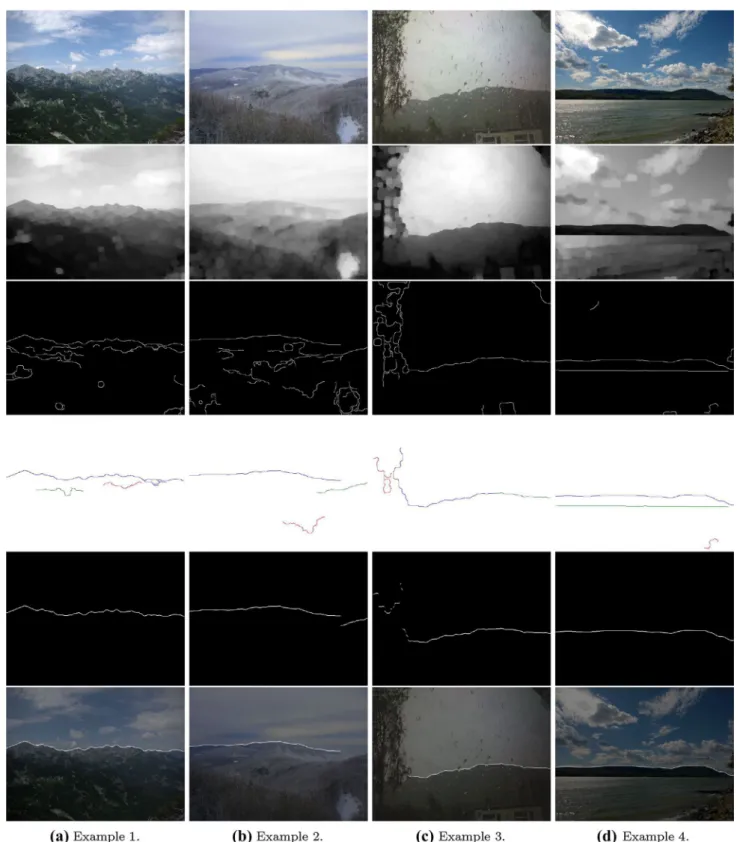
Fig. 6 Various successful examples of automatic skyline extraction:
a shows a craggy mountain ridge with clouds and rocks that could mislead an edge detector; in b the snowy hills blend into the cloudy sky mountain which makes skyline detection difficult; c is taken from
behind a blurry window, where raindrops and occluding tree branches could impede the operation of an algorithm; d demonstrates a hard contrast image with clear skyline, however clouds might induce false skyline edges
4.1 Skyline Extraction
Skyline extraction is a crucial task in this method. The whole pattern is not necessarily needed for the correct alignment;
in most cases, only a characteristic part of the skyline is enough for the orientation. The algorithm was tested on a sample set that contains mountain photos from various loca- tions, seasons, under different weather and light conditions.
The goal was to extract the skyline feature as precisely as possible and classify the outputs. The pictures were made by the author or they were downloaded from Flickr under the appropriate Creative Commons license. The collection consists of 150 images with 640×480 pixels resolutions and 24-bit colour depth. Experiments showed this resolution provides suitable results considering computation perfor- mance, as well. Figure 6 illustrates the extraction steps on four different instances. For details on the steps, see Sect. 3.
The outputs were grouped into four classes according to the quality (%) of the result. The evaluation was done manu- ally because type I and type II errors also can occur, and an objective measure is difficult to create.
– Perfect: [95–100%]; the whole skyline is detected, and no interfering fragments found.
Table 1 Results of automatic
skyline extraction method Class Rate (%)
Perfect 56.67
Good 32.67
Poor 8.00
Bad 2.67
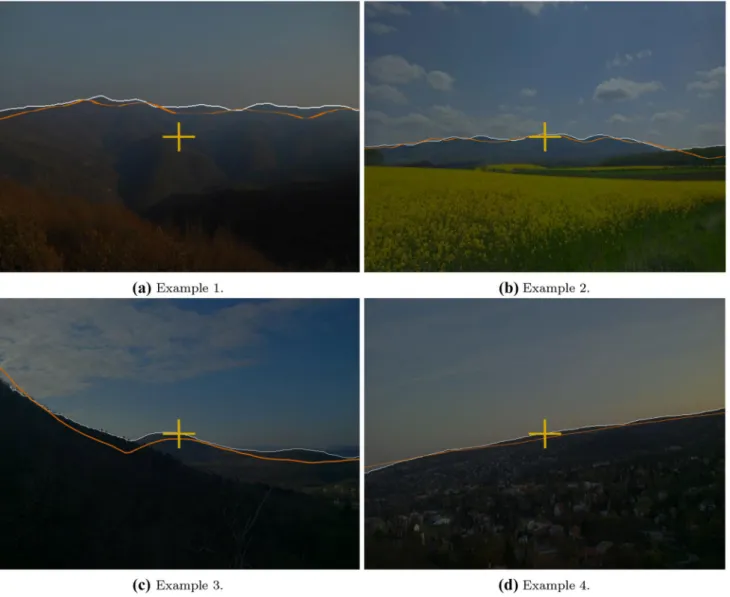
Fig. 7 Example test images for the reference measurements in the field with the extracted skyline (white), panoramic skyline (orange) and the reference object (yellow cross) that was aligned to the center
of the photo. The main difference between the two skylines is due to coarse DEM and vegetation
– Good: [50–95%]; the better part of the skyline is detected, and possible errors do not affect the analyses.
– Poor: [5–50%]; only a small part of the skyline is detected, and possible errors might affect the analyses.
– Bad: [0–5%]; the detected edges do not belong to the skyline.
Table 1 shows that the extracted skylines assigned to perfect or good classes in more than 89% of the samples. In these cases, the extracted features are suitable for matching in the next algo- rithm phase. It is noteworthy that the rate of poor is 8% and bad outcomes is less than 3% . When the algorithm fails, the difficul- ties usually arise from occlusion, foggy weather, or low light conditions. Sometimes, in hard contrast pictures with plenty of edges, e.g., deceptive clouds, or rocks, the largest connected component did not necessarily belong to the skyline and it is difficult to find the horizon line even with the naked eye.
4.2 Field Tests
Unfortunately, it was not possible to compare the results directly with those obtained by other algorithms discussed earlier, due to the different problems they addressed. There- fore, field tests were made by the author to measure the performance of the method. The experiments aimed to determine the orientation using only a geotagged photo and the DEM. A Microsoft Surface 3 tablet was employed, which has in-built GNSS sensor and an 8MP camera sen- sor with 53.5◦ HFOV. Various pictures were collected in the mountains with clearly identifiable targets, e.g., church or transmission towers, and aligned them into the center of the image with help of an overlying grid. The EXIF data contains the position, so the recognizable target concerning the viewpoint could be manually referred, i.e., ( 𝜑̂ ) for the 10 sample images. The low sample size is due to the difficult
task of manually orientate test points and the lack of a pub- licly available image data set with georeferenced objects.
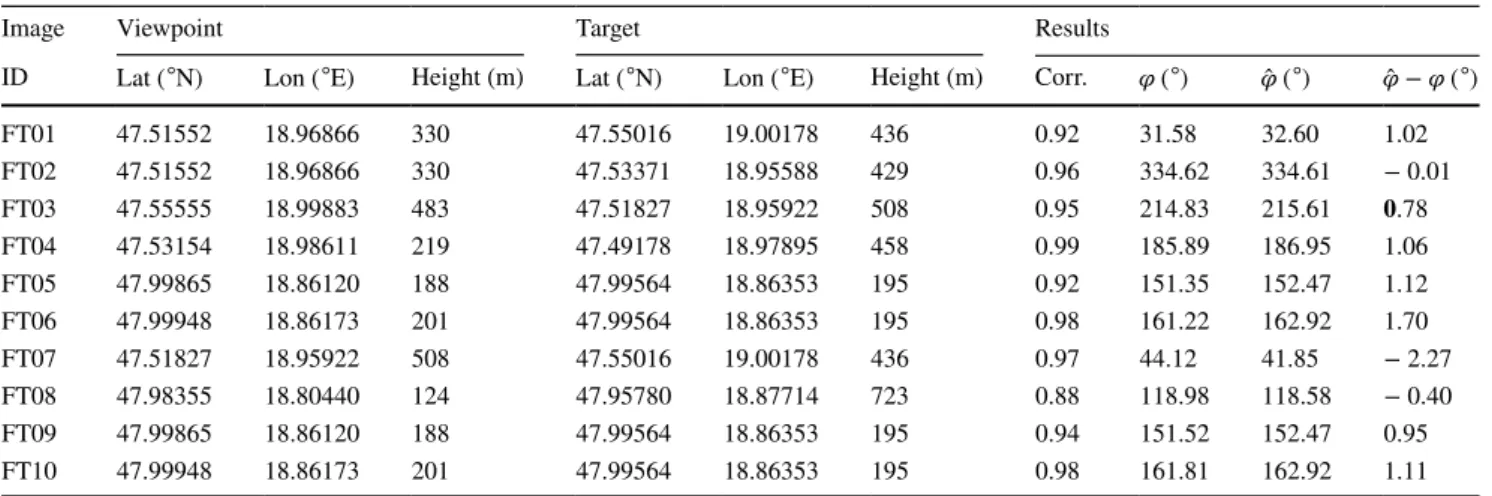
Figure 7 and Table 2 present examples and the experi- mental results of the field tests. Only good or perfect skylines were accepted for this test and the correlation was almost 95% on average. The mean of absolute differences between 𝜑̂ and 𝜑 was 1.04◦ , which is auspicious and could be enhanced with a higher resolution DEM. As it was mentioned in Sect. 1 the error of DMC could be 10–30°. Measuring the inaccuracy of the compass sensor was beyond the scope of this study. Nevertheless, this problem was experienced dur- ing field tests. The benefit of the proposed algorithm is the more accurate orientation by the camera picture and a DEM instead of the unreliable DMC. The purpose of field tests was to demonstrate the precision that can be achieved with this method. In the tests the main reasons for the average 1.04◦ error were the coarse resolution of DEMs and the veg- etation, as can be seen in the examples of Fig. 7a–d. Since cross-correlation proved to be less sensitive to this kind of inaccuracy, thus it is applied in the matching phase.
5 Conclusions and Outlook
This study proposed an automatic, computer vision-based method for improving the azimuth measured by the unre- liable DMC sensor in mountainous terrain. The aim was to develop an algorithm for an outdoor AR app that over- lays useful information about the environment from a Geo- graphic Information System (GIS), e.g., peak name, height, distance. The main contribution of this work is the robust skyline extraction procedure based on connected compo- nents labeling. The skyline was extracted successfully in more than 89% of the sample set that contains various moun- tain pictures. Furthermore, field tests were also carried out to verify skyline matching. The deviation of the azimuth angle
Table 2 Result of the field tests
Image Viewpoint Target Results
ID Lat ( ◦N) Lon ( ◦E) Height (m) Lat ( ◦N) Lon ( ◦E) Height (m) Corr. 𝜑 ( ◦) 𝜑̂ ( ◦) 𝜑̂−𝜑 ( ◦)
FT01 47.51552 18.96866 330 47.55016 19.00178 436 0.92 31.58 32.60 1.02
FT02 47.51552 18.96866 330 47.53371 18.95588 429 0.96 334.62 334.61 − 0.01
FT03 47.55555 18.99883 483 47.51827 18.95922 508 0.95 214.83 215.61 0.78
FT04 47.53154 18.98611 219 47.49178 18.97895 458 0.99 185.89 186.95 1.06
FT05 47.99865 18.86120 188 47.99564 18.86353 195 0.92 151.35 152.47 1.12
FT06 47.99948 18.86173 201 47.99564 18.86353 195 0.98 161.22 162.92 1.70
FT07 47.51827 18.95922 508 47.55016 19.00178 436 0.97 44.12 41.85 − 2.27
FT08 47.98355 18.80440 124 47.95780 18.87714 723 0.88 118.98 118.58 − 0.40
FT09 47.99865 18.86120 188 47.99564 18.86353 195 0.94 151.52 152.47 0.95
FT10 47.99948 18.86173 201 47.99564 18.86353 195 0.98 161.81 162.92 1.11
provided by the algorithm and the ground truth azimuth was examined, and 1.04◦ average accuracy was reached. Perfor- mance issues were beyond the scope of this study. Neverthe- less, the algorithm is time and storage efficient, the results are promising and they showed that the proposed method can be applied as an autonomous, highly accurate orien- tation module in a real-time AR application that is under development. With suitable data and some adaptation, the system could be also used for visual localization in GNSS challenged urban environment.
Acknowledgements Open access funding provided by Corvinus Uni- versity of Budapest (BCE). I gratefully acknowledge the help provided by Ákos Nagy and Balázs Hayth, and I wish to thank Prof. Attila Tas- nádi for his valuable suggestions.
Compliance with ethical standards
Conflict of Interest The author declares that he has no conflict of in- terest.
Open Access This article is licensed under a Creative Commons Attri- bution 4.0 International License, which permits use, sharing, adapta- tion, distribution and reproduction in any medium or format, as long as you give appropriate credit to the original author(s) and the source, provide a link to the Creative Commons licence, and indicate if changes were made. The images or other third party material in this article are included in the article’s Creative Commons licence, unless indicated otherwise in a credit line to the material. If material is not included in the article’s Creative Commons licence and your intended use is not permitted by statutory regulation or exceeds the permitted use, you will need to obtain permission directly from the copyright holder. To view a copy of this licence, visit http://creat iveco mmons .org/licen ses/by/4.0/.
References
Ahmad T, Campr P, Čadík M, Bebis G (2017) Comparison of semantic segmentation approaches for horizon/sky line detection. In: Pro- ceedings of the international joint conference on neural networks 2017, pp 4436–4443. https ://doi.org/10.1109/IJCNN .2017.79664 Baboud L, Čadík M, Eisemann E, Seidel HP (2011) Automatic photo-18 to-terrain alignment for the annotation of mountain pictures.
In: Proceedings of the IEEE computer society conference on computer vision and pattern recognition, pp 41–48. https ://doi.
org/10.1109/CVPR.2011.59957 27
Behringer R (1999) Registration for outdoor augmented reality appli- cations using computer vision techniques and hybrid sensors.
In: Proceedings IEEE virtual reality, pp 244–251. https ://doi.
org/10.1109/VR.1999.75695 8
Blum JR, Greencorn DG, Cooperstock JR (2013) Smartphone sensor reliability for augmented reality applications. In: Zheng K, Li M, Jiang H (eds) Mobile and ubiquitous systems: computing, net- working, and services. Springer, Berlin, pp 127–138
Canny J (1986) A computational approach to edge detection. IEEE Trans Pattern Anal Mach Intell 8(6):679–698. https ://doi.
org/10.1109/TPAMI .1986.47678 51
Farr TG, Rosen PA, Caro E, Crippen R, Duren R, Hensley S, Kobrick M, Paller M, Rodriguez E, Roth L, Seal D, Shaffer S, Shimada J, Umland J, Werner M, Oskin M, Burbank D, Alsdorf D (2007)
The shuttle radar topography mission. Rev Geophy 45(2). https ://
doi.org/10.1029/2005R G0001 83
Fedorov R, Fraternali P, Tagliasacchi M (2014) Mountain peak identi- fication in visual content based on coarse digital elevation models.
In: Proceedings of the 3rd ACM international workshop on multi- media analysis for ecological data. ACM, pp 7–11
Fedorov R, Frajberg D, Fraternali P (2016) A framework for outdoor mobile augmented reality and its application to mountain peak detection. In: De Paolis LT, Mongelli A (eds) Augmented real- ity, virtual reality, and computer graphics. Springer, pp 281–301 He L, Ren X, Gao Q, Zhao X, Yao B, Chao Y (2017) The connected- component labeling problem: a review of state-of-the-art algo- rithms. Pattern Recognit 70:25–43. https ://doi.org/10.1016/j.patco g.2017.04.018
Hung YL, Su CW, Chang YH, Chang JC, Tyan HRHR (2013) Sky- line localization for mountain images. In: ICME, IEEE computer society, pp 1–6
Hölzl M, Neumeier R, Ostermayer G (2013) Analysis of compass sen- sor accuracy on several mobile devices in an industrial environ- ment. Second international workshop on mobile computing plat- forms and technologies (MCPT 2013), Colocated with Eurocast 2013. Springer, Berlin, pp 381–389
Karpischek S, Marforio C, Godenzi M (2009) Swisspeaks mobile aug- mented reality to identify mountains. In: Proceedings of the 3rd european conference on ambient intelligente
La Salandra A, Frajberg D, Fraternali P (2019) A virtual reality appli- cation for augmented panoramic mountain images. Virtual Real- ity. https ://doi.org/10.1007/s1005 5-019-00385 -x
Lie WN, Lin TCI, Lin TC, Hung KS (2005) A robust dynamic pro- gramming algorithm to extract skyline in images for navigation.
Pattern Recogn Lett 26(2):221–230. https ://doi.org/10.1016/j.
patre c.2004.08.021
Lütjens M, Kersten T, Dorschel B, Tschirschwitz F (2019) Virtual real- ity in cartography: immersive 3D visualization of the arctic clyde inlet (Canada) using digital elevation models and bathymetric data. Multimodal Technol Interact 3(1):9. https ://doi.org/10.3390/
mti30 10009
NASA, METI, AIST, Japan Spacesystems, and US, Japan ASTER Sci- ence Team, (2009) ASTER global digital elevation model. NASA EOSDIS land processes DAAC. https ://doi.org/10.5067/ASTER /ASTGT M.002
Naval PC, Mukunoki M, Minoh M, Ikeda K (1997) Estimating camera position and orientation from geographical map and mountain image. In: 38th research meeting of the pattern sensing group, society of instrument and control engineers, pp 9–16
Politecnico di Milano (2019) PeakLens. https ://peakl ens.com, last Accessed August 13, 2019
Ramalingam S, Bouaziz S, Sturm P, Brand M (2010) SKYLINE2GPS:
localization in urban canyons using omni-skylines. In: IEEE/RSJ 2010 international conference on intelligent robots and systems, IROS 2010 - conference proceedings, vol 2010, pp 3816–3823, https ://doi.org/10.1109/IROS.2010.56491 05
Routes Software SRL (2019) PeakVisor. https ://peakv isor.com, last Accessed August 6, 2019
Saurer O, Baatz G, Köser K, Ladický L, Pollefeys M (2016) Large- scale visual geo-localization. Advances in computer vision and pattern recognition, pp 205–223. https ://doi.org/10.1007/978-3- 319-25781 -5
Soldati F (2019) PeakFinder AR. https ://peakfi nder .ch. Accessed 6 Aug 2019
Stein F, Medioni G (1995) Map-based localization using the panoramic horizon. IEEE Trans Robot Autom 11(6):892–896. https ://doi.
org/10.1109/70.47843 6
Szeliski R (2011) Computer vision - algorithms and applications. Texts in computer science. Springer. https ://doi.org/10.1007/978-1- 84882 -935-0
Tzeng E, Zhai A, Clements M, Townshend R, Zakhor A (2013) User- driven geolocation of untagged desert imagery using digital eleva- tion models. In: IEEE computer society conference on computer vision and pattern recognition workshops, pp 237–244, https ://
doi.org/10.1109/CVPRW .2013.42
Woo J, Son K, Li T, Kim G, Kweon IS (2007) Vision-based UAV navi- gation in mountain area. In: Proceedings of the IAPR conference
on machine vision applications 2007), May 16–18, 2007, Tokyo, Japan, vol 1, pp 3–6
Zhu S, Pressigout M, Servières M, Morin L, Moreau G (2012) Skyline matching: a robust registration method between video and GIS.
In: Usage, usability, and utility of 3D city models, p 7. https ://doi.
org/10.1051/3u3d/20120 3007