Int. J. Production Economics 233 (2021) 108006
Available online 31 December 2020
0925-5273/© 2020 The Author(s). Published by Elsevier B.V. This is an open access article under the CC BY license (http://creativecommons.org/licenses/by/4.0/).
Mapping quality linkages based on tacit knowledge
Thomas B. Ladinig
a,*, Gyula Vastag
b,caSz´echenyi Istv´an University, Gy˝or, Hungary
bCorvinus University of Budapest, Hungary
cNational University of Public Service, Budapest, Hungary
A R T I C L E I N F O Keywords:
Soft quality management Concept mapping Knowledge creation
A B S T R A C T
A structured conceptualization method, concept mapping, is applied to visualize the conceptual domain of explicit and tacit quality linkages in a complex, causally ambiguous production system of a premium automotive OEM. Experts, intimately familiar with all facets of the conceptual domain, defined sources of quality problems and rated their impact on product quality. These inputs, formative measures for a latent construct, were used to create concept maps and clusters for the sources of quality problems. Differences and disagreements between subgroups were highlighted by pattern matching. The concept map and the preferred cluster solution, based on user-defined measures, served as inputs in the development of a causal loop diagram and an action plan for better resource allocation to specific improvement activities. The approach, using formative rather than the more commonly used reflective indicators, uses key informants and explanation building processes of high internal validity. In the spirit of the “proximal similarity model,” the presented methodology is also highly transferable to similar settings of other automotive OEMs and beyond.
1. Introduction
Lippman and Rumelt (1982) describe causal ambiguity as the degree to which decision makers understand input-output performance link- ages when creating and managing complex processes. In complex manufacturing systems with correlated stages, interdependencies, un- certainties and, consequently, with many sources of causal ambiguity, it is critical to identify linkages that affect the quality of the final product (Zantek et al., 2002). The authors observed issues related to causal ambiguity and quality linkages in a manufacturing unit of a premium automotive OEM – producing many exterior body parts (doors, tail gate, bonnet, side panels) for six luxury sports cars and their variants – with several correlated stages and highly variable inputs per process (e.g., machines, materials). As product performance, in terms of quality, was a competitive priority for this business unit in particular and for similar production systems in general (Schmenner and Vastag, 2006), man- agement wanted to improve their understanding of factors affecting overall product quality. The goal was to identify the most important factors and related solutions to enhance quality performance within the whole value stream of the production system.
In this unit, quality costs were high due to the many changes in machine parameters required to ensure proper quality levels of a highly
heterogeneous product mix with many changeovers and low batch sizes.
In the past, several attempts had been made to improve quality assur- ance and overall quality; yet a significant number of products had to be scrapped (around 7% on average over all products; up to 23% for the most difficult parts) or reworked. It was not clear to management which of the many factors, and what subsequent processes, had the most sig- nificant impact on quality. Data generated in one step of the process could not be linked to errors detected in the following steps and no decisions could be made to holistically improve quality over the whole value stream. Overall, there was a general lack of understanding of resource allocation towards the most efficient and effective quality improvement initiatives. It became extremely difficult for management to define policies without a clear picture of quality linkages and issues that would lead to higher quality performance.
The authors decided to use a structured conceptualization methodol- ogy (Trochim and Linton, 1986), called concept mapping, to map the conceptual framework of quality and quality linkages within the system.
The reasoning was that by creating a holistic picture of the problem domain, based on the tacit knowledge and experience of the engineers of the system, learning and understanding of cause-and-effect relationships could be facilitated. Concept mapping was chosen because it is more suitable to deal with causal ambiguity and it is more likely to create a
* Corresponding author. Egyetem t´er 1., 9026, Gy˝or, Hungary, Room: ÚT-223, ÚT-224.
E-mail address: t.ladinig@yahoo.com (T.B. Ladinig).
Contents lists available at ScienceDirect
International Journal of Production Economics
journal homepage: http://www.elsevier.com/locate/ijpe
https://doi.org/10.1016/j.ijpe.2020.108006
Received 3 January 2020; Received in revised form 11 December 2020; Accepted 15 December 2020
more complete understanding of the system, as described in section 3.
The goal was to use concept maps, consisting of all known quality issues, to ultimately select and plan quality improvement initiatives for the production system. Additionally, based on the results of the concept map, a causal loop diagram was created to further analyze casual re- lationships within the conceptual domain. Finally, the paper – using the results of concept mapping – presents an action plan for quality improvement to the management team of the business unit.
The structure of the paper is as follows: section 2 describes the literature on tools and principles of knowledge creation, process improvement and innovation, and gives an overview of concept map- ping. Section 3 introduces the methodology of concept mapping in detail. Section 4 provides the description of the company’s business unit and the quality management system used. Section 5 deals with the practical application of concept mapping and the exploratory case study within the business unit. We summarize the results in section 6. Theo- retical and practical insights are discussed in the seventh, final, section of the paper.
2. Literature review
One of the central drivers of performance in complex social systems, like modern manufacturing plants or supply chains, is the behavior of individuals, groups, or the whole organization (Gino and Pisano, 2008).
This is also the case for quality management (QM), where an increasing number of authors specifically investigate behavioral factors (soft QM) in their studies (Rahman and Bullock, 2005; Gadenne and Sharma, 2009; Zeng et al., 2015; Cho et al., 2017). According to Escrig-Tena et al.
(2018), “soft QM gathers the human features of QM, while hard QM covers practices based on technical and methodological issues”. Soft factors, or soft quality management, include organizational learning and knowledge creation, top management philosophy and engagement, and increased interaction and empowerment of employees. Those factors are critical in most areas of operations management and, for that matter, in QM. The focus of how QM can enhance organizational learning and innovation (and vice-versa) is a central aspect of research in QM (Fundin et al., 2018; Asif, 2019; Dahlgaard et al., 2019) and the theoretical basis for our practical application. This is further reinforced by the growing importance of learning and knowledge management in the industry as shown by the changes made in the 2015 update of the ISO 9001 standard of quality management systems illustrated by Wilson and Campbell (2020).
2.1. Soft quality management and organizational learning
Mukherjee et al. (1998) defined two types of learning in an organi- zation: conceptual and operational. Operational learning is focused on implementing and observing factors in an operative setting and drawing conclusions directly from experiences of problems in processes and solving those issues to achieve short-term goals. Conceptual learning, on the other hand, is more related to the assessment of cause-and-effect relationships and the design of abstract concepts. The authors concluded that conceptual learning is better suited to analyze more important factors of organizational learning and firm performance. In the long-term, it is more valuable, for example, to pay more attention to measured variables and to learn the specific impact of factors on process variability and quality. This approach, compared to short-term opera- tional problem solving, would ensure more efficient and effective quality improvement based on a deeper and broader understanding of causalities. The authors specifically consider behavioral factors, orga- nizational behavior, dynamic complexity, and ambiguity when comparing those two forms of learning in quality improvement. A more conceptual focus is therefore necessary to explore quality linkages in complex production systems with causal ambiguity.
Choo et al. (2007) distinguish between two forms of learning, simi- larly to Mukherjee et al. (1998): exploratory learning and exploitation
learning. Exploitation learning, like operational learning, is focused on the application of methodological elements in an operative setting by using explicit knowledge - knowledge that can be captured and stored in manuals and guidelines (Polanyi, 1966). Exploratory learning is aimed at creating novel ideas and innovative solutions based contextual ele- ments (soft issues) and tacit knowledge – the other form of ‘hidden’
knowledge held in the minds of people, which cannot be easily accessed and transferred (Polanyi, 1966). While methodological elements contain metrics, tools, and stepwise problem-solving approaches to facilitate standardized and explicit quality programs, contextual elements include soft issues like leadership, collaboration, and trust, to boost tacit knowledge creation through empowerment. More innovative solutions for quality problems based on tacit knowledge produce sustainable competitive advantage because they are difficult to imitate (Winter 1987). This makes tacit knowledge a more valuable resource for a company, according to the resource-based view (RBV) of the firm (Barney, 1991), and should be the focus of learning and knowledge creation in QM.
In the framework of Nonaka (1991), knowledge creation and dissemination of tacit knowledge from an individual to that of the group is called socialization. While methods to create and disseminate explicit knowledge (e.g., simulation, regression, value stream maps, fishbone diagrams, etc.) are relatively straightforward, it is not so transparent with tacit knowledge. Anand et al. (2010) mention practices like brainstorming or nominal group technique (Bartunek and Murninghan, 1984) for socialization of tacit knowledge in their study on the role of tacit knowledge in Six Sigma projects. They argue that it might be difficult to capture and apply tacit knowledge, especially in cross-functional teams that come together for a short-term project without significant cohesion and developed relationships among group members. It takes a substantial amount of experience and soft skills to facilitate tacit knowledge dissemination among group members in order to find and implement potential “winner” process improvements that could create long-term competitive advantages for the firm.
2.2. Soft quality management, innovation and process improvement Zeng et al. (2015) and Zeng et al. (2017) view small group problem solving and employee suggestions as important aspects of soft QM in that they allow for collective expertise in group decision-making and implementation of problem-solving plans. They claim that firms should promote employee participation in decision-making processes through empowerment and encouragement to ensure process quality, compe- tency, and customer focus. Zeng et al. (2017) found that soft QM has a significant positive impact on hard QM and plays an important role in improved innovation performance, either directly or indirectly through improved hard QM. By promoting soft QM and the integration of worker experience, organizations can achieve higher innovation performance by finding different, and potentially better, solutions to existing problems.
One of the most important factors for the success of soft QM and its impact on innovation performance is the proactive behavior of people within the organization (Escrig-Tena et al., 2018). People need to un- derstand the conceptual framework of quality based on strategy, tactics, processes, competitors, and organizational results to help align employee behavior and organizational objectives with the promotion of innovation based on soft QM and organizational learning (Dahlgaard et al., 2019). The work of Escrig-Tena et al. (2018) indicates that, while soft QM might not have a direct impact on innovation, it can create an infrastructure and atmosphere of empowerment and teamwork that allow employees to act and develop new ideas. Employees fully demonstrate proactive behavior only if they are well-informed about the firm, their work, and the problems they are faced with; thus, making it critical to create a conceptual framework for the environment they work in. Not only is the behavior and understanding of employees important
for finding innovative solutions in complex and dynamic areas, but also the thinking of management plays a significant role in performance improvement. Cho and Linderman (2019) analyzed the impact of managerial metacognition on process improvement practices and firm performance. While cognition is defined as the knowledge structure used to make a decision, metacognition is the higher-order process that controls the underlying knowledge structure. Usually, managers can potentially decide between multiple decision frameworks and different kinds of information to formulate responses to different problems. Cho and Linderman (2019) use the level of understanding of the usage of different kinds of information as a variable to define the metacognitive experience of managers. Also, the conscious focus on important infor- mation and re-evaluation of usability and applicability of different kinds of information are indicators of managerial metacognition. This conscious thinking and understanding of how knowledge should be used and the search for different kinds of information can help management adapt to rapidly changing environments to create a competitive advantage. A holistic awareness of the conceptual domain is critical to reaching higher levels of managerial metacognition to find innovative solutions and to change management’s perception of specific problems and potential solutions.
2.3. Concept mapping
To facilitate tacit knowledge creation and innovation in causally ambiguous production systems, we apply concept mapping to create a 2D representation of the problem domain as seen by a management team and a team of experts. We holistically analyze quality linkages in the small-volume, batch production system of an automotive OEM that faces high degrees of variability and causal ambiguity. Previously, concept mapping has been used extensively in program management, for example, to assess the conceptual framework of staff’s views of a sup- ported employment program for persons with severe mental illness (Trochim et al., 1994). In an operations management context, however, it has been used only very scarcely – for example, to show how man- agement views the benefits of acquiring an ISO 14001 environmental certification and contrasting it with the views of experts (Vastag and Melnyk, 2002). The continued popularity of the methodology in many scientific fields is demonstrated by a recent special publication dedi- cated to it (Trochim and McLinden, 2017).
By creating a visual representation of the conceptual framework of a problem, the applied methodology facilitates proactive behavior to make knowledge explicit and useable for an organization. Concept mapping increases the understanding of employees and includes them in the improvement process. Furthermore, it facilitates innovation and managerial metacognition by unveiling potentially novel approaches through the holistic methodology of mapping the conceptual domain in its entirety.
3. Methodology of concept mapping
One of the most difficult and important steps in planning is the initial conceptualization, which ultimately determines the success of all following steps. Concept mapping can be used whenever a group of people must develop a conceptual framework for evaluation or plan- ning, and the content of the maps is entirely determined by the group.
Each map is a pictorial representation of the group’s thinking, displays their ideas regarding a specific topic, and shows relationships between those ideas and their relative importance, based on the methodology developed by Trochim (1989). The methodology consists of six steps followed in this study:
Step 1: Preparation - This step includes the selection of participants and the definition of a focal point of the conceptualization.
Step 2: Generation of Statements - Statements should be created based on a “prompt” to represent the conceptual domain of the topic of in- terest. This part is very similar to a traditional brainstorming approach,
and as many statements as possible should be created to fully and legitimately represent the entire conceptual domain of the topic.
Step 3: Structuring of Statements - In this step all statements are sorted and ranked by the participants. Unstructured card sorting can be used to sort statements and to put them into clusters. Response scales (Likert) are used to rank the importance of statements.
Step 4: Representation of Statements - Three tasks are necessary to graphically represent the conceptual domain based on the similarity matrix from Step 3. The first task is the creation of a point map, which locates each statement as a separate point on the map, with statements placed closer to each other if they were more frequently sorted into the same pile. To accomplish this, a nonmetric multi-dimensional scaling of the similarity matrix is conducted to create the point map. Multi- dimensional scaling takes a proximity matrix and “scales down” its dimension, most of the time, to a two-dimensional representation to make it easier to interpret the point structure (Trochim, 1989). The second task is a hierarchical cluster analysis that groups points on the point map into clusters. The X–Y coordinate data from the multidi- mensional scaling is used to group points into any number of clusters.
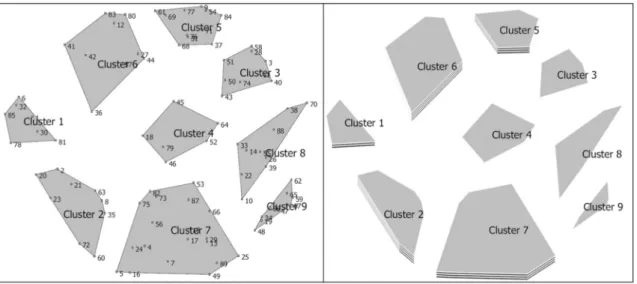
The difficulty in this task lies in the decision on the number of clusters required to give a viable and meaningful solution because, in general, any number of clusters is acceptable. The final task is to overlay the clusters with the average rating from the participants to obtain a Cluster Rating Map that visualizes all the information, which, in turn, gives a full representation of the conceptual domain to be interpreted. Fig. 1 depicts a hypothetical map with 89 statements grouped into 9 clusters and its corresponding Cluster Rating Map. The height of each cluster on the right side of Fig. 1 marks the average rating for all statements grouped into each cluster.
Step 5: Interpretation of Maps - Several maps that provide different views of the same structure can be created in the fifth step, with different clusters to be analyzed by the participants. The goal is to find a mutually acceptable solution, which makes sense to all participants, with the right number of clusters and proper labeling. Then, cluster ratings can be compared among clusters and among groups of participants; “pattern matching” (Trochim, 1985) is the term for comparing cluster ratings between groups of participants.
Step 6: Utilization of Maps – The final step is to use the maps for evaluation or planning purposes. Statements are generated, structured, and rated as inputs from the participants to ultimately create the Cluster Rating Map based on their knowledge and experiences. A two- dimensional point map is created to place each statement on the map based on their relatedness. Statements that are close to each other are grouped into specific clusters and labeled accordingly to define comprehensive groups of problems within the conceptual domain. Each cluster is overlaid with the average importance rating for all points within the cluster to rate each cluster based on the perceived importance of each point by the participants. It is now possible to visualize the conceptual domain of the problem area to be used by the participants for further analysis, planning and decision making, as described in the following sections.
4. Company overview and existing QM-System
The case study was conducted at the production division of the automotive OEM during the first quarter of 2018. The production system consists of five stations with grouped equipment. Small batches of a broad product mix are produced, and parts are transported between stations in specialized containers, as depicted in Fig. 2. The press and laser workstations produce components out of metal discs, which are then assembled at three specialized assembly stations. The aluminum and stainless-steel parts are then cured in a furnace in specialized furnace fixtures to ensure the geometry and form of the final product.
Finally, products are “finished” to ensure proper surface quality of all external car body parts. Quality checks could potentially be done be- tween all steps of the process, but they are costly and time consuming
because the surface, geometry, and stability of the parts are critical to the quality of the final product, and so they must be closely inspected with specialized equipment. The only full-scale quality inspection is done after the curing furnace since the curing process has a significant impact on the geometry due to the heat deformation of the material. The results of the quality inspection are then transferred to the finish department in order to define proper counter measures and potential rework in addition to the standard surface quality improvement activities.
Contrary to holistically planned large-scale production systems, the production system at hand was created out of different low-cost solu- tions to reduce the initial investment cost for extremely low batch sizes.
A typical one or two-week production batch for one of over 25 different products is around 100 to 200 parts for the component production sta- tions (press, laser) and about 50–100 parts for the assembly systems before machines are set up for the next batch. It becomes increasingly difficult to achieve stable processes and create reliable quality infor- mation with smaller batch sizes compared to large-scale production by about a factor of 30, or more. Most of the equipment is highly flexible so
it can produce several different product types. However, there is very little interchangeability between products from one assembly system to the other. Assembly systems usually require extensive ramp-up and quality optimization for dedicated body shop assembly lines, which typically only produce two or three similar product types. For every set- up of each production batch there can be significant variations in pro- cess parameters and parts quality, which, combined with the curing process, results in inconsistent product quality.
The business unit is an internal supplier of the automotive OEM;
finished body shop parts are shipped to various other factories of the OEM in different countries for the final assembly of the car body.
Feedback on the overall fit of parts into the car body is therefore delayed by one or two weeks and every batch could potentially result in different quality complaints from internal customers. Customers then need to define specific rework required in their manufacturing facilities or send the parts back for rework to the business unit, or, in the worst case, scrap them. The business unit works with internal customers to solve specific and recurring quality issues but a general collaboration to improve quality management is difficult due to differences in production Fig. 1. Illustrative example of a hypothetical 9-cluster map and corresponding Cluster Rating Map (Trochim and McLinden, 2017).
Fig. 2. Value stream and known scrap rates of the business unit.
concepts and processes. Integrated long-term quality analyses across all process steps, typical for large-scale systems, often does not bring the desired results due to high variability and the time lag of feedback on quality of the final product. It became increasingly difficult for the business unit to react to varying defects and quality problems, which is why the conceptual domain of the problem area should be mapped first to deal with clusters of critical problems with holistic solutions based on causal analyses. Based on the aforementioned reasons, simply adopting existing quality management tools would not yield the same benefits compared to a tailored system.
The existing quality system was also not adequate to deal with the high quantity of different quality issues since quality linkages and causal relationships were not very well understood. Generally, the automotive industry deploys a wide variety of tools and techniques of quality management (Fonseca and Domingues, 2017); however, it is important to select only the most appropriate and useful methods, especially for small-scale production systems. The business unit uses the OEM’s quality management system, which employs tools of lean management (Shah and Ward, 2007) and Kaizen, or continual process improvement (TAhB Academy, 2016). However, no tool was really implemented with significant results because they were not aimed at specific targets and could not solve the underlying quality issues of the production system.
Production systems in large-scale production are fine-tuned and holis- tically planned machines that operate mostly with already proven pro- cesses and technologies. For example, several expensive statistical process control (SPC) systems are used at specific points in the process known to be critical for process stability and product quality. The same generalized concept would not be possible, or economical, in small-scale production due to high costs and too many influencing factors unknown to large-scale systems.
The innovative aspects of highly flexible low-cost production equipment and solutions result in several unique challenges faced by the studied small-scale production system. Extensive and holistic restruc- turing of the quality management system was necessary to improve the business unit in general, and specific quality issues within the produc- tion system. Large-scale production systems are usually designed to continually improve specific aspects of product and process quality based on detailed analyses and data from SPC, and rarely implement completely new production concepts on a broad level. These differences require a new and better approach to solve the aforementioned issues because the alignment of existing technical and behavioral practices is critical to the success of quality management systems (Asif, 2019).
5. Concept mapping analysis and Cluster Rating Map
Nine experts, divided into two subgroups for the purposes of pattern matching (Trochim, 1985), participated in several brainstorming ses- sions to generate statements regarding the sources of quality problems within the business unit. Participants in this study are members of management and operative experts from several departments (produc- tion, quality assurance, and engineering), who are responsible for the quality performance of the system. With the exception of one expatriate from the headquarters of the company, who is a long-term employee
within the business unit, all participants had an MSc degree in engi- neering. Table 1 shows the participants’ relevant work experience (seniority, in years) and their field of education.
The scope of the analysis was mapping and analyzing quality link- ages between all steps of the process, from metal sheet to finished exterior car body part. All participants were encouraged to contribute as many statements as they could about the sources of quality issues in the manufacturing unit. The prompt to start each statement was the following: “One source of quality problems is: …” and it was completed by the participants based on their experience and opinion regarding the most important quality issues in the production system. After removing duplicates and cleaning up the list, 41 statements were generated, which are summarized in Table 2. The concept mapping study was translated by the authors and verified by English-speaking experts in the manufacturing system to ensure translational validity (Table 3).
The statements were then sorted by the participants, in a different session, to create the similarity matrix. Each participant was given a set of cards with all the statements and they were asked to sort them into any number of piles (greater than one and fewer than 41) that made sense to them. The number, for all participants, showing how many times each statement was grouped together with any other statement was put into the cells of the similarity matrix. Further, they had to rate each statement on a 5-point Likert scale based on its influence on quality problems with ‘1’ meaning that it causes only a few minor problems, and
‘5’ meaning that it causes a considerable number of severe quality problems. The average rating of each statement was calculated to give an overview of the importance of each statement based on the judgment of the experts.
Monotonic two-dimensional scaling was used to create the point map (Kruskal and Wish, 1978). The stress value was 0.138, and it is a rela- tively low value compared to other concept mapping applications, which indicates a good fit (Kane and Trochim, 2007). An R2 of 0.898 further supported the fit of the point map. For clustering, hierarchical cluster analysis using Ward’s algorithm was utilized. Generally, it is difficult or impossible to decide, in advance, on the “best” clustering method and the number of clusters to be chosen. Regarding the choice of the clustering algorithms, we relied on previous empirical studies. Based on a large number of empirical studies, Trochim (1989) found Ward’s algorithm to be the most useful. Ward’s algorithm, minimizing the within-cluster sum of squares to the between-cluster sum of squares at each level of joining, generally gave more sensible and interpretable solutions than other approaches (e.g., single linkage or centroid method). All statistical calculations were carried out in SYSTAT 13.2.01.
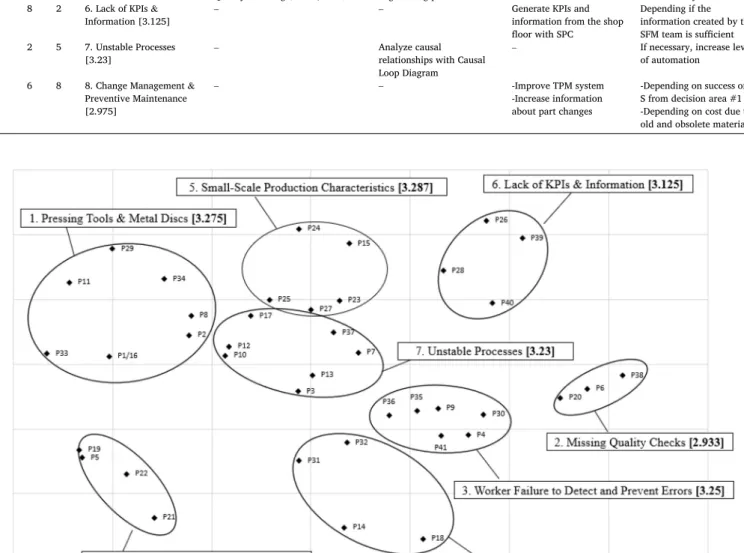
The number of clusters was determined by group consensus. The solution with eight clusters seemed most representative (compared to solutions with four, six, and ten clusters) for the researchers and the experts, with a clear relationship of points within each cluster. Each cluster was then appropriately labeled, and the average ratings were added to complete the Cluster Rating Map, as seen in Fig. 3.
In this paper, the map is used to create a causal loop diagram based on the clusters of the concept map and to ultimately develop an action plan for the selection of future quality improvement projects within a continual improvement process.
Table 1
Participant characteristics.
Group Participant Department Responsibility Seniority Education
Group 1
General Functions Q1 Quality Analysis Engineer for Q-Data Analysis, Product Quality <2 MA Eng.
Q2 Quality Analysis Engineer for Q-Data Analysis, Product Quality 4–6 MA Eng.
PM1 Project Manager Engineer for New Product Integration at all Departments 6–8 MA Eng.
PM1 Project Manager Engineer for New Product Integration at all Departments 4–6 MA Eng.
Group 2
Direct Production A1 Assembly Engineer Assembly Systems 10–15 MA Eng.
A2 Assembly Engineer Assembly Systems 2–4 MA Eng.
P1 Press Engineer Press 10–15 MA Eng.
P2 Press Manager Press 4–6 MA Eng.
F1 Finish Finish Expert >20 No higher Edu.
6. Results
6.1. Results of concept mapping
The concept map combines similar problems into clusters of state- ments (ranked by their perceived importance) and shows connections and importance ratings simultaneously. This visualization method is based on expert knowledge and aims to reduce causal ambiguity in decision-making regarding QM, especially quality improvement. The first cluster contains quality issues regarding the pressing department and raw materials (especially metal discs). It has the second-highest
rating of 3.275 (see Fig. 3) and is a critical factor of quality. This is understandable because it is responsible for all components used in the assembly system and can negatively affect all following steps of the process. A critical aspect of this cluster is to ensure that the raw materials and tools coming into the production system have the right quality and are prepared (cleaned) to function at the highest level.
The second and sixth clusters can potentially be grouped together because both deal with missing information due to a lack of quality checks (cluster two) and a general lack of KPIs and information (cluster 6). They are relatively less important (3.125 and 2.933, respectively) and contain all points associated with the work and capacity of the quality department, including risk assessment, communication with customers regarding product quality and the like. This culminates in a general lack of integrated quality information over the whole value stream and related KPIs.
Another critical cluster (three) deals with failures to detect and prevent quality errors by workers in time, with an average rating of 3.25 for all points in that cluster. Lack of proper training and finish work falls into this cluster along with weak quality controls by the workers and the handling of errors. Its location at the center of clusters two, six, eight and seven means that the points in cluster three were also relatively frequently sorted into the same piles as the points in those other clusters.
One explanation for this could be the failure of workers to follow stan- dardized processes to report quality data properly, which prevents them from analyzing causes and defining measures to prevent quality issues in the first place. The high rating shows the strong links and implications this cluster has on many other issues when it comes to holistic QM.
The fourth cluster deals with logistics and transportation damages but is not very important (3.025) based on the ratings of the experts for all statements in this cluster. The fifth and seventh clusters, however, are highly important for quality within the system. They deal with the general characteristics of small-scale series production and unstable processes with a rating of 3.287 and 3.23, respectively. It is questionable if factors like “low-cost concepts of pressing tools” and a “multitude of assembly technologies” can be improved but they certainly have an in- fluence on quality due to poor equipment and increased complexity. The position of the cluster for unstable processes is understandably at the center of the point map because it influences several other inputs and was generally grouped together with various other statements by the participants. Clusters five and seven could also potentially be consoli- dated into one single cluster due to the many relationships between the statements and the proximity of the clusters on the point map. We decided against it to ensure that very specific solutions could be generated in the following steps and not to over-generalize the results. It was uncertain that potential solutions to specific clusters would be applicable to other clusters as well; therefore, we kept them separated.
The last cluster (eight) contains points regarding change manage- ment and making sure that machines and materials are ready for pro- duction with the correct part numbers and machine settings. This is relatively less important with an average rating of 2.975 with only four statements falling into this cluster. For example, old and obsolete ma- terial entering production because it was not properly tracked throughout the value stream, and FIFO-rules were not kept according to defined standards.
In order to highlight subgroup differences potentially masked by group averages, we also compared the evaluation patterns of two sub- groups. Group 1 included general functions responsible for all processes and Group 2 the direct functions for specific production-related pro- cesses. Group 1 was mostly comprised of less-experienced people working in the office, and Group 2 included highly experienced people, experts in their specific production area, the “old guard”. If the two groups had mostly similar importance ratings across the eight clusters then the results would be visualized as a ladder graph with mostly parallel and horizontal rungs. Disagreements between the groups would be indicated by intersecting rungs. In Fig. 4 below (produced by JMP® Pro 14.3.0) the positioning of clusters with the same or similar ratings is Table 2
Brainstormed statements with average participant ratings in parenthesis Top- three highest-rated statements in bold text.
1 Dirty metal discs (3.60)
2 Pressing tools are not clean enough (3.60) 3 Varying surface qualities after assembly (2.90) 4 Finish work not according to defined standards (2.50) 5 Low-cost concepts for containers (3.40)
6 Quality team too small (not enough capacity) (2.90)
7 Manual handling at press (no robotic linkage between pressing operations) (3.20) 8 High quality variability in press due to press tool construction problems (3.50) 9 Employee errors (missing components, wrong sequence of components inserted into
fixture) (3.20)
10 Bad positioning in pressing tool and fixture (3.30) 11 Poor metal discs and purchased parts (3.10) 12 Unstable processes (4.00)
13 Bad externally sourced products (e.g., external laser cutting) (2.80)
14 Old part numbers (long time in storage and between two production steps, parts become obsolete, FIFO problems) (3.30)
15 Many joining technologies (welding, riveting, press joining, etc.) (2.90) 16 Old and obsolete metal discs end up in production (3.50)
17 Bad fixture settings (e.g., curing fixture) (3.30)
18 Not enough information regarding part changes (missing change management) (3.20)
19 Poor packaging (e.g., wooden pallets for metal discs) (3.00)
20 Missing sample parts or sample parts are not used to check for quality issues (2.80) 21 Containers are in bad condition (missing container TPM) (3.00)
22 Transport damages, bad storage system, too many transports, difficult routes for forklifts (2.70)
23 Many fixture changes and general characteristics of small-scale series production (many products, low quantity, high complexity) (3.00)
24 Dirty fixtures (3.30)
25 Low-cost concepts for pressing tools, only improved prototype tools in series production (3.90)
26 Lack of KPIs for production stability (e.g., OEE, OWE and min/max boundaries) (2.50)
27 Lack of influence/participation of manufacturing during concurrent engineering phase (3.33)
28 Missing risk assessments (3.30)
29 Missing quality measurements regarding metal disc quality (breaking stress test, oiling) (3.00)
30 Weak inspection during production, almost no gauge sampling, not enough visual checks and defective parts are passed on to the next step of the process (4.20)
31 “Forgotten” parts within production (prototypes, optimization parts, etc.) become obsolete and must be scrapped (no control in SAP) (2.60)
32 Missing TPM (2.80)
33 External storage of pressing tools (temperature and weather conditions not optimal) (2.70)
34 Variable raw material quality causes frequent adjustments of machine parameters (“playing around” with parameters) (3.20)
35 Missing part numbers cause confusion (common parts, e.g., screws, bolts can be mixed up) (2.70)
36 No Poka-Yoke to prevent against forgetting to insert components, bad positioning in fixtures and parts can still be processed until the end (3.20)
37 Bad positioning/movement of parts in fixture (3.11)
38 Missing information/communication with customers regarding quality and performance (3.10)
39 Missing information/communication with planning department in concurrent engineering phase regarding quality and performance characteristics during ramp- up (3.30)
40 No integrated quality information over the whole process chain (from metal disc to final assembly (3.40)
41 Employees do not follow specific quality assurance processes (3.70)
“jittered” – a small amount of random variation is added to make all clusters visible. The clusters are listed by their group importance ratings and identical clusters are linked by the “rung” of the ladder.
There are two take-away messages from the graph: (i) the two groups are very different, their importance ratings are not really correlated, and (ii) members of Group 2 – the “old guard” – rate, on average, all
statements higher than members of Group 1. Even the lowest rated cluster in Group 2 (cluster 8) was rated higher than the highest rated cluster of Group 1 (cluster 5). Group 2 perceives the statements to be much more important, perhaps because they deal with the phenomena described in a much more direct fashion on the shop floor; they are much closer to the problems than the members of Group 1.
Table 3
Action Proposal. 5 S – Sort, Set/Straighten, Sweep/Shine, Standardize, Sustain (method of Lean Manufacturing to improve workspace conditions and cleanliness); SFM – Shop Floor Management; SPC – Statistical Process Control; TPM – Total Productive Maintenance; DFM – Design for Manufacturing; FMEA - Failure Mode & Effects Analysis.
Cluster
Rank Decision Area (average cluster rating for all participants)
Immediate Decisions Future Decision Space
ALL G1 G2 Actions Exploration Deferred Choices Contingency Planning
2 3 4 1. Pressing Tools & Metal
Discs [3.275] Improve cleanliness with 5 S Find possibilities for better
pressing tool concepts Improve quality of externally sourced material
–
8 7 6 2. Missing Quality Checks
[2.933] – – Increase quality team to
create more quality information
Depending if the information created by the SFM team is sufficient 3 4 1 3. Worker Failure to Detect
and Prevent Errors [3.25] Generate KPIs and information
from the shop floor with SFM Analyze if inspection processes are functioning or why not
Improve Poka-Yoke directly on the shop floor – 6 4 7 4. Logistics & Transport
Damage [3.025] – – Improve storage system,
container construction and maintenance
Depending on cost due to transport damage 1 1 3 5. Small-Scale Production
Characteristics [3.287] Increase influence in planning and engineering: Advanced Product Quality Planning (FMEA, DFM)
Find better solutions for Poka-Yoke in design and engineering phase
– If necessary, increase
investments into pressing and assembly tools 5 8 2 6. Lack of KPIs &
Information [3.125] – – Generate KPIs and
information from the shop floor with SPC
Depending if the information created by the SFM team is sufficient 4 2 5 7. Unstable Processes
[3.23] – Analyze causal
relationships with Causal Loop Diagram
– If necessary, increase level
of automation 7 6 8 8. Change Management &
Preventive Maintenance [2.975]
– – -Improve TPM system
-Increase information about part changes
-Depending on success of 5 S from decision area #1 -Depending on cost due to old and obsolete material
Fig. 3.Cluster Rating Map with eight clusters and average ratings.
6.2. Using the results of concept mapping for analysis and decision making
The main objective of concept mapping is to visualize the conceptual domain of a problem area in order to make tacit knowledge and the experience of a team of experts available for further planning, analysis, and evaluation. In this section, we offer two examples for using the re- sults of concept mapping to facilitate further analysis and to develop an action proposal for improved decision making.
In the first example, the results of the concept map are used as an input for a causal loop diagram (CLD) to further analyze cause-and- effect relationships within system. A causal loop diagram (see Appen- dix 1 for the full analysis) is an intuitive tool of system dynamics (Maani and Cavana, 2007) to visualize and analyze causal relationships within complex systems. They are also used in group model building (Rodney, 2018), and are, therefore, an excellent complement to concept mapping.
Like Zeng et al. (2017), we found that the result of an analysis based on soft QM has a significant positive impact on “harder” QM when using the concept map as the foundation to create the CLD. Statements in one cluster could be placed close to each other to permit the analysis of causal relationships within the CLD. This also facilitated the creation of the CLD, which would get quite complex at times when a lot of different factors are involved. The pattern of the conceptual domain is kept intact within the CLD to increase the level of understanding when analyzing the diagram. For example, “Unstable Processes” are at the center of the concept map and the CLD, which makes it easier to navigate the CLD if one is already familiar with the concept map.
The results of the analysis can also be used to plan and allocate re- sources to improvement projects with the highest returns in terms of quality performance, as perceived by the management team and team of experts. It can also help to define quality measurement strategies to ensure that the most susceptible steps of the process are secured using the highest rate of measurements. The maps are comprised of the col- lective experience and knowledge of the team of experts to visualize the conceptual domain of the problem area. The most important clusters usually lie at the center of the map, emphasizing the linkages to and influences on the other clusters. In combination with the relative ratings and the CLD, it gives a clear picture of the overall situation within the system, which helps decision makers define better policies and allocate resources towards the most important improvement initiatives.
Visualizing tacit knowledge can significantly increase the common understanding of the whole team regarding a matter of interest; thus, reducing causal ambiguity. An action proposal was developed based on the created information to make the results of the analysis even more
useable for the management team. The methodology was adopted from Friend and Hickling (2005) and it was mentioned in the literature that this approach is always useful to increase the applicability of OM/OR interventions (White, 2016). This method defines immediate decisions and future decision space for all relevant decision areas based on the current level of information and uncertainty related to different options.
Immediate actions should be taken if the current level of information is sufficient to justify these decisions. However, if there is not enough in- formation regarding a decision and there is still time to reduce the risk and uncertainty, resources should be invested into further exploration. A future decision space ensures that other decision areas do not fall off the radar and can still be considered for decisions made in the future.
Considering the high number of deferred choices and factors for con- tingency planning it becomes apparent that extensive analyses based on soft QM and hard QM would be beneficial to support decision makers.
Complex and causally ambiguous production areas can especially benefit from structured approaches and detailed cause-and-effect analyses.
The action proposal was created based on the cluster ratings, the average rating of each point within the clusters, and the findings from the CLD. Immediate actions were defined for the most important clusters and, more specifically, for points within each cluster. This gives an extremely specific set of decisions based on the concept mapping anal- ysis and can be used by the experts for improved resource allocation and QM. Some of the more important statements require further analysis and exploration to create better information on which further decisions should be made. Other, less important, points are not completely dis- missed and forgotten but rather pooled in a future decision space to be re-evaluated in the future. This depends on the future state of the system and the outcome of immediate decisions and explorations. The goal is to continuously manage a relatively complete list of actions based on the tacit knowledge of the team of experts and to allocate resources to the most important points in an efficient and effective way.
Quality problems that arise as a result of small-scale series produc- tion characteristics made up the highest-rated cluster of the concept mapping analysis and were also the most important factor for Group 1.
Group 1 considered the inherent issues of small-scale production as the most important factor in general. Therefore, the company should focus on the implementation of Advanced Product Quality Planning (APQP) to increase the influence of the business unit during planning and engi- neering in order to create a holistic production system. Most drawbacks of small-scale series production could potentially be solved with a greater focus on producibility and error prevention in the engineering phase to increase quality performance. Design for Manufacturing/As- sembly (DFM/DFA) should be considered when planning and designing products specifically for small-scale series production. An important concept also to be considered is Failure Mode and Effects Analysis (FMEA) to analyze potential sources of errors before products are introduced to the business unit. The optimal solution would be to find foolproof (Poka-Yoke) product designs and manufacturing concepts to increase process stability, and to make tasks easier for workers on the shop floor.
The production-centered Group 2 is more focused on people and missing information – both are factors that prevent them from per- forming better on the shop floor. They should focus on utilizing infor- mation from the shop floor in the form of improved shop floor management (SFM). This arrangement will allow them to report day-to- day problems back to the engineering group so they can be considered in the APQP. Shop Floor Management includes all people in the workplace from production-related management- and control processes (Suzaki, 1993). It is another method of lean manufacturing and enables continual improvement based on suitable KPIs directly from the shop floor. With this method, workers can immediately improve their own situation and generate the necessary information before investing heavily into sta- tistical process control (SPC) systems at a later stage when the produc- tion system and quality management become more mature. To further Fig. 4. Cluster importance ratings for the two groups.
increase employee awareness, and improve workspace conditions and cleanliness, the 5 S (Sort, Set/Straighten, Sweep/Shine, Standardize, Sustain) methodology is also recommended to be applied as a general starting point for the improvement of the production system. With only these three specific concepts, which are defined as immediate action in the action proposal, the production system can break the large rein- forcing causal loop (see Appendix 1) to prevent the system from spiraling further down into “production hell”.
7. Theoretical and practical insights
King and Zeithaml (2001) found that intra-firm causal ambiguity (the lack of a common understanding of cause-and-effect relationships between people within the organization) can severely reduce the per- formance of a business. Our study aims to improve quality in the pro- duction system of an automotive OEM efficiently and effectively by reducing this form of causal ambiguity. On the theoretical front, following the suggestions of Diamantopoulos and Winklhofer (2001), we propose a formative model to describe a multidimensional latent construct, i.e., the quality problems of an automotive OEM. In simple terms, causal priority differentiates between a formative and a reflective model: in case of the former, causality flows from the indicator(s) to the latent construct while, in case of the latter, the other way around. We posit that in most organizational settings, manifest (directly measurable) variables are not only preferred to latent constructs but, often, they are the only options. Consequently, manipulating the user-defined measures of our formative model will lead to the improvement of the quality construct.
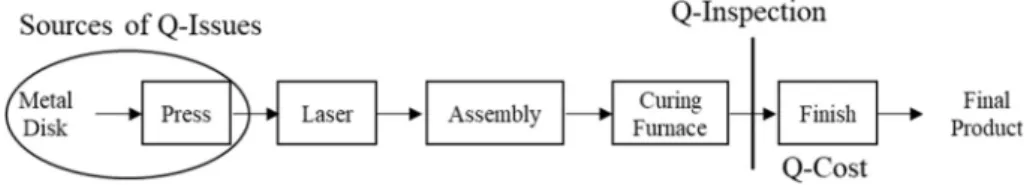
Based on this analysis and the understanding of the team of experts, most quality issues were caused by poor raw materials and tools right at the beginning of the value stream (clusters 1 and 5). This resulted in defective products, which were handed over to the following steps of the process due to a lack of inspection and the inability to detect those defective products (cluster 3). At the business unit, however, the main quality inspection was located right after the curing furnaces and before the finish department (see Fig. 5). Explicit information (coming from the monitoring and analysis of scrap and rework rates) showed that most quality costs arose between the curing furnace and the finish department because most of the defective parts were detected there. Therefore, all resources were allocated towards the end of the value stream while mostly disregarding quality linkages in earlier production stages and the engineering phase. Causal ambiguity and the dynamics of the system further aggravated decision-making and efficient resource allocation.
However, no tool was available to analyze the conceptual domain in its entirety to facilitate knowledge creation and dissemination of tacit knowledge.
This was the first attempt to fully conceptualize the quality domain of the production system with the aim to support decision making regarding quality improvement and measurement efforts. Although the experts had the knowledge, no effort was made to make it available and to use it to improve decision making with the goal of increasing the firm’s performance in terms of reduced quality costs. Knowledge was tacit and dispersed, and not easily accessible without the help of an applicable method that would allow for the visualization of the con- ceptual domain and quality linkages over the whole value stream in order to reduce ambiguity. As mentioned at the beginning of the paper, behavioral QM is needed to facilitate decision making by paying more
attention to measured variables, by assessing the specific impact of factors on process variability and quality, and by enhancing leadership and trust to boost tacit knowledge creation. This increases the meta- cognitive understanding of management to adapt to changing situations and to make innovative decisions based on the information presented by the concept map.
Using the results of the analysis to create action proposals is a key principle of concept mapping (Trochim, 1989) and was mentioned by White (2016) to increase the relevance of OM interventions. Using the concept map as a starting point for causal loop diagrams generates a large quantity of integrated information for decision makers. This aid that enables the detection of causal relationships, as described by the experts of the business unit, can facilitate a continual improvement process because the conceptual domain is analyzed by the problem owners in their native language. It provides a basis for discussion and decision making based on tacit knowledge of the team of experts. It also increases workforce motivation by improving factors that are considered critical by workers on the shop floor and in engineering departments.
Consequently, this kind of analysis has very high internal validity.
Many small-volume batch production systems with high quality re- quirements (like premium sports car manufacturers) face similar prob- lems with causal ambiguity and dynamics. Campbell (1986) suggested a different name for external validity or generalizability: the proximal similarity model. Within the proximal similarity model, researchers can think of contexts which are more or less similar to the one in the study. A gradient of similarity for times, people, settings, and contexts can be developed from the most similar to the least similar, and findings can be transferred to those people, settings, socio-political contexts, and times that are more like those (i.e., most proximally similar to) in the focal study. We believe that our findings can easily be generalized to many of these settings; thus, our analysis and the proposed methodology offer some degree of external validity as well.
The method offers a more holistic approach to learn about the con- ceptual domain of quality issues, compared to, for example, only a causal loop diagram or a fishbone diagram. Fishbone diagrams are aimed at a specific problem based on an analysis of predetermined categories (e.g., machine, material, method, etc.). The clusters gener- ated in this study are relatively similar to those generic categories, however, concept maps can potentially offer more tailored solutions, specific to certain production systems, and can facilitate more innova- tive and creative problem solving. Asif (2019) mentions the benefits of fishbone diagrams, among other tools, to generate basic solutions but acknowledges the much greater potential to provide deeper under- standing if individuals, or teams, provide better inputs and analyses based on improved behavioral practices. Also, causal loop diagrams can benefit from the results of concept mapping as a starting point to create the CLD. As mentioned earlier in the paper: “One of the most difficult and important steps in planning is the initial conceptualization”. Zeng et al. (2017) also found a positive influence of soft QM on hard QM to improve quality information and process management within an orga- nization. In the future, we hope to use a combination of hard- and soft methods to integrate more tools into the decision-making process; for example, by substituting the original categories of a fishbone diagram with clusters from the concept maps to create more tailored tools to solve specific problems for various production systems (concept maps define the domain in which specific problems should be solved). By adding more sources of information from members of the production
Fig. 5. Differences between sources of quality issues and resource allocation.
system, we hope to increase the applicability of such methods and their focus and accuracy to solve specific problems.
Credit author statement
Thomas B. Ladinig: Conceptualization, Formal analysis, Investiga- tion, Resources, Data curation, Writing – original draft, Visualization,
Project administration, Gyula Vastag: Conceptualization, Methodology, Software, Validation, Formal analysis, Writing – review & editing, Visualization, Supervision.
Declaration of competing interest None.
APPENDIX 1: Casual Loop Diagram based on Concept Map
The goal of the causal loop analysis was to get a clearer picture of the
relationships between each cluster and each point within the clusters. No balancing factors and loops are considered in this phase. Almost all 41 statements generated in the concept mapping study were included in the CLD, with only a few redundant ones eliminated for the sake of readability and clarity. Also, cluster titles were included as an anchor point in the diagram. Only “positive” causal relationships and reinforcing loops exist in the diagram since only quality issues are mapped in the concept map. “Positive” relationships mean, in the sense of a pure analysis of quality issues, that factors increase the negative impact of related factors and reinforcing loops cause even more quality problems.
Several root causes have been identified that do not have a direct input from other factors identified by the team of experts. A bad storage system and too many transports were a root-cause of the logistics and transportation cluster, which causes scrap due to transportation damages. The quality team was too small, according to the team of experts, which was one cause of weak inspection during production and, subsequently, missing quality checks and quality information. Poor externally sourced products (metal discs) caused high variability of surface quality and process instability, and in combination with low-cost press tool construction, this affected the press department. The lack of TPM was another cause of problems, specifically dirty and badly set up fixtures in the assembly systems and the pressing tools as well.
The CLD identifies three main outcomes based on the quality issues defined by the team of experts. Logistics and transportation damage was one of the main factors of quality problems and of increased quality costs due to inadequate work in progress- and finished goods containers, albeit not the most critical one. Another end-result with no direct outwards-facing connection to other factors in the CLD was the scrapping of old part numbers and
“forgotten” parts within production that eventually became obsolete. This resulted in additional quality costs due to a poor storage system with too many transports and missing information on changing and obsolete components parts as a result of a lack of communication between engineering and planning departments. The third, and most important, outcome of the CLD was process instability due to varying surface quality that came from the press and laser departments on one hand, and the varying geometry of parts due to badly adjusted fixtures in the assembly department on the other hand. “Unstable processes” was also the second highest-rated statement generated in the concept mapping analysis, and supposedly caused the highest number of problems and quality costs.
Analyzing the causal relationships and reinforcing loops within the CLD, one can identify several loops on the top-right side of the diagram. Several smaller loops reinforce a larger one, which spans across most of the top-weighted clusters, increasing the number of issues due to small-scale pro- duction factors and problems resulting from workers on the shop floor. Additionally, missing quality checks and a lack of KPIs are factors in this loop.
This can be explained by the fact that there are many manual processes but no aid for workers to ensure that they perform their work correctly (missing Poka-Yoke). There is also a lack of information for workers regarding KPIs and critical quality issues they should inspect based on defined quality assurance processes. This results in weak inspection during production and a high probability of errors that go undetected. Cluster 3 (worker failure) received the highest score of all clusters for the front-line employees of group two (see Fig. 4) because they miss critical inputs and methods to perform their work correctly. Several loops reinforce these effects when considering missing quality checks and, as a result, lack of information and KPIs, in the first place. Important information from the shop floor is also missing during planning and engineering, and for the creation of an integrated quality information system to better track KPIs and generate information efficiently. Nothing was done to prevent detrimental small-scale series production characteristics, which caused workers to fail due to a lack of aid while performing more complex manual processes compared to large-scale production systems. This can be confirmed by the authors after analyzing process standards of the assembly systems, which show an approximately seven times longer cycle time (time to produce a unit of output) compared to large-scale systems (see Appendix 2). Furthermore, they show a three to five times higher number of individual tasks for a single worker in each cycle. This causal loop ultimately results in high process instability because workers cannot cope with the increased requirements of small-scale production due to complex processes and a lack of support.
APPENDIX 2: Analysis of cycle time and worker tasks
Cycle times of conventional large-scale systems lie between 60 and 120 s. Names of operations, parts and production technologies were removed.
Translated from the original process standards by the authors.
References
Anand, G., Ward, P.T., Tatikonda, M.V., 2010. Role of explicit and tacit knowledge in Six Sigma projects: an empirical examination of differential project success. J. Oper.
Manag. 28, 303–315.
Asif, M., 2019. Lean Six Sigma Institutionalization and Knowledge Creation: towards Developing Theory. Total Quality Management & Business Excellence.
Bartunek, J.M., Murninghan, J.K., 1984. The nominal group technique: expanding the basis procedure and underlying assumptions. Group Organ. Stud. 9 (3), 417–432.
Campbell, D.T., 1986. Relabeling internal and external validity for the applied social sciences. In: Trochim, W. (Ed.), Advances in Quasi-Experimental Design and Analysis. Jossey-Bass, San Francisco, pp. 67–77.
Cho, Y.S., Jung, J.Y., Linderman, K., 2017. The QM evolution: behavioral quality management as a firm’s strategic resource. Int. J. Prod. Econ. 191, 233–249.
Cho, Y.S., Linderman, K., 2019. Metacognition-based process improvement practices. Int.
J. Prod. Econ. 211, 132–144.
Choo, A.S., Linderman, K.W., Schroeder, R.G., 2007. Method and context perspectives on learning and knowledge creation in quality management. J. Oper. Manag. 25, 918–931.
Dahlgaard, J.J., Reyes, L., Chen, C.-K., Dahlgaard-Park, S.M., 2019. Evolution and future of total quality management: management control and organisational learning, 30.
Total Quality Management & Business Excellence, pp. S1–S16. Suppl. 1.
Diamantopoulos, A., Winklhofer, H.M., 2001. Index construction with formative indicators: an alternative to scale development. J. Market. Res. XXXVIII (May), 269–277.