UNIVERSITY OF WEST HUNGARY FACULTY OF ECONOMICS
SZÉCHENYI ISTVÁN
THEORY AND PRACTICE OF ECONOMIC PROCESSES DOCTORAL SCHOOL
INEQUALITIES, TENDERED DEVELOPMENT FUNDS AND RELATIONSHIP NETWORKS,
IN THE SOPRON-FERT D SUBREGION
Summary of Doctoral (Ph.D.) theses
Written by:
Egyed Krisztián
Supervisors:
Sopron 2009.
Dr. Kiss Edit Éva DSc - Dr. Horváth Csaba PhD
Doctoral School: Széchenyi István Theory and Practice of Economic Processes
Head of the doctoral school: Prof. Dr. Székely Csaba Course:
Head of the course:
Supervisor:
……….……….
Supporting signature of the supervisor
UNIVERSITY OF WEST HUNGARY FACULTY OF ECONOMICS
SZÉCHENYI ISTVÁN
THEORY AND PRACTICE OF ECONOMIC PROCESSES DOCTORAL SCHOOL
INEQUALITIES, TENDERED DEVELOPMENT FUNDS AND RELATIONSHIP NETWORKS,
IN THE SOPRON-FERT D SUBREGION
Summary of Doctoral (Ph.D.) theses
Written by:
Egyed Krisztián
Supervisors:
Dr. Kiss Edit Éva – Dr. Horváth Csaba
Sopron 2009.
1. Antecedents and aims of my research
Territorial inequalities arise from the different features: in each settlement or area, the resources – geographical, environmental, historical, cultural, social, or economic – appear in different quantities and qualities. Throughout the historical timeline, the economic usefulness and value of these resources varied a lot. This fact, and also the changes, influenced by the territorial inequalities developed all-time regional structure. These territorial inequalities were previously studied in Hungary from various aspects – income relations, employment, infrastructure, public and social services, geographical and environmental factors etc. – at national, regional, county level (and even some at LAU 1 level). These researches showed unquestionably, that the territorial inequalities reached a very high rate in Hungary and this state seems to be permanent. In order to aid changes, regional development was given major role at compensating harmful processes. By now, we have the first reports that analyze the influence of territorial policy and the usage of development funds. In order to have a better and more accurate view over territorial changes and regional development, there is a need for further researches at LAU 1 levels and even at the level of settlements. We also have to re- evaluate the instruments of regional development regularly.
I found that the processes (equalization and differentiation) inside the Sopron-Fert d subregion (HU22105) could serve as an ideal case study of territorial development. The examined territory is one of the most developed areas in Hungary, but there can be found underdeveloped settlements also, which are unable to gain sufficient funds for development.
The reason for this situation is partly coming from statistics; the aggregation of data on higher levels takes away the inequalities at smaller levels. Further reasons are the low fund accepting capability of underdeveloped settlements and the lack of relationship networks, which could help by distributing values.
The aim of my own research was to demonstrate the evolution of territorial inequalities and also to show, how they are in connection with the distribution of development funds. I examined the inequalities between the settlements of the subregion and I also paid attention to their trends. I explored the inequalities within the distribution of development funds and also the relationship networks between the settlements.
I started up from the following three hypotheses:
1. The uneven distribution of tendered funds and their strong concentration results, that they do not have a significant effect on equalization. The settlements on the periphery are quite
inactive by applying for tendered funds and their effectiveness at tenders is also very low.
This results in that, the development funds do not reach (or not in the needed amount) the most indigent settlements. The allocation of funds does not serve the development of the peripherals.
2. The development of individual settlements and – through this – the equal development of the whole territory is in connection with the state of advancement on the field of relationship systems between the settlements. The extensiveness of relationship networks however does not define the state of (under)development of the settlements, but by ensuring some additional funds, it is able to have a favorable effect on them. Unfortunately, the main supply chains – through which the effects of development funds could reach the less developed settlements and the peripheries – are incomplete. The development of the center of the subregion does not have a significant effect on the development of the whole territory either.
3. Tendered funds may play significant role in the development of a settlement, but they have only minor effect on changing inequalities. Neither fund accepting capabilities, nor the fund distributing mechanisms serve the elimination of territorial inequalities.
Before fulfilling my research, I made an overview about the changes in territorial inequalities since the change of the political system in Hungary. I put an emphasis on the scientific researches concerning the topic, which try to explain the changes and their causes. I expanded the exploration of publications to the areas of territorial funding tenders in connection with the development policy of the European Union and Hungary. I concentrated on the tenders, which might have an effect on eliminating territorial disparity
The novelty of my research comes from the following: 1) studying the development inequalities between the lower territorial levels (e.g.: LAU 1) instead of the huge ones; 2) the usage of long term timelines (1992-2006); 3) using indicators in a complex system instead of individually; 4) and describing the relationship networks of the settlements.
.
2. The subject, method and justification of my research
Concerning the before mentioned aspects, I examined how the following two factors determine changes in differences between the settlements: 1) distribution of development funds; 2) existing relationship networks between the settlements. My methods were the following.
I tried to justify my hypotheses by measuring the processes leading to inequalities in the Sopron-Fert d subregion. I tested my innovation of methods by analyzing the data of the settlements in the subregion.
My research consists of the following four main parts:
1. Examination of the development indicators of the settlements.
I examined data indicating inequalities in development between the 39 settlements, which build up the Sopron-Fert d subregion. Because of the complexity of the concept, I used a complex system of indicators in order to determine the state of development. After examining many different methods, I decided to use the system of indicators introduced by the 24/2001.
Parliamentary Decision. The main reasons of my decision were the easy accessibility and the clarity of the data. The system is complex but also simple, which supports the usability of the findings. The source of the data was the Hungarian central statistical agency (“KSH”) database. I calculated the level of inequality for all the 19 indicators (economy, infrastructure, employment and social dimensions) between the years of 1992-2006. In order to determine the values of inequality and concentration, I used the following statistical calculations:
average, minimum, maximum, range of data, range of deviation, relative range, “Éltet Frigyes dual indicator”, ratio of the outer deciles, ratio of the middle deciles, deviation, relative deviation and the Herfindahl-index. Based on the initial development and its growth under the examined time period, I described the indicators visually on maps also. Based on the calculations, the settlements were sorted into five different groups.
2. Examination of the differences between the amounts of granted funds.
I collected the data about all the funds, which were granted between the years of 1992-2006 in the Sopron-Fert d subregion. The examined funds included the following: Hungarian national territorial development funds, tenders from the European Union (including structural-, and pre-accession funds) and funds from the first National Development Plan. Data was collected from the databases of the above mentioned organizations. I analyzed the distribution of funds
between the settlements – regardless of the economic sector of the winners. I used the same statistical methods during the analysis of the funds as in the case of development indicators, and I also illustrated the results on maps.
3. Charting the cross-settlement relationship networks
The areas of this research were the following: road connections, cooperation between the local governments, connections between the enterprises, movement and migration of the residents and their consumer customs. I used the flexible questionnaire method in order to collect the data. The database of the survey was built up from the system of public transport networks, the answers of all the local governments, and 180 enterprises from the subregion (2,54%), together with the questionnaires of 949 residents (1,16%). The base of the inequality calculations was the gross number of connections between the settlements (referred as
“degree”). Above the before mentioned inequality indicators, I also calculated the density value and the Freeman-indicator – used in relationship network analysis. I illustrated the connections by using the NetDraw software.
4. Analysis of the coherence between the databases
The main aim of this research was to reveal the coherence between the development status of the settlements and their inequality indicators. In order to calculate this, I used the gradient values of the trend curves, created from the series of data between the years 1992-2006. This method allowed me to filter the distortion effect of extreme data. After this step, I used a correlation analysis to determine how the results are in connection with each other. The data- pairs of the correlation analysis were the following:
- correlation between the state of development in 1992 and the advancement during the examined time period;
- correlation between the development data of Sopron, the whole Sopron-Fert d subregion, and the provincial parts of the subregion;
- correlation between the state of development in 1992 and the ranking of the amounts of gained funds;
- correlation between the development (within the 1992-2006 time period) and the gained tendered funds of the settlements;
- correlation between the development (within the 1992-2006 time period) and the relationship capital.
3. The results of the analysis
By summing up the territorial inequalities at each different measured area, I was trying to find out, what caused the differences in development (and in the initial status also). The rank- correlation between the state of development in 1992 and the advancement during the examined time period gives us information about whether the differences changed in a positive or negative way. As a result of my calculations, it can be said, that the gross rate inequalities slightly changed during the examined time period in the Sopron-Fert d subregion.
On the other hand, there were some moves up and down in the rankings of the settlements.
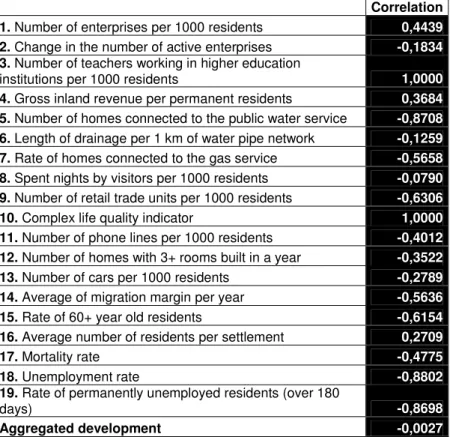
Table 1: Correlation between the state of development and the advancement during the examined time period
Correlation 1. Number of enterprises per 1000 residents 0,4439 2. Change in the number of active enterprises -0,1834 3. Number of teachers working in higher education
institutions per 1000 residents 1,0000
4. Gross inland revenue per permanent residents 0,3684 5. Number of homes connected to the public water service -0,8708 6. Length of drainage per 1 km of water pipe network -0,1259 7. Rate of homes connected to the gas service -0,5658 8. Spent nights by visitors per 1000 residents -0,0790 9. Number of retail trade units per 1000 residents -0,6306
10. Complex life quality indicator 1,0000
11. Number of phone lines per 1000 residents -0,4012 12. Number of homes with 3+ rooms built in a year -0,3522 13. Number of cars per 1000 residents -0,2789 14. Average of migration margin per year -0,5636
15. Rate of 60+ year old residents -0,6154
16. Average number of residents per settlement 0,2709
17. Mortality rate -0,4775
18. Unemployment rate -0,8802
19. Rate of permanently unemployed residents (over 180
days) -0,8698
Aggregated development -0,0027
Source: own calculations based on TeIR database
By the majority of the indicators, which I was able to evaluate (the “Number of teachers working in higher education institutions per 1000 residents” and the “Complex life quality indicator” were unable to be interpreted correctly), there were solid favorable results. This assumption is based on that the negative – and in some cases; strongly negative – correlation means that the underdeveloped settlements made better progress, than the average. The positive changes are extremely strong on the areas of infrastructure, demographic changes, and unemployment. There were positive processes behind the pubic services and various life quality indicators. However the changes in the “Mortality rate” and the “Rate of 60+ year old
residents”, together with the convergence of unemployment rates were caused by the demographic erosion of the smaller settlements. This process can be witnessed also in the growing inequality of the number of residents throughout the settlements, which partly follows, and partly causes the strong differentiation in economic activity and residential incomes. It is also interesting, that the current roles, potentials, and the concentration of population do not allow Sopron to determine the development of the rest of the subregion.
Table 2: Correlation between the development data of Sopron, the whole Sopron-Fert d subregion, and the provincial parts of the subregion – separately indicated
Sopron – Sopron-Fert d
subregion
Provincial average – Sopron-Fert d
subregion Sopron –
Provincial average 1. Number of enterprises per 1000
residents 0,9998 0,9992 0,9980
2. Change in the number of active
enterprises 1,0000 0,9996 0,9993
3. Number of teachers working in higher education institutions per 1000 residents 4. Gross inland revenue per permanent
residents 0,9998 0,9994 0,9985
5. Number of homes connected to the
public water service 0,9199 0,9671 0,7900
6. Length of drainage per 1 km of water
pipe network 0,3645 0,9937 0,2589
7. Rate of homes connected to the gas
service 0,9636 0,9980 0,9456
8. Spent nights by visitors per 1000
residents 0,8209 0,7480 0,2351
9. Number of retail trade units per 1000
residents 0,9699 0,5629 0,3458
10. Complex life quality indicator 11. Number of phone lines per 1000
residents 0,9971 0,9908 0,9776
12. Number of homes with 3+ rooms built
in a year 0,9371 0,0112 -0,2057
13. Number of cars per 1000 residents 0,9988 0,9986 0,9947
14. Average of migration margin per year 0,9400 0,3956 0,0586
15. Rate of 60+ year old residents 0,9917 -0,6125 -0,7087
16. Average number of residents per
settlement 0,9675 0,0748 -0,1798
17. Mortality rate 0,7391 0,7508 0,1102
18. Unemployment rate 0,9245 0,9574 0,7752
19. Rate of permanently unemployed
residents (over 180 days) 0,9641 0,9800 0,8921
Source: own calculations based on TeIR database
The development of the subregion is more-or less equal in the relation of Sopron versus the provincial areas. In 11 cases of the indicators, the development of Sopron has stronger influence on the rest of the subregion, than the average. The rest of the Sopron-Fert d subregion has only five indicators, in which it plays the major role in the development of the whole subregion. The “Number of retail trade units per 1000 residents” indicator showed a
strong fluctuation during the examined years, but after year 2000, there was a heavy concentration (retail trade units concentrated on the settlements with higher purchasing power). The same can be said about the demographic indicators also. The settlements, which were the centers of the economy developed better than the average on the field of average population, and inbound migration. Parallel to these changes, these settlements showed a progress at the age structure of their population also. The indicator, which describes the quality of homes (Number of homes with 3+ rooms built in a year) fluctuated so heavily, that there can not be seen any real development. The investments into the provincial area helped to improve the state of the infrastructure and had a positive effect on unemployment also.
Table 3: Correlation between the state of development in 1992 and the amount of gained funds (from Hungary, from the EU, and the total amount of funds – separately indicated)
Hungarian EU Total 1. Number of enterprises per 1000 residents 0,1051 0,3494 0,2949 2. Change in the number of active enterprises -0,3224 -0,2084 -0,3619 3. Number of teachers working in higher education institutions per 1000
residents 0,0577 0,1306 0,0721
4. Gross inland revenue per permanent residents 0,0265 0,1321 0,0636 5. Number of homes connected to the public water service 0,0690 0,1987 0,2198 6. Length of drainage per 1 km of water pipe network 0,1297 0,0619 0,0860 7. Rate of homes connected to the gas service 0,0956 0,1045 0,1068 8. Spent nights by visitors per 1000 residents 0,1891 -0,0267 0,2110 9. Number of retail trade units per 1000 residents 0,1587 -0,2104 -0,0528
10. Complex life quality indicator -0,1913 0,3305 0,1340
11. Number of phone lines per 1000 residents 0,2016 0,2188 0,3255 12. Number of homes with 3+ rooms built in a year 0,1172 -0,0673 0,0028
13. Number of cars per 1000 residents 0,1368 0,1489 0,1451
14. Average of migration margin per year -0,1431 0,1260 -0,0769
15. Rate of 60+ year old residents -0,0520 0,1190 -0,0405
16. Average number of residents per settlement -0,1927 0,1279 -0,1233
17. Mortality rate -0,0077 0,0563 -0,0130
18. Unemployment rate 0,0150 0,3025 0,0804
19. Rate of permanently unemployed residents (over 180 days) -0,0551 0,2729 0,0972
Total 0,0171 0,2430 0,1129
Source: own calculations based on TeIR database
The state of the development (in 1992) and its changes (between 1992 and 2006) correlate with each other. The cause of this improvement however is not the amount of distributed funds. My calculations showed that the tendered funds did not aim the underdeveloped regions. Neither of the indicators shows connection between the amount of received funds and the state of development. It is also true, that the tenders did not aim to favor underdeveloped settlements or to bring the settlements onto the same level.
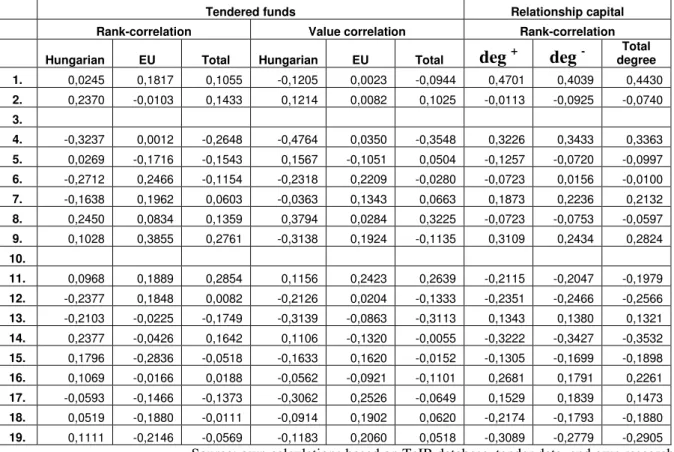
Table 4: Correlation between the development (within the 1992-2006 time period) and the gained tendered funds of the settlements (left side) and correlation between the development (within the 1992-2006 time period) and the relationship capital
Tendered funds Relationship capital
Rank-correlation Value correlation Rank-correlation
Hungarian EU Total Hungarian EU Total deg + deg - degree Total 1. 0,0245 0,1817 0,1055 -0,1205 0,0023 -0,0944 0,4701 0,4039 0,4430 2. 0,2370 -0,0103 0,1433 0,1214 0,0082 0,1025 -0,0113 -0,0925 -0,0740 3.
4. -0,3237 0,0012 -0,2648 -0,4764 0,0350 -0,3548 0,3226 0,3433 0,3363 5. 0,0269 -0,1716 -0,1543 0,1567 -0,1051 0,0504 -0,1257 -0,0720 -0,0997 6. -0,2712 0,2466 -0,1154 -0,2318 0,2209 -0,0280 -0,0723 0,0156 -0,0100 7. -0,1638 0,1962 0,0603 -0,0363 0,1343 0,0663 0,1873 0,2236 0,2132 8. 0,2450 0,0834 0,1359 0,3794 0,0284 0,3225 -0,0723 -0,0753 -0,0597 9. 0,1028 0,3855 0,2761 -0,3138 0,1924 -0,1135 0,3109 0,2434 0,2824 10.
11. 0,0968 0,1889 0,2854 0,1156 0,2423 0,2639 -0,2115 -0,2047 -0,1979 12. -0,2377 0,1848 0,0082 -0,2126 0,0204 -0,1333 -0,2351 -0,2466 -0,2566 13. -0,2103 -0,0225 -0,1749 -0,3139 -0,0863 -0,3113 0,1343 0,1380 0,1321 14. 0,2377 -0,0426 0,1642 0,1106 -0,1320 -0,0055 -0,3222 -0,3427 -0,3532 15. 0,1796 -0,2836 -0,0518 -0,1633 0,1620 -0,0152 -0,1305 -0,1699 -0,1898 16. 0,1069 -0,0166 0,0188 -0,0562 -0,0921 -0,1101 0,2681 0,1791 0,2261 17. -0,0593 -0,1466 -0,1373 -0,3062 0,2526 -0,0649 0,1529 0,1839 0,1473 18. 0,0519 -0,1880 -0,0111 -0,0914 0,1902 0,0620 -0,2174 -0,1793 -0,1880 19. 0,1111 -0,2146 -0,0569 -0,1183 0,2060 0,0518 -0,3089 -0,2779 -0,2905 Source: own calculations based on TeIR database, tender data, and own research
There is also no correlation between the development (within the 1992-2006 time period) and the gained tendered funds of the settlements. Neither the Hungarian, nor the EU funds helped to bring the underdeveloped settlements up to the level of the leaders. On the other hand, there was a very slight – but more significant, than the funds – correlation between the development rankings (within the 1992-2006 time period) and the relationship capital. The connection is the strongest with the indicators of economic development; there is a moderate correlation between the degree of the relationship networks and the economic activity (change in the
“Number of enterprises per 1000 residents”), together with the residential income status (“Gross inland revenue per permanent residents”).
3.1. Scientific novelties of my research
Through my research, I have been looking for the answer to the following questions by studying the Sopron-Fert d subregion: 1) the tendered funds arriving to the subregion do not have significant effect on territorial equalization; 2) there is a lack of relationship capital, which results in an uneven development throughout the subregion; 3) the distribution of tendered funds does not support the mitigation of territorial inequality.
The novelties of my research are the new viewpoints and methods, which the regional science did not apply previously.
3.1.1. New research methods used in my dissertation
The novelty of my research comes from the following: 1) studying the development inequalities between the lower territorial levels instead of the huge ones; 2) the usage of long term timelines (1992-2006); 3) using indicators in a complex system instead of individually;
4) and describing the relationship networks of the settlements.
1. Regional development is widely studied and analyzed by various researchers. Most of the essays from this area concern the inequalities beneath the larger territorial divisions and do not go down to the smaller levels. The problem of the smaller levels – which are considered as homogeneous by the current region development jargon – is that they are not standardized indeed, and there are actually huge differences between the development levels of the individual settlements. By creating a new research method, I was able to show the inequalities, and analyze their changes in the lower territorial levels.
2. By measuring the territorial inequalities, researchers emphasize only on or a few indicators. Development is usually simply identified as economic development (e.g.: wages, unemployment). Other factors (e.g.: infrastructure, mixture of enterprises, quality of human resources) only serve as interpreting factors. The various social and economical indicators show different scale of inequality, and also different directions in their changes. This is why we can only describe the state of inequalities (and the changes) between the settlements by using a complex system of indicators. Because of its complexity, I decided to use the system of 19 indicators introduced by the 24/2001. (IV. 20.) Parliamentary Decision, which observes the development from the many above mentioned needed viewpoints (economy, infrastructure, social and employment status etc.).
3. The main method used by researchers, studying time scale data is the regression analysis. By these calculations, the rate of inequality is indicated by the value of the “beta”
parameter. During static analyses – made with data available from a solo year – researchers
use more inequality indicators. The most frequently used indicators are the “Éltet Frigyes dual indicator”, the “Attkins indicator”, various poverty indicators and the “Robin Hood index”. It can be observed, that analyzing the same database with different methods leads to different results, so I decided, to use more methods to test their validity.
4. Essays on territorial inequalities use many indexes during the measurement of a single year’s data and mainly regression analysis by the analysis of continuous years. By comparing different areas, the dynamic relatedness analysis is also used. In my research, I am trying to combine all the advantages of the different methods and also avoid their disadvantages at the same time. At the static calculations, I determined the value of many different inequality indicators, so they partly specified, partly explained each other. Besides the measurement of the inequalities between the settlements in a given year, I also aimed to measure their changes throughout the 1992-2006 time period (I used the gradient values of the trend curves, created from the series of data between the years 1992-2006). This method allowed me to filter the distortion effect of extreme data.
5. During the analysis of inequalities, I used the economic activity, the presence of foreign capital, the rate of employment, the distance from the centers of the subregion and from the western border, the level of education, the family structure, and the indicators of residential life quality as interpreting variables. I analyzed the status and change of the economy, infrastructure, and employment inequalities. In order to explain the changes, I tried to find connections between the results and the funding or the relationship networks. The development mainly relies on the tendered funds because the financial status of the local governments and the economic actors is not so good. I analyzed, how the number of successful tenders, and the amount of the awarded money (and its “per capita” value) is in connection with the development of the subregion. Among the interpreting variables, I also analyzed the extendedness of relationship networks on various fields.
3.1.2. New elements of my findings
The area of the research, the used methods, the analyzed indicators, or the novelties in their relations result, that there is no previous research, that I may be able to quote in order to compare the results with my own. As a result of my findings – in line with my hypotheses – I define the following observations (which mainly stand for the Sopron-Fert d subregion):
1. The development funds do not serve the elimination of territorial inequalities, and
Only a small part of the tenders aimed at the abolition of territorial inequalities, but at the same time, the base of our own national territorial policy is the balanced development. At the levels of regions or counties, there were many surveys, that pointed out, that there is only stagnation (or minor approach) between the inequalities. Through my dissertation, I was able to verify the same at the subregion level. The indicators, which build up the complex development indicator of the subregion show only slight changes over the years. Major changes are solely among the limited infrastructure-, and demographic indicators and they can only be found in the first years. The development projects of the underdeveloped settlements and the demographic trends are in the background of this effect.
2. The development funds do not reach (or not in the needed amount) the most indigent settlements; the peripheries.
In previous researches, there were only examples of the centrum-periphery analysis at national level. Based on the results, there were two main tendencies: the ranking of the underdeveloped regions changed slightly, and their relative distance from the developed regions decreased also slightly. The cause of this process is the stagnation of the developed territories, and the change of the resource distribution plays only a minor role. The developed regions are more active at the tenders. I also came to the same conclusion on the subregion level. The concentration-, and inequality indicators beneath tendered funds show a high value.
On the other hand, there is no connection between the changes and the initial rankings. It can be observed, that the underdeveloped settlements are not in a favored position. The ability of fund raising is determined by the economic activity, the development of the enterprises, the amount of the own funds, and the abilities and activity of the local managers. This means, that the current distribution of tendered funds does not serve the development of the peripheries.
3. A The development of the center of smaller territorial levels does not have a significant effect on the development of the whole territory.
Static analyses – and subjective own feelings – indicate, that the dominant settlements cause heavy distortion among the development indicators of the analyzed territory. The Williamson- hypothesis predicts that the more developed settlements have more developed peripheries also. On the other hand, development should decrease inequalities, which assumes, that there is a stronger development at the periphery. During my continuous calculations over the 1992- 2006 time period, I validated the latter at the subregion level also.
In the case of both the solo indicators, and the complex development indicator, the provincial settlements have almost the same wage, as the centers. However by the majority of the indicators, the values of the centers correlate more to the subregional average, than the values of the provincial settlements, but this dominance is not obvious and clear. Together with the values of the inequality indicators, the value of their deviation also means serious differences between the areas (besides the presence of a strong middle level).
4. The development of individual settlements and – through this – the equal development of the whole territory is in connection with the state of advancement on the field of relationship systems between the settlements.
The trust and the social capital is the base of cooperation. As a result of various social and management studies, the connections play a significant role by developing effectiveness and by transferring values. This is the result of the synergies of the cooperation and the connected system of value chains. The results of my research strengthen the validity of this theory at the changes in inequalities and development at subregional levels. The extensiveness of these relationship networks does not solely define the development status of a settlement, but it can help by the acquisition of additional funds. The currently active cooperation influences mainly the changes of economic indicators.
5. The main supply chains – through which the effects of development funds could reach the less developed settlements and the peripheries – are incomplete.
Polarization and growth pole theories are based on the working supply chains. The development status of a central settlement can influence the periphery through these networks.
The situation is the same in Hungary by the networking, and “Pólus” programmes.
Unfortunately, the relations are extremely deficient. Cooperation is mainly built up between actors of same caliber. I also have to mention, that the “fake-cooperation” is also very popular among the settlements in favor of receiving more funds. Cooperation readiness is very low on a national level in Hungary – and it is also true on subregional level. The density of relationship networks is very low (it is extremely low by the real value-transmitting connections). On the other hand, the intensity of relationships over the borders of the subregion is high among the more developed settlements (which mainly comes from the value chains of the enterprises). This means, that the development funds have positive effect on the subregion centers and through their relationship network, they also have positive effect on
settlements are scant, and the developed settlements try to build connections – through the value chains of their enterprises – to the settlements with same characteristics in other subregions.
4. Conclusions and proposals
After analyzing the status of inequalities in the Sopron-Fert d subregion during the time period of 1992-2006, I came to the following conclusions:
1. The smaller territorial levels are not homogeneous; there are serious inequalities between the development levels of the individual settlements. The various social and economical indicators show different scale of inequality, and also different directions in their changes. This is why we can only describe the state of inequalities (and the changes) between the settlements by using a complex system of indicators.
2. The development funds played a huger role in the expansion of the settlements in the subregion, but there were only minor changes in internal inequalities between them. There is a need to support the development of the underdeveloped settlements in order to decrease the differences. The methods that may serve this goal are the following:
- a part of the tenders should serve the territorial equalization;
- some tenders should prioritize the projects of less developed areas or the projects of developed areas, that have an effect on the disadvantaged settlements through real partnership.
3. There is a need to build up internal networks – even without additional funding – beneath the subregions in order to maintain a balanced development, and keep the values and earnings on the spot. There should be more added value and synergy by eliminating the redundant parallel capacities.
4. The cohesive and growth aims can be reached together if the area centers are being developed together with their relationship networks. This means, that the effects on the centers reach the peripheries also. Unfortunately the structural differences are sometimes historically embedded, so above the economical and infrastructural support, there is a need for mental support also, in order to “modernize” the local society.
Widening my research could serve with useful findings by pointing out the main areas where further development is needed the most, and forecast their potential results:
- digging deeper into the “intra-settlement” level could help to understand the connections between the economic actors in the subregion;
- by comparing many LAU 1 area analyses, it is possible to create a typified system of region development status, which could help in the process of bringing the subregions to the same development level;
- measuring autocorrelation at the LAU 1 level could help by creating development project groups among the settlements;
- based on the analysis of cognitive areas, it would be possible to create “mental areas”. The borders of the mental areas could be compared to the official LAU 1 area borders and to the main areas (centers) of relationship networks. Pointing out the differences between the three systems could help by determining the areas to be further developed.
5. Register of publications attached to the topic
Egyed Krisztián (2005): Regional competitiveness – welfare of the residents. PhD Hallgatók V. Nemzetközi Konferenciája, Miskolc, 2005. augusztus 14-20. Konferencia kiadvány, 311- 316. o.
ISBN 963 661 676 0
Egyed Krisztián (2005): Competitiveness of settlements as residential areas. In: Marketing Füzetek V., 4-11. o.
ISSN 1785 7996
Egyed Krisztián (2005): A települések, mint lakóhelyek versenyképessége. Évkönyv 2004- 2005. III. kötet. Környezetvédelem, regionális versenyképesség, fenntartható fejl dés c.
konferencia el adásai Pécs, 2005. május 19-21., 130-135. o.
ISSN 1588 5348
Egyed Krisztián (2005): Az EU LEADER programja hazánkban és az Ikva-mentén.
Tudomány Napja, Sopron, 2005. november 9-10.
Egyed Krisztián (2005): Integrált térségfejlesztés – versenyképesség. „Átalakulási folyamatok Közép-Európában”, Gy r, 2005. december 2-3.
Egyed Krisztián (2005): „Alternatív területhasznosítással a fenntartható fejl désért”. Ikva- Menti HVM Helyi Vidékfejlesztési Stratégiája, Fert szentmiklós
Egyed Krisztián (2006): Az Ikva-menti települések kvantitatív versenyképessége. I. KHEOPS Tudományos Konferencia, Mór, 2006. május 31., Konferencia CD-kiadvány
ISBN 963 2298 497
Egyed Krisztián (2006): Mentális térképek az Ikva mentén. „Globális problémák tegnaptól holnapig”. VI. magyar Jöv kutatási Konferencia, Gy r, 2006. október 6-7. Konferencia kiadvány, 202-208. o.
ISBN 963 86670 6 0
Egyed Krisztián (2006): Közlekedés-földrajzi kapcsolatok szerepe a települések együttm ködésében. Fiatal Regionalisták V. Országos Konferenciája, Gy r, 2006. november 10-11.
Egyed Krisztián (2007): Vállalkozások kapcsolati hálója a Sopron-Fert di Kistérségben. II.
KHEOPS Tudományos Konferencia, Mór, 2007. május 30., Konferencia CD-kiadvány ISBN 978 963 87553 0 8
Egyed Krisztián (2007): Homogén térség fejlesztése vs. forrásorientált együttm ködés. IV.
HUNNET Konferencia, Budapest, 2007. június 22.
Egyed Krisztián (2007): Területi különbségek, azok lehetséges okai és következményei a Sopron-Fert di kistérségben. „Három éve az ötven éves Európai Unióban”, Budapesti Corvinus Egyetem, 2007. november 27. – december 1.
Egyed Krisztián (2008): Területi különbségek, azok lehetséges okai és következményei a Sopron-Fert di kistérségben. Társadalom és Gazdaság, 1. sz., 89-113. o.
Egyed Krisztián (2009): A kistérségek kialakulása, kialakítása hazánkban. NUTS 4, újabban LAU 1 szint az Európai Unióban. Területi Statisztika, 1. sz., 19-39. o.
ISSN 0018 7828