1
Published: German Journal of Agricultural Economics, Vol. 67. No. 3. 2018. pp. 147 – 159.
http://www.gjae-online.de/inhaltsverzeichnisse/pages/protected/show.prl?params=recent=1&type=2&id=934&currPage=&type=2
Economic crisis and the fragility of comparative advantage in European agriculture
Štefan Bojnec
University of Primorska, Koper, Slovenia Imre Fertő
Institute of Economics, Hungarian Academy of Sciences, Budapest, and Kaposvár University, Kaposvár, Hungary
Abstract
The paper investigates the impact of the economic crisis on the duration of comparative advantage of agri-food products in European Union member states during the period 2000–2014 using normalised revealed comparative advantage indices. Specifically, we examine how the economic crisis affected comparative advantage indices at 1) the start of a period of comparative advantage, 2) during a period of comparative advantage, and 3) how quickly comparative advantage grew within a defined period. Duration and regression analyses are applied to examine the fragility of comparative advantage using alternative model specifications and estimation procedures. Estimations suggest that the comparative advantage for most agri-food products is short lived. Economic crisis reduces the duration and growth of comparative advantage, while spell duration, lag in comparative advantage and product differentiation reduce the probability of failure of duration of comparative advantage. Economic crisis and the duration of after-crisis reduce, and after-crisis and crisis-duration increase the growth of comparative advantage. These results are relevant for EU agri-food exporting countries, as the fragility of comparative advantage is found to be driven by both endogenous factors and the exogenous macro-economic-related shock of economic crisis. Exit from economic crisis and product differentiation have strengthened the comparative advantage of EU-28 member states in terms of differentiated agri-food product varieties for final consumption.
Key Words
economic crisis; normalised revealed comparative advantage; European agriculture
2
1 Introduction
During the last few decades a body of theoretical and empirical literature has been developed arguing on the role that agricultural and macro-economic policy can play on the agri-food sector and its trade (SHANE and LIEFERT,2000; JOSLING et al., 2010). The impact of macro-economic variables on agriculture and agri-food trade has been modelled and simulated particularly in a general equilibrium perspective (ADELMAN and ROBINSON, 1986), including for the affects of the financial crisis on agriculture (DIAO and ROE,2000). While the impact of the financial crisis on agriculture has been investigated (PETRICK and KLOSS,2013), there is a gap in literature on the impact of the economic crisis on the fragility of comparative advantage in agri-food products (CRESCIMANNO et al., 2014; PETERSON et al., 2017). This paper aims to fill this gap in literature by applied the duration of multiple expressed measures of comparative advantage.
Research from the last two decades has highlighted the fact that many countries do not trade every year, nor with all products (HAVEMAN and HUMMELS, 2004; FEENSTRA and ROSE, 2000; SCHOTT, 2004) and has inspired the new literature about the duration of international trade that has emerged. Recent studies provide evidence that trade relationships are surprisingly short lived (e.g. BESEDEŠ and PRUSA, 2006b; NITSCH, 2009; FERTŐ and SOÓS, 2009; BRENTON et al., 2010; OBASHI, 2010; HESS and PERSSON, 2011, 2012). HESS and PERSSON (2011) provide an overview on theoretical explanation and empirical results of trade duration, while BESEDEŠ et al.
(2016) developed own theory on short trade duration. PETERSON et al. (2017) argue on nonexistence of single theory on short lived trade and agri-food export duration to be explained by trade theories based on heterogeneous firms. The observed high rate of exit in the first years of exporting might be explained by firms testing an export market by entering and then exiting after learning about profit (NGUYEN, 2012) due to uncertainties in costs pertained to the existence of fixed entry costs on export markets (MELITZ, 2003) or after exit fixed reentry costs (HESS and PERSSON, 2011) or demand conditions that cannot be resolved until after entry (BESEDEŠ and PRUSA, 2011; NGUYEN, 2012).
Another stream of literature that investigated firm-level data confirmed the very short duration of exports for a wide range of countries (JAUD and KUKENOVA, 2011; BÉKÉS and MURAKÖZY, 2012; GÖRG et al., 2012; CADOT et al., 2013). However, studies usually focus only
3
on manufacturing, or all products, with only some exceptions (e.g. BOJNEC and FERTŐ, 2008;
2012a, 2012b; GULLSTRAND and PERSSON, 2015). The latter studies also confirm the claim that exporter characteristics (such as gross domestic product (GDP) and language), product characteristics (such as unit values), and market characteristics (such as import value and market share) affect the duration of trade. Short-lived export relationships have serious implications for comparative advantage.
Another motivating factor behind this research is the fact that recent studies have confirmed that the duration of comparative advantage in agri-food trade is also of short duration (e.g. BOJNEC and FERTŐ, 2015, 2016, 2017c). Increasing amounts of effort has been put into investigating the duration of comparative advantage and its drivers in European agriculture (BOJNEC and FERTŐ, 2016, 2017a).
The evolution of trade patterns often reflects deep structural changes in the whole economies of countries. Such patterns usually emerge over long periods, and comparative advantages may not change in the short run. However, external and internal shocks may influence production and the diffusion of new technology and institutional systems. It is reasonable to assume that an economic crisis represents an exogenous shock if powerful changes in the economy impact the evolution of agricultural trade patterns (SHANE and LIEFERT, 2000;
DIAO and ROE, 2000; SHANE et al., 2009; PETRICK and KLOSS, 2013). There is an increasing research on the collapse of international trade during the 2008–2009 global recession. BEMS et al.
(2013) identify three channels influencing the trade pattern during the crisis. First, compositional effects associated with changes in final expenditure explain most of the magnitude and sectoral pattern of the trade collapse. Second, shocks to credit supply—affecting both firms’ ability to secure working capital and trade finance—played an important secondary role. Third, inventory adjustments were an amplification mechanism that led imports to decline more than proportionally with respect to final sales. Interestingly, they find that trade policy played virtually no role in explaining changes in aggregate trade.
However, the literature about the impact of economic crisis on agricultural comparative advantage is basically non-existent. One exception is CRESCIMANNO et al. (2014) who offer a short review on the impact of economic crisis on the competitiveness of agri-food trade. Short lived comparative advantage in agri-food trade during the economic crisis can be even further deteriorated, because economic crisis increases the uncertainty in trade relationships, specifically
4
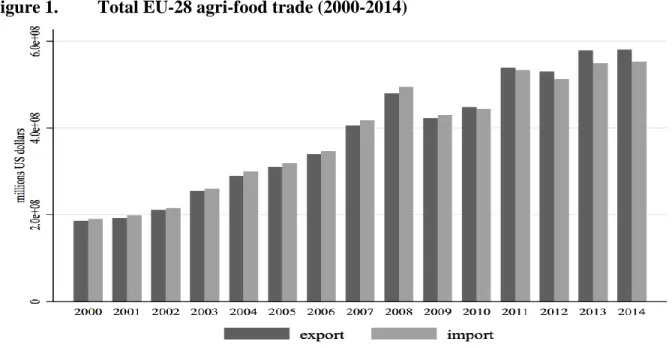
increasing risks on demand side which can be a structural effect influencing the comparative advantage. Figure 1 shows that the agri-food trade of the European Union (EU-28) member states decreased during the first years of the recent economic crisis.
Figure 1 here
Therefore, this paper contributes to the recent literature about agri-food comparative advantage in several ways. First, it includes a systematic analysis of the effects of the crisis on European agri-food trade focusing on the comparative advantage index for the comparison among products, countries and over time. Second, while earlier studies focused only the duration of comparative advantage index, the novelty of this paper are used multiple comparative advantage measures. In addition to the duration of comparative advantage index, we analyse two other components of it; namely growth, and the starting value of comparative advantage index.
More specifically, we first focus on the impacts of the economic crisis on the growth of comparative advantage index at the highly disaggregated agri-food trade-data level. Second, we analyse the impacts of the crisis on the initial status of comparative advantage index. Finally, we discuss the meaning and importance of the results, derive the policy implication from the results and opportunities and directions for future researchers.
2 Related Hypotheses from Duration-of-Trade-related Literature
Economic theory about the economic crisis and the fragility of comparative advantage in agri- food trade is underdeveloped. CRESCIMANNO et al. (2014) investigated the role of the economic crisis on the competitiveness of the agri-food sector in a sample of Mediterranean countries.
However, no study has so far investigated the association between the economic crisis and the duration of comparative advantage for agri-food trade. In the absence of a strong theoretical basis for hypotheses development, we have adopted theoretical models and empirical findings to test the hypotheses of the trade duration-related literature. Previous empirical works confirm two main findings (BESEDEŠ and PRUSA 2006b;NITSCH 2009;andBESEDEŠ et al. 2014). First, the probability of a trade relationship ceasing is decreasing in its size and age (or duration).
Second,the growth rate of trade is decreasing in size conditional on duration and decreasing in duration conditional on size. , Based on these results we test hypotheses (H) 1 and 2:
H1: The probability of the cessation of comparative advantage decreases with the size and age of the comparative advantage.
5
H2: The growth rate of a comparative advantage decreases in size with duration, and in duration with size.
H3 and H4 are derived from earlier literature that investigated whether different varieties of product and higher value-added product varieties of exports (such as niche markets, speciality products, and processing high value products for final consumption) raise the value of products and profit margins (e.g. OLPER and RAIMONDI, 2008; CHEPTEA et al., 2014; BOJNEC and FERTŐ, 2009, 2017b). When modelling the export duration of final products within a sector, the assumption of product homogeneity is quite often unrealistic due to factors such as innovation and technological development, the differentiated market structure of product varieties, and their considerable heterogeneity (e.g. HELPMAN and KRUGMAN, 1985; LORD, 1989; VOLPE- MARTINCUS and CARBALLO, 2008). With agri-food products, we assume that more product heterogeneity exists in the value chain (due to the degree of product processing) than with primary agricultural products. Heterogeneity of vertical stages in the agri-food value chain is related to the processing of primary agricultural products, either for further processing or final human consumption. The duration of export is predicted to be longer for differentiated products than homogeneous ones (RAUCH and WATSON, 2003; BESEDEŠ and PRUSA, 2006a, 2006b;
TOVAR and MARTÍNEZ, 2011). On the basis of this understanding, we define the following hypotheses:
H3: Duration of comparative advantage is longer for differentiated agri-food products than homogeneous ones.
H4: Growth in comparative advantage is stronger for differentiated agri-food products than homogeneous ones.
Finally, we focus on the impacts of the economic crisis. Figure 1 shows that the crisis has negatively influenced the agri-food trade performance of the EU-28. We predict that the economic crisis during the period 2009-2011 had a negative impact on the duration of comparative advantage (BOJNEC and FERTŐ, 2017c). Thus, we hypothesise that:
H5: The probability of the cessation of comparative advantage increases with economic crisis.
3 Methodology and Data
6
The most widely used indicator in empirical trade analysis, which can be calculated from observed trade data, is based on the concept of the revealed comparative advantage (RCA) index, which was developed by BALASSA (1965). This index in comparative studies can be limited (DEARDORFF, 1994; YU et al., 2009). Different variants and other indices have been developed to deal with the problem of double counting and asymmetric value of RCA index. VOLLRATH’s (1991) proposed relative trade advantage index (RTA), which is the difference of logarithmic form of revealed export advantage and revealed import advantage, respectively to solves asymmetric problem. However, when the export of certain commodity is zero, RTA index is not defined. LAFAY (1992) included gross domestic product in the RTA index in order to investigate the effect of macroeconomic issues on competitiveness, but it is difficult to compare this index across time, because the distribution of this index has invariant mean over time (SANIDAS and SHIN, 2010). DALUM et al. (1998) offered to use symmetrical RCA (SRCA) index which is the approximation of log-transformation of RCA index, but it does not explore stable mean over time and space, and the interpretation of SRCA can change for more disaggregated data (DE
BENEDICTIS and TAMBERI, 2001). PROUDMAN and REDDING (1998) developed weighted RCA (WRCA) index which is obtained by the normalizing the numerator of the RCA index. However, WRCA index has asymmetric problem, because it does not present changes in national exports relative world trade and it is affected by the level of sectoral aggregation (DE BENEDICTIS and TAMBERI, 2001). Despite critiques of the RCA index as a static export specialisation index, such as the asymmetric value problem and the problem with logarithmic transformation (DE
BENEDICTIS and TAMBERI, 2004), sensitivity to the level of aggregation (HOEN and OOSTERHAVEN, 2006), the importance of the simultaneous consideration of the import side (VOLLRATH, 1991), and the lack of a sound theoretical background (LEROMAIN and OREFICE, 2013), it remains a popular tool for analyzing export competitiveness in empirical trade literature. However, RCA index and its variants do not allow to compares the competitiveness over space and time. Therefore, while the original RCA index can be used as a dichotomous indicator of whether a country has a comparative advantage in a given product at a given point in time, the above-described limitations imply that it cannot be used for comparative purposes to assess the relative degree of the competitiveness of a country over time or space with another country, or for multiple products within the same country.
7
YU et al. (2009, 2010) developed an alternative measure for assessing the dynamics of comparative advantage of the particular product, which can help to compare international competitiveness across countries and time. The authors used the normalized RCA (NRCA) index to improve certain aspects of the original RCA index for static patterns of comparative advantage to create an appropriate export specialisation index for making comparisons in space, and changes in comparative advantage and its trends over time. YU et al. (2009) define the NRCA index as follows:
𝑁𝑅𝐶𝐴𝑖𝑗 = 𝐸𝐸𝑖𝑗−𝐸𝐸𝑖𝐸𝐸𝑗, (1) where E denotes total world trade, Eij describes country i’s actual export of commodity j in the world market, Ei is country i’s export of all commodities, and Ej denotes export of commodity j by all countries. If NRCA>0, a country’s agri-food comparative advantage on the world market is confirmed.
The NRCA index has some properties that make it preferable to Balassa’s RCA measure for our purposes. First, the distribution of NRCA values is symmetrical, ranging from −1/4 to +1/4 with 0 being the comparative-advantage-neutral point. Second, the sum and mean values of the NRCA scores for a given product or country are both stable and equal to zero. This property allows comparisons across products or sectors, countries, and time (YU et al., 2009). Third, the NRCA index is also additive, so its value does not depend on the degree of aggregation. The NRCA index is neither affected by reference group of countries nor by commodity aggregation (SANIDAS and SHIN, 2010). The NRCA index is normalized by world’s total exports. Because the NRCA index values are very small, YU et al. (2009) suggest multiplying the NRCA index values by 10,000, which will not affect the interpretations of the results.
The RCA and NRCA indices are identical from binary demarcation perspective to identify the comparative advantage of the country in export of particular commodity (YU et al., 2009).
The reason to employ NRCA index in our analysis is due to its symmetrical characteristics for comparisons across products, countries and over time in our time-series duration and panel regression data analyses. To calculate NRCA indices, we used export data from the United Nations (UN) International Trade Statistics UN COMTRADE DATABASE (UNSD 2017);
specifically, the six-digit harmonised commodity description and coding systems (HS6-1996). As defined by the World Customs Organisation, the annual sample of agri-food trade contains 789
8
product groups at the HS six-digit level. The value of trade is expressed in US dollars. Our sample included data for each EU-28 country over the period 2000-2014.
We examined the duration of the NRCA index. Calculation of duration appears to be straightforward: it is simply the time (measured in years) that a product has maintained a comparative advantage (NRCA>0) index without any interruption. Alternatively, applying statistical techniques from survival analysis, the duration can be modelled as a sequence of conditional probabilities that a product’s NRCA>0 index will continue after t periods, given that it has already survived for t periods. Specifically, let T be a random variable that denotes the length of a spell - the uninterrupted length of time of the NRCA>0 index. A spell is a way of distinguishing a period continuing with an index of NRCA>0 from the total number of years in the analysis (continuing or not) with NRCA>0 index. In discrete time, the survival function, S(T), may then be defined as:
S(T)=Pr(T≥t) (2).
Duration analysis of NRCA>0 was estimated by using the survival function S(t), using the nonparametric Kaplan-Meier product limit estimator (CLEVES et al., 2004). The Kaplan-Meier estimator of the hazard function is the fraction of spells that fail after t periods of all spells that have survived t periods. The survival function is thus the share of spells that survive at time t, but this time is cumulative of all preceding time intervals. Specifically, if all spells survive and the ratio is one, the survival function will be flat at this interval; otherwise, the function will decline stepwise. Formally, the Kaplan-Meier estimator of the survival function is:
j j j t i
t n
d t n
S
()
) ˆ(
, (3)
where nj denotes the number of subjects at risk of failing at t(j), and dj denotes the number of observed failures. Given that many observations are censored, it should be noted that the Kaplan-Meier estimator is robust to censoring and uses information from both censored and non- censored observations1. It is possible that, in some cases, NRCA>0 will be dissolved (NRCA<0) and later re-established (NRCA>0) during the sample period. Episodes of uninterrupted NRCA>0 are the primary unit of analysis.
To test H1 and H3 we estimated the following model:
1 Observations are called censored when information about their survival time is incomplete. In our case, we have only censored observations, including both left- and right-censored observations.
9
NRCADikt=α0+α1Durationikt+ α2NRCAikt-1+ α3Pdifferentationi+ εikt (4) where NRCAD is Duration of NRCA>0 in years, i denotes country, k is product, and t is time.
Duration is the age of spell k in year t, NRCAikt-1 is the lag of NRCA, or NRCA in the previous period, and εikt is the error term. The NRCAikt-1 represents the size of NRCA in the previous period as past-dependency that the higher the NRCAikt-1, the longer is the duration of NRCA and thus the lower is expected its failure in the current period. Regarding product differentiation (Pdifferentation) we followed Rauch (1999) in classifying commodities into three categories: homogeneous, reference priced, and differentiated. Rauch classified products traded on an organized exchange as homogeneous goods. Products not sold on exchanges but whose benchmark prices exist are classified as reference priced; all other products the author deems differentiated. So, Pdifferentiation is a dummy variable which takes the value of one if a product is differentiated based on Rauch’s classification; otherwise, it is zero. To check the robustness of results we employed both a conservative and liberal classification of product differentiation.2
Recent literature about the determinants of trade and comparative advantage duration uses Cox proportional hazards models (e.g. BESEDEŠ and PRUSA, 2006a, 2006b; BOJNEC and FERTŐ, 2012b; CADOT et al., 2013). However, HESS and PERSSON (2011, 2012) point out three relevant problems inherent in the Cox model that reduce the efficiency of estimators. First, the use of continuous-time models (such as the Cox model) may result in biased coefficients when the database refers to discrete time intervals (years, in our case), especially in samples with a high number of ties (numerous short-spell lengths). Second, Cox models do not control for unobserved heterogeneity (or frailty). Thus, results might not only be biased, but also spurious.
The third issue of concern is based on the assumption made in proportional hazards models that effects are similar throughout the duration spell. Following HESS and PERSSON (2011), we estimated discrete-time models using complementary logit specifications, where product- exporter country-random effects are incorporated to control for unobservable heterogeneity among the group of commodities and countries.
To test H2 and H4 we estimated the following ordinary least squares (OLS) regressions:
NRCAgrowthikt=α0+α1Duration+ α2NRCAikt-1+α3Pdifferentation +λi+δt+εikt (5).
2 A conservative classification minimizes the number of three- and four-digit commodities that are classified as either organized exchange or reference priced, while the liberal classification maximizes those numbers (Rauch, 1999). In the present case, it is matched from six-digit level to three- and four-digit level.
10
NRCAgrowthikt=(NRCAikt–NRCAikt-1/NRCAikt-1)*100 describes the growth of NRCA between two consecutive periods; the other explanatory variables are the same as in Equation (4). We included country- (λi) and time- (δt) specific fixed effects to control for possible heterogeneity.
We were interested in the effect the economic crisis had on three attributes of spells of comparative advantage: the value of NRCA in the first year, the growth of NRCA when the spell is active, and the conditional probability it will cease to be active, or the hazard rate. To properly identify the effects of economic crisis, we differentiated between spells which were active when the crisis began, and spells which began after the crisis. To appropriately capture all the effects of economic crisis we used four variables: Crisis, Crisis-duration, After-crisis and After-crisis- duration. The variable ‘Crisis’ identifies the years during which the crisis is in force, thus identifying the differential effect of the crisis itself. Since our concern was whether relationships or spells which started after the economic crisis are different from those already active, we employed a variable that reflected how long the economic crisis had been in effect when a spell started (Crisis-duration).
To test H5, we examined the effect on initial values of NRCA within an active spell by estimating the following OLS regressions with country-fixed effects:
NRCA(1)ikt=α0+α1Crisist+α2Crisis-durationikt +α3Pdifferentationi+λi εikt (6) where NRCA(1)ikt denotes NRCA values in initial period.
To analyse the full effects of the economic crisis on the duration and growth of NRCA, in addition to Crisis and Crisis-duration variables we specified equation (4) with two additional variables: First, ‘After-crisis’, which identifies all spells which started after the crisis came into force; and second, ‘After-crisis-duration’, which measures how long the crisis has been in place, but only for after-crisis spells.
4 Results
4.1 Changes in comparative advantage
The distribution of the NRCA indices by EU-28 member states before and after the economic crisis looks similar: Germany has the lowest negative value, and the Netherlands the highest positive value (Figure 2). Between these two extremes are some smaller changes in comparative advantage with other EU-28 member states.
11 Figure 2 here
4.2 Duration of comparative advantage
The duration of the NRCA>0 indices was investigated using two steps: first, a description of the periods of time (or ‘spells’) of NRCA>0, and second, the duration of NRCA>0 index in years.
The former indicates whether NRCA>0 was a continuous process during the analyzed periods, and whether there was a single spell that represented a continuous period with the NRCA>0 index, or whether there were multiple spells with switches from NRCA>0 to NRCA<0 over the years analysed. The latter indicates for how many years NRCA>0 at the HS-6 agri-food product level, ranging from 1-15 years.
The histogram on the left-hand side in Figure 3 illustrates the number of spells with NRCA>0, focusing on the difference between single spells and multiple spells per given agri- food product. First, the high share of a single spell with continuous NRCA>0 indicates that most of the EU-28 member states had a high percentage of HS-6 agri-food products that survived a certain number of years in the period 2000–2014. During the analyzed 15-year period, the minimum length of a spell was one year, and the maximum length of a spell for a given EU-28 agri-food product with continuous NRCA>0 was 15 years. Second, among the multiple spells with NRCA>0 per given agri-food product, two and three spells, and to a lesser extent, four and five spells for a given agri-food product were identified. The histogram on the right-hand side in Figure 3 illustrates the distribution of the duration density of the number of agri-food products with NRCA>0 over the fifteen years of analysis, and indicates slightly more concentration on the left-hand side, indicating fewer years of continuous NRCA>0 than on the right-hand side of the same histogram (showing more years of continual NRCA>0). Around 18 percent of the HS-6 agri-food products had a perfect unbroken survival rate of NRCA>0 during the fifteen years of analysis.
Figure 3 here
Table 1 provides summary statistics about the length of NRCA>0 for EU-28 member states. Calculations show that the median duration of a spell with NRCA>0 in our sample was three years. The mean duration of NRCA>0 was also close to three years (3.33). These results remain rather stable when the definition of a single spell was changed; i.e., observations in which a specific exporter-product group combination has only one single coherent period of NRCA>0,
12
which does not have significant effects on the median and mean durations. The mean and median of length of NRCA>0 remain almost the same at 3 and 3.26, respectively.
Table 1 here
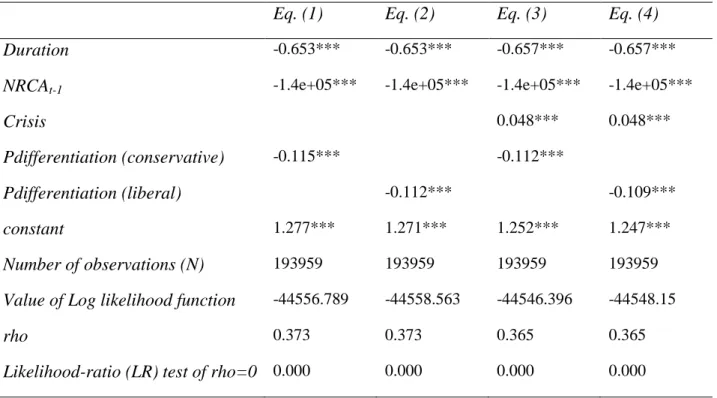
In the next step we investigated the impact of the economic crisis on the duration of NRCA>0 using random-effects complementary log-log models. rho describes the panel-level variance component ranging between 0.365 and 0.373. The likelihood-ratio (LR) test shows that rho is significantly different from zero for each specification, indicating that panel estimators are superior to pooled estimators. H1 states that the probability of the cessation of comparative advantage decreases with the size and age of the comparative advantage. Results are in line with this prediction, as coefficients of Duration and NRCAt-1 variables are significantly negative in all specifications (Table 2). Pdifferentiation variables have negative and significant regression coefficients in all models, suggesting that the likelihood of failure in the NRCA>0 indices was less for differentiated products, thereby confirming H3. Because the majority of economic crisis variables perfectly predicted failures, we present the results of our models with the Crisis variable. In line with our expectations, estimations suggest that Crisis positively influenced the failure of comparative advantage (NRCA>1).
Table 2 here
H3 was also tested by examining nonparametric Kaplan-Meier estimates of survival function over the 15-year period. Figure 4 clearly illustrates that the Kaplan-Meier survival rates for the NRCA>0 indices steadily declined over the 15-year period. In addition, graphical inspection of the survival function does not confirm that the duration of comparative advantage is longer for differentiated products regardless of classification system.
Figure 4 here
4.3 Growth in comparative advantage
H2 states that the growth rate of comparative advantage declines with its size and age. Negative regression coefficients for the Duration and NRCAt-1 variables indicate that longer and larger spells of advantage undergo less growth (Table 3). This finding is consistent with H2.
Pdifferentiation does not have significant impact on the growth of NRCA. Thus, H4 can be rejected.
Now we turn to impacts of the economic crisis on the growth rate of NRCA. Without accounting for how long the crisis has been occurring, the effect on active spells is a decrease of
13
10 percentage points in the growth rate, while the effect on spells which start after the crisis is an increase of 17 percentage points. Accounting for how long the crisis has been in place partly changes the two static effects: the effects of crisis remain almost the same. The effect of the crisis on pre-crisis spells is captured by the temporal effect which indicates that for every year that the crisis is in effect, the growth rate increases only by 0.6 percentage points. Post-crisis spells have a higher growth rate of 38 percentage points. This positive effect of the economic crisis on the growth of post-crisis spells is compounded by a negative temporal effect of 9 percentage points per year.
Table 3 here
4.4 Initial values for comparative advantage
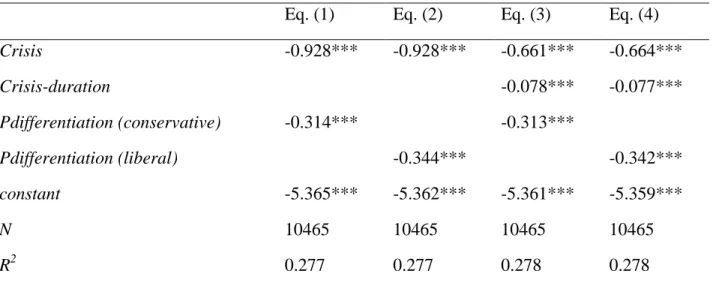
Our analysis pertains to the effect of the economic crisis on the initial value of NRCA. Since we examined a single value at the starting point of each spell, our ability to identify the different effects of economic crisis was reduced (a spell either started before or after the crisis). As a result, the effect of the crisis only applied to spells which started after the crisis. As equation (6) implies, two variables identify the effects of crisis: a dummy variable identifying the years when the crisis begins (Crisis) and a variable reflecting how long the crisis has been in effect when a spell starts (Crisis-duration). Using only the dummy variable to identify when the crisis was in effect, we find that initial volumes of NRCA decrease with the crisis by 0.93 log points (Table 4).
We then incorporate the variable measuring how long the crisis was in effect when the spell started. Results imply that the effect of the crisis decreased the initial volumes of NRCA by 0.66 log points, and had a time-dependent effect which decreased the initial volumes of NRCA by 0.08 log points for every year of the crisis. Thus, H5 cannot be rejected. Pdifferentiation decreases initial values of NRCA by around 0.31-0.34 log points.
Table 4 here
5 Conclusions
The study contributes to the theory and empirical analysis of the duration analysis of the NRCA index for the EU-28 member states’ agri-food exports on global markets. Theory which attempts to explain the impact of the economic crisis on the duration of comparative advantage (NRCA>0) is at an early stage of development. Accordingly, this research provides novel empirical results and findings. Duration and regression analyses were applied to test the
14
hypotheses designed to assess the duration and growth of NRCA>0 indices. Empirical results confirmed that the economic crisis was important in the evolution of NRCA>0 indices over time.
NRCA>0 indices for most agri-food products survived for a number of years; a particularly high percentage were of shorter duration, surviving only a single year or a lesser number of years. The average duration of NRCA>0 was slightly more than 3 years.
One special contribution of this paper is the examination of the determinants of duration and growth of NRCA on global markets on a long-term basis. Duration, NRCAt-1 and product differentiation statistically significantly reduce the probability of NRCA>0 duration failure, while economic Crisis increases deterioration or loss of duration of comparative advantage (NRCA>0 index) for the EU-28 member states’ agri-food exports on global markets in the long term.
The study confirmed the significant association between the growth of comparative advantage and economic crisis variables. Growth of comparative advantage is statistically significantly negatively associated with duration, NRCAt-1, economic crisis, and after-crisis- duration, but significantly positively associated with after-crisis and crisis-duration variables.
Product differentiation does not have significant impact on growth of comparative advantage.
One striking finding is the confirmation of a significant negative association between the initial value of comparative advantage and the economic crisis variable, as well as economic crisis duration and product differentiation. For the latter variable, the results are consistent and robust for both conservative and liberally defined product differentiation of agri-food product varieties for final consumption.
Results confirm Hypotheses 1, 2, 3 and 5: the probability of the cessation of comparative advantage decreases with its size and age (H1); the growth rate of comparative advantage decreases in size depending on duration, and decreases in duration conditional on size (H2); the duration of NRCA>0 is longer for differentiated agri-food products than homogeneous ones (H3); and the probability of NRCA>0 cessation decreases after economic crises (H5). However, growth of NRCA>0 is not stronger for differentiated agri-food products than homogeneous ones, thus H4 is rejected. While economic crisis can be considered an exogenous impact on a defined product group, differentiation of a country’s agri-food export structure (supporting the presence of different varieties of the same agri-food product within one sector in higher value-added
15
varieties for final consumption) is a challenge for business and policy, although it may promote the comparative advantage of EU-28 agri-food on global markets.
While this study investigated the impact of specific endogenous factors and the exogenous macro-economic shock of the economic crisis on the duration of NRCA>0 indices, among the limitations of this study are the fact that omitted from the driving factors are exporter characteristics (such as GDP, language, and some other proximity variables), product characteristics (such as unit values) and market characteristics (such as import value and market share). This is an issue for further research. Future research can investigate the additional drivers of the duration of NRCA>0 indices in different spatial market segments, institutional arrangements, and policy changes with impacts on global agri-food exports and comparative advantage. Finally, further research can integrate additional drivers into model specifications such as micro (farm, food processing and marketing firms) characteristics, sector-specific endogenous factors in the agri-food value chain, and exogenous factors such as changes in consumer preferences for certain production methods and the impact of climate change mitigation as these may affect the duration of NRCA>0 indices, with implications for the agri- food sector.
Acknowledgments
We express our grateful thanks to the two anonymous journal reviewers for the useful suggestion to improve the paper. Imre Fertő acknowledges financial support from the project NKFI-115788
‘Economic Crises and International Agricultural Trade’.
References
ADELMAN,I. and S.ROBINSON (1986): U.S. agriculture in a General Equilibrium Framework: Analysis with a Social Accounting Matrix. In: American Journal of Agricultural Economics 68 (5): 1196–1207.
BALASSA, B. (1965): Trade liberalization and revealed comparative advantage. In: The Manchester School of Economic and Social Studies 33 (2): 99–123.
BÉKÉS, G. and B. MURAKÖZY (2012): Temporary trade and heterogeneous firms. In: Journal of International Economics 87 (2): 232–246.
BEMS, R., R. C. JOHNSON, and K.-M. YI (2013): The Great Trade Collapse. In: Annual Review of Economics, 5, 375-400.
BESEDEŠ, T. (2008): A search cost perspective on formation and duration of trade. In: Review of International Economics 16 (5), 835–849.
BESEDEŠ, T. and T.J. PRUSA (2006a): Ins, outs and the duration of trade. In: Canadian Journal of Economics 39 (1): 266–295.
BESEDEŠ, T. and T.J. PRUSA (2006b): Product differentiation and duration of U.S. import trade. In:
Journal of International Economics 70 (2): 339–358.
BESEDEŠ, T. and T.J. PRUSA (2011): The role of extensive and intensive margins and export growth.
Journal of Development Economics 96 (2): 371–379.
16
BESEDEŠ,T., KIM,B. C.,and LUGOVSKYY, V. (2014): Export growth and credit constraints. European Economic Review, 70, 350-370.
BESEDEŠ, T., J. MORENO-CRUZ and V. NITSCH (2016): Trade integration and the fragility of trade relationships: Theory and empirics. Manuscript. http://besedes.econ.gatech.edu/wp- content/uploads/sites/322/2016/10/besedes-eia.pdf.
BRENTON, P., C. SABOROWSKI and E. VON UEXKÜLL (2010): What explains the low survival rate of developing country export flows. In: The World Bank Economic Review 24 (3): 474–499.
BOJNEC, Š. and I. FERTŐ (2008): European enlargement and agro-food trade. In: Canadian Journal of Agricultural Economics 56 (4): 563–579.
BOJNEC,Š. and I.FERTŐ (2009): Former Central European Free Trade Agreement countries’ agri-food trade specialisation. In: Agrarwirtschaft 58 (8): 354–362.
BOJNEC, Š. and I. FERTŐ (2012a): Complementarities of trade advantage and trade competitiveness measures. In: Applied Economics 44 (4): 399–408.
BOJNEC, Š. and I. FERTŐ (2012b): Does EU enlargement increase agro-food export duration? In: The World Economy 35 (5): 609–631.
BOJNEC, Š. and I. FERTŐ (2015): Agri-food export competitiveness in European Union countries. In:
JCMS: Journal of Common Market Studies 53 (3): 476–492.
BOJNEC, Š. and I.FERTŐ (2016): Drivers of the duration of grain competitiveness in European Union countries. In: Journal of Agricultural Science and Technology 18 (5): 1173–1185.
BOJNEC, Š. and I. FERTŐ (2017a): Drivers of the duration of comparative advantage in the European Union’s agri-food exports. In: Agricultural Economics/Zemedelska Ekonomika 63 (forthcoming).
BOJNEC,Š. and I.FERTŐ (2017b): Quality upgrades of EU agri-food exports. In: Journal of Agricultural Economics 68 (1): 269–279.
BOJNEC,Š. and I.FERTŐ (2017c): The duration of global agri-food export competitiveness. In: British Food Journal 119 (6): 1378–1393.
CADOT,O.,L.IACOVONE,M.D.PIEROLA and F.RAUCH (2013): Success and failure of African exporters.
In: Journal of Development Economics 101 (C): 284–296.
CARRARESI,L. and A.BANTERLE (2015): Agri-food competitive performance in EU countries: A fifteen- year retrospective. In: International Food and Agribusiness Management Review 18 (2): 37–62.
CHEPTEA,A.,L.FONTAGNÉ and S.ZIGNAGO (2014): European export performance. In: Review of World Economics 150 (1): 25–58.
CLEVES,M.A.,W.W.GOULD and R.G.GUTIERREZ (2004): An Introduction to Survival Analysis Using STATA, Stata Press, College Station, Texas.
CRESCIMANNO, M., A. GALATI and T. BAL (2014): The role of the economic crisis on the competitiveness of the agri-food sector in the main Mediterranean countries. In: Agricultural Economics/Zemedelska Ekonomika 60 (2): 49–64.
DALUM,B., K.LAURSEN and G. VILLUMSEN (1998): Structural change in OECD export specialisation patterns: de-specialisation and 'stickiness'. In: International Review of Applied Economics 12 (3):
423–443.
DEARDORFF,A. (1994): Exploring the limits of comparative advantage. In: Weltwirtschaftliches Archiv 130 (1): 1–19.
DE BENEDICTIS, L.D. and M. TAMBERI (2001): A note on the Balassa index of revealed comparative advantage. Working Papers #158, Dipartimento di Economia, Universita’ Politecnica delle Marche (I), doi:10.2139/ssrn.289602 (accessed on 4 November 2017).
DE BENEDICTIS,L. and M.TAMBERI (2004): Overall specialization empirics: techniques and applications.
In: Open Economies Review 15 (4): 323–346.
DIAO,X. and T.ROE (2000): How the financial crisis affected world agriculture: A general equilibrium perspective. In: American Journal of Agricultural Economics 82 (3): 688–694.
FEENSTRA,R.C. and A.K.ROSE (2000): Putting things in order: Trade dynamics and product cycles. In:
Review of Economics and Statistics 82 (3): 369–382.
17
FERTŐ,I. and K.A.SOOS (2009): Duration of trade of former communist countries in the EU market. In:
Post-Communist Economies 21 (1): 31–39.
FUGAZZA, M. and A.C.MOLINA (2009). The determinants of trade survival. (HEID Working Paper No 05/2009). Geneva: The Graduate Institute.
GÖRG,H.,R.KNELLER and B.MURAKÖZY (2012): What makes a successful export? Evidence from firm‐
product‐level data. In: Canadian Journal of Economics/Revue canadienne d'économique 45 (4): 1332–
1368.
GULLSTRAND,J. and M.PERSSON (2015): How to combine high sunk costs of exporting and low export survival. In: Review of World Economics 151 (1): 23–51.
HAVEMAN, J. and D. HUMMELS (2004): Alternative hypotheses and the volume of trade: the gravity equation and the extent of specialization. In: Canadian Journal of Economics 37 (1): 199–218.
HELPMAN,E. and P.R.KRUGMAN (1985): Market Structure and Foreign Trade, MIT Press, Cambridge.
HESS, W. and M. PERSSON (2011): Exploring the duration of EU imports. In: Review of World Economics 147 (4): 665–692.
HESS,W. and M.PERSSON (2012): The duration of trade revisited. Continuous-time versus discrete-time hazards. In: Empirical Economics 43 (3): 1083–1107.
HOEN,A.R. and J.OOSTERHAVEN (2006): On the measurement of comparative advantage. In: Annals of Regional Science 40 (3): 677–691.
JAUD,M. and M.KUKENOVA (2011): Financial development and survival of African agri-food exports.
(Policy Research Working Paper 5649). Washington, DC: World Bank.
LAFAY,G. (1992): The measurement of revealed comparative advantages. In: M.G.DAGENAIS and P.A.
MUET (eds), International Trade Modelling. London: Chapman & Hall, pp. 209–234.
JOSLING,T.,K.ANDERSON,A.SCHMITZ and S.TANGERMANN (2010): Understanding international trade in agricultural products: One hundred years of contributions by agricultural economists. In: American Journal of Agricultural Economics 92 (2): 424–446.
LEROMAIN, E. and G. OREFICE (2013): New revealed comparative advantage index: Dataset and empirical distribution. CEPII Working Paper 2013–20.
LORD, J.M. (1989). Product differentiation in international commodity trade. In: Oxford Bulletin of Economics and Statistics 51 (1): 35–53.
MELITZ, M. (2003) The impact of trade on intra-industry reallocations and aggregate industry productivity. In: Econometrica 71 (6): 1695–725.
NITSCH,V. (2009): Die another day: Duration in German import trade. In: Review of World Economics 145 (1): 133–154.
OBASHI, A. (2010): Stability of production networks in East Asia: Duration and survival of trade. In:
Japan and the World Economy 22 (1): 21–30.
OLPER, A. and V. RAIMONDI (2008): Market access asymmetry in food trade. In: Review of World Economics 144 (3): 509–537.
PETERSON, E.B., J.H.GRANT and J. RUDI-POLLOSHKA (2017): Survival of the fittest: export duration and failure into United States fresh fruit and vegetable markets. In: American Journal of Agricultural Economics 0(0): 1–23; doi: 10.1093/ajae/aax043.
PETRICK,M. and M.KLOSS (2013): Exposure of EU farmers to the financial crisis. In: Choices 28 (2): 1–
6.
PROUDMAN,J. and S.REDDING (1998): Openness and growth. London: The Bank of England, UK.
RAUCH, J.E. (1999). Networks versus markets in international trade. In: Journal of International Economics 48 (1): 7−35.
RAUCH,J.E. and J. WATSON (2003). Starting small and unfamiliar environment. In: International Journal of Industrial Organization 21 (7): 1021–1042.
SARKER, R. and S. RATNASENA (2014): Revealed comparative advantage and half‐a‐century competitiveness of Canadian agriculture: A case study of wheat, beef, and pork sectors. In: Canadian Journal of Agricultural Economics 62 (4): 519–544.
18
SCHOTT, P.K. (2004): Across-product versus within-product specialization in international trade. In:
Quarterly Journal of Economics 119 (2): 647–678.
SHANE, M.D. and W.M.LIEFERT (2000): The international financial crisis: Macroeconomic linkages to agriculture. In: American Journal of Agricultural Economics 82 (3): 682–687.
SHANE,M.,W.LIEFERT,M.MOREHART,M.PETERS,J.DILLARD,D.TORGERSON and W.EDMONDSON
(2009): The 2008/2009 World economic crisis: what it means for U.S. agriculture. A Report from the Economic Research Service; WRS-09-02, United States Department of Agriculture (USDA);Washington, D.C.; 30 p.TOVAR, J. and L.R. MARTÍNEZ (2011): Diversification, networks and the survival of exporting firms. Serie Documentos CEDE, 2011-08, Universidad de Los Andes.
UNSD (2017): Commodity Trade Database (COMTRADE). United Nations Statistical Division, New York.
VOLLRATH, T.L. (1991): A theoretical evaluation of alternative trade intensity measures of revealed comparative advantage. In: Weltwirtschaftliches Archiv 130 (2): 263–279.
VOLPE-MARTINCUS, C. and J. CARBALLO (2008): Survival of new exporters in developing countries:
Does it matter how they diversify? In: Globalization, Competitiveness and Governability 2 (3): 30–49.
World Bank (2017): Commodity Trade Database (COMTRADE). Washington D.C. Available through World Bank’s World Integrated Trade Solution (WITS) software at: http://www.wits.worldbank.org.
YU,R.,J.CAI and P.S.LEUNG (2009): The normalized revealed comparative advantage index. In: Annals of Regional Science 43 (1): 267–282.
YU,R., J.CAI, M.K.LOKE and P.S. LEUNG (2010): Assessing the comparative advantage of Hawaii’s agricultural exports to the US mainland market. In: Annals of Regional Science 45 (2): 473–485.
Contact author:
PROF. DR. ŠTEFAN BOJNEC
University of Primorska, Faculty of Management Cankarjeva 5, 6104 Koper, Slovenia
phone: +(385)-5-610 20 46, fax:+(386)-5-610 20 15 e-mail: stefan.bojnec@fm-kp.si; stefan.bojnec@siol.net
19
Figure 1. Total EU-28 agri-food trade (2000-2014)
Source: Authors’ own calculations based on COMTRADE DATABASE (UNSD, 2017) with WITS (WORLD TRADE INTEGRATION SOLUTION) software (THE WORLD BANK, 2017)
Figure 2. Mean of NRCA indices by country
Source: Authors’ own calculations based on COMTRADE DATABASE (UNSD, 2017) with WITS (WORLD TRADE INTEGRATION SOLUTION) software (THE WORLD BANK, 2017)
20
Figure 3. Number of spells with NRCA>0 indices and duration of NRCA>0 indices (%
of the number of agri-food products at the HS-6 level)
Source: Authors’ calculations based on COMTRADE DATABASE (UNSD, 2017) with WITS (WORLD TRADE INTEGRATION SOLUTION) software (THE WORLD BANK, 2017).
Figure 4. Kaplan-Meier survival functions for NRCA>0 indices
Source: Authors’ calculations based on COMTRADE DATABASE (UNSD, 2017) with WITS (WORLD TRADE INTEGRATION SOLUTION) software (THE WORLD BANK, 2017).
Note: Calculated at the HS-6-digit classification agri-food product level and aggregated for differentiated and non-differentiated agri-food products.
21
Table 1. Summary statistics of the length of spells that survived with continuous NRCA>0 for a specified number of years (2000–2014)
length of spells (in years) number of spells
mean median
all spells 3.329 3 57216
single spell 3.264 3 47148
Source: Authors’ own calculations based on COMTRADE DATABASE (UNSD, 2017) with WITS (WORLD TRADE INTEGRATION SOLUTION) software (THE WORLD BANK,2013)
Table 2. Duration of comparative advantage and economic crisis
Eq. (1) Eq. (2) Eq. (3) Eq. (4) Duration -0.653*** -0.653*** -0.657*** -0.657***
NRCAt-1 -1.4e+05*** -1.4e+05*** -1.4e+05*** -1.4e+05***
Crisis 0.048*** 0.048***
Pdifferentiation (conservative) -0.115*** -0.112***
Pdifferentiation (liberal) -0.112*** -0.109***
constant 1.277*** 1.271*** 1.252*** 1.247***
Number of observations (N) 193959 193959 193959 193959 Value of Log likelihood function -44556.789 -44558.563 -44546.396 -44548.15
rho 0.373 0.373 0.365 0.365
Likelihood-ratio (LR) test of rho=0 0.000 0.000 0.000 0.000 Source: Authors’ own calculations.
Note: ** Significant at the 0.05 level, *** Significant at the 0.01 level
22
Table 3. Growth of comparative advantage and economic crisis
Eq. (1) Eq. (2) Eq. (3) Eq. (4) Eq. (5) Eq. (6) Eq. (7)
Duration -0.004*** -0.004*** -0.004*** -0.004*** -0.005*** -0.004*** -0.005***
NRCAt-1 -400.780*** -404.663*** -401.205*** -403.107*** -376.040*** -399.442*** -372.309***
Crisis -0.103*** -0.097*** -0.102*** -0.097***
After-crisis 0.173*** 0.548*** 0.173*** 0.548***
Crisis-duration 0.006** 0.006**
After-crisis-duration -0.089*** -0.089***
Pdifferentitation (conservative) -0.004 -0.004 -0.004
Pdifferentiation (liberal) -0.001 -0.001 -0.00
constant 4.611*** 4.612*** 4.612*** 4.703*** 4.703*** 4.702*** 4.702***
N 182013 182013 182013 182013 182013 182013 182013
R2 0.018 0.018 0.018 0.019 0.020 0.019 0.020
Source: Authors’ own calculations.
Note: ** Significant at the 0.05 level, *** Significant at the 0.01 level; all estimations include country- and year-fixed effects
23
Table 4. Initial value of comparative advantage and economic crisis
Eq. (1) Eq. (2) Eq. (3) Eq. (4)
Crisis -0.928*** -0.928*** -0.661*** -0.664***
Crisis-duration -0.078*** -0.077***
Pdifferentiation (conservative) -0.314*** -0.313***
Pdifferentiation (liberal) -0.344*** -0.342***
constant -5.365*** -5.362*** -5.361*** -5.359***
N 10465 10465 10465 10465
R2 0.277 0.277 0.278 0.278
Source: Authors’ own calculations.
Note: ** Significant at the 0.05 level, *** Significant at the 0.01 level; all estimations include country-fixed effects