carcinoma in a Hungarian population
Eva Cs}osz1,2,*, Bernadett Markus1,2,*, Zsuzsanna Darula3, Katalin F. Medzihradszky3, Judit Nemes4, Emese Szabo1,2, Jozsef T}ozser1,2, Csongor Kiss5and Ildiko Marton6
1 Proteomics Core Facility, Department of Biochemistry and Molecular Biology, Faculty of Medicine, University of Debrecen, Hungary 2 Biomarker Research Group, Department of Biochemistry and Molecular Biology, Faculty of Medicine, University of Debrecen, Hungary 3 Laboratory of Proteomics Research, Biological Research Centre of the Hungarian Academy of Sciences, Szeged, Hungary
4 Department of Pedodontics, Faculty of Dentistry, University of Debrecen, Hungary 5 Department of Pediatrics, Faculty of Medicine, University of Debrecen, Hungary
6 Department of Restorative Dentistry, Faculty of Dentistry, University of Debrecen, Hungary
Keywords
biomarker; ELISA; oral squamous cell carcinoma; proteomics analysis Correspondence
E. Cs}osz, Proteomics Core Facility, Department of Biochemistry and Molecular Biology, Faculty of Medicine, University of Debrecen, 4010 Debrecen, Egyetem ter. 1., Hungary
Fax: +36-52-314989 Tel: +36-52-416432
E-mail: cseva@med.unideb.hu
*Equally contributing first authors.
(Received 17 October 2017, revised 23 December 2017, accepted 15 January 2018) doi:10.1002/2211-5463.12391
Oral squamous cell carcinoma (OSCC) is the seventh most common malig- nancy and the ninth most frequent cause of cancer death in Europe.
Within Europe, Hungary has one of the highest rates of OSCC incidence and mortality. Thus, there is an urgent need to improve early detection.
Saliva, as a readily available body fluid, became an increasingly important substance for the detection of biomarkers for many diseases. Different research groups have identified salivary biomarkers specific for OSCC for different countries. In this study, saliva samples of Hungarian patients with OSCC were studied to discover disease-specific and perhaps region-specific biomarkers. LC-mass spectrometry (MS)/MS analysis on a linear ion trap- Orbitrap mass spectrometer was used for qualitative and quantitative sali- vary protein profiling. More than 500 proteins were identified from saliva by shotgun proteomics. The up- and downregulated proteins in the saliva of patients with OSCC highlighted the importance of protein–protein inter- action networks involving the immune system and proteolysis in disease development. Two potential biomarkers from our shotgun analysis and a third candidate reported earlier by a Taiwanese group were further exam- ined by ELISA on a larger reference set of samples. Resistin, a biomarker reported in Taiwan but not validated in our study, highlights the necessity of application of standardized analysis methods in different ethnic or geo- graphical populations to identify biomarkers with sufficient specificity and sensitivity.
The oral cavity is the most frequent site of head and neck cancers, developing predominantly as oral cavity squamous cell carcinomas (OSCCs) in the upper aerodigestive epithelium [1,2]. The three major recog- nized risk factors of OSCC are tobacco consumption, alcohol consumption, and poor oral hygiene [3–5].
OSCC mortality rates reflect the different consumption patterns of alcohol and tobacco in European countries
[6]. Annually, more than 300 000 new patients are diagnosed with OSCC worldwide. The disease is asso- ciated with poor prognosis and high mortality mainly due to late diagnosis because of the lack of reliable early diagnostic markers [7]. Mortality rate from OSCC is about 10-fold higher for men than for women. However, female OSCC incidence increased dramatically in the last decade. In addition, a rising
Abbreviations
MS, mass spectrometry; OSCC, oral squamous cell carcinoma; UPLC, ultraperformance liquid chromatography.
tendency was observed in younger patient cohorts [8].
In contrast to other European countries where the mortality rates of OSCC started to decline, unfavor- able incidence and mortality figures remained exceed- ingly high in Hungary since the 1970s representing a major public health challenge [9].
Development of cancer diagnostic tools with suffi- ciently high sensitivity and specificity is required to enable early detection of OSCC [10]. Recent treatment strategies of patients with OSCC are based on tradi- tional stage-predicting indices and histological grading [11]. Unfortunately, these predictors are relatively sub- jective and unreliable because tumors with the same staging and grading may respond to therapy differ- ently. Thus, improving the diagnostic methods is required. A potential way of improving our diagnostic tools is to perform in-depth salivary analyses to dis- cover and to assess biochemical and immunological markers in the saliva for early oral cancer diagnosis [12,13]. Biomarkers identified in the last decades in biological fluids can be linked to carcinogenesis and may serve as prognostic factors and saliva is a new clinical biomarker source that can be easily collected by noninvasive means [14–18]. As there is direct con- tact between saliva and the oral lesion(s), disease- related concentration changes of saliva ingredients may provide as good or better clues than serum sam- ples [19]. More than 3700 salivary proteins have been identified by several research groups [20,21]. Many proteins were declared potential salivary biomarkers of OSCC in different countries [22–24]. In this study, we present a two-stage approach for the discovery of can- didate OSCC-specific salivary biomarkers in the Hun- garian population. LC-mass spectrometry (MS)/MS analysis using ultraperformance liquid chromatogra- phy (UPLC) coupled to a linear ion trap-Orbitrap hybrid tandem mass spectrometer was applied for qualitative and quantitative salivary protein profiling.
Selected proteins, based on the shotgun analysis of a few randomly selected samples, were further investi- gated by ELISA on a reference set of samples.
Materials and methods
Patients and saliva collection
Donor enrollment, sample collection, and processing con- formed to the principles of the Helsinki Declaration. Ethi- cal approval was obtained from the University of Debrecen Ethics Committee (No. 3385-2011), and all subjects pro- vided written informed consent. Clinical examinations were performed by dental surgeons from the Faculty of Den- tistry, University of Debrecen. Adult patients (>18 years)
with histology-proven OSCC were recruited into the study.
Saliva samples were collected before starting any antitumor therapy. Age-matched controls (MCTL) were consecutive patients and young controls (YCTL) were medical students admitted to the Faculty of Dentistry for regular dental checkup. Exclusion criteria included children (≤18 years), pregnancy and breast-feeding, diabetes mellitus, human papillomavirus infection, human immunodeficiency virus infection, autoimmune and immunodeficiency disorders, and cancer other than OSCC.
Unstimulated saliva samples were collected from 43 donors between 9 a.m. and 11 a.m. at the Faculty of Den- tistry, University of Debrecen (collection between May 9, 2013, and February 29, 2016). The test set contained three randomly selected samples from patients with OSCC and controls for proteomics analysis, whereas the reference set contained samples from 20 patients with OSCC (mean age:
57 years), six YCTL (mean age: 24.5 years), and 11 MCTL (mean age: 59 years) for biomarker verification. Saliva sam- ples were kept on ice during collection and were filtered using Millipore SLSV025LS 5-lm-pore-size syringe filters (Merck, Billerica, MA, USA). The filtered saliva was ali- quoted and immediately placed at 70°C until further use.
Sample preparation for mass spectrometry
Filtered saliva was dried in SpeedVac and redissolved in 25 mM pH 8.5 ammonium bicarbonate buffer. Total pro- tein concentration of salivary samples was measured using the Bradford method [25]. Following denaturation with 8M urea, all samples were reduced with 10 mM dithiothreitol (Bio-Rad, Hercules, CA, USA) in ammonium bicarbonate buffer. Then, samples were alkylated with 20 mM iodoac- etamide (Bio-Rad) in ammonium bicarbonate buffer and diluted with 25 mM ammonium bicarbonate (Sigma, St.
Louis, MO, USA) to reduce the urea concentration to 1M. Each sample was digested by MS-grade modified trypsin (AB Sciex, Framingham, MA, USA) in 1 : 25 enzyme-to- protein ratio (w/w) at 37°C overnight. The digested sam- ples were dried in SpeedVac and redissolved in 0.1% formic acid. The digests were desalted on Pierce C18 Tips (Thermo Scientific, West Palm Beach, FL, USA), and the eluates were dried and stored at 70°C until MS analysis.
Mass spectrometry analysis
Tryptic digests representing 2lg total protein were ana- lyzed by LC-MS/MS using a Waters nanoACQUITY UPLC Online coupled to a linear ion trap-Orbitrap hybrid tandem mass spectrometer (Orbitrap Elite; Thermo Scien- tific) operating in positive ion mode. After trapping at 3%
B (Waters Symmetry C18 180lm920 mm column, 5lm particle size, 100A pore size; flow rate: 10lLmin 1), pep- tides were fractionated using a linear gradient of 3–40% B in 100 min (Waters BEH C18 75lm9250 mm column,
1.7lm particle size, 300A pore size; solvent A: 0.1% for- mic acid/water; solvent B: 0.1% formic acid/5% dimethyl sulfoxide/acetonitrile; flow rate: 400 nLmin 1). Data acqui- sition was carried out in a data-dependent fashion, and the 10 most abundant, multiply charged ions were selected from each MS survey (m/z: 380–1600; resolution: 60 000, acquired in profile mode) for MS/MS analyses. CID analy- ses were performed in the linear ion trap (normalized colli- sion energy: 35). Dynamic exclusion was enabled (exclusion time: 30 s).
Protein identification
Peak lists generated from the MS/MS data by the ‘PAVA’ software [26] were searched against the human subset of the UniProt database (downloaded on June 10, 2014;
136 245 target sequences concatenated with a randomized sequence for each entry) using the PROTEINPROSPECTOR
search engine (v.5.10.9.). Search parameters: enzyme: tryp- sin with maximum 1 missed cleavage site; fixed modifica- tion: carbamidomethyl (Cys); variable modifications:
acetylation (protein N terminus), oxidation (Met), and pyroglutamic acid formation (N-terminal Gln) allowing up to two variable modifications per peptide; and mass accu- racy: 5 p.p.m. and 0.6 Da for precursor and fragment ions (both monoisotopic), respectively. The following acceptance criteria were applied: score>22 and 15, and E-value<0.01 and 0.05 for protein and peptide identifications, respec- tively. The false-positive rates of the identified proteins and peptides were<1%. Relative abundance of individual pro- teins was estimated by spectral counting: The number of identifications per protein (PSMs) was normalized to the total number of identifications, and then, these relative spectral counts were compared across the different samples.
Functional analyses were performed in the case of pro- teins with at least three unique peptide identifications. For the calculation of the OSCC/control ratio, the proteins which were identified with at least three unique peptides in at least two of three samples in either the control or the OSCC group were considered.
Validation of the candidate biomarkers using ELISA
All saliva samples from patients with OSCC and controls were analyzed in duplicate with quantitative ELISA. The ELISA kit for heparin cofactor 2 (Cat. number:
LS-F13221) was purchased from LifeSpan Biosciences (Seattle, WA, USA), for resistin (Cat. number: KHP0051) from Thermo Fisher Scientific (West Palm Beach, FL, USA), and for complement C5 (Cat. number: ab125963) from Abcam (Branford, CT, USA). The concentration of the studied proteins in saliva was measured by the sand- wich ELISA method according to the instruction provided
by the vendor of each kit. Absorbance was measured at 450 nm, and concentrations were calculated based on the recorded 7-point calibration curves.
First, the variation coefficient of the parallel measure- ments was calculated and those data having more than 25 CV % value were excluded from statistical analysis.
Bioinformatics
The cluster analysis was carried out with Cluster 3.0 (http://cluster2.software.informer.com/) using the C CLUS- TERING LIBRARYversion 1.52, and the heat map was created withJAVA TREEVIEWversion 1.1.6r4 [27].
The protein–protein interaction network of salivary pro- teins was generated usingSTRINGversion 10.5 [28,29] apply- ing default settings and medium stringency. After the generation of networks, the enriched gene ontology (GO) terms provided by the software were also examined.
The statistical analysis of ELISA data was performed using the Mann–Whitney U-test and the two-samplet-test to compare the protein concentrations between groups. The data were considered significantly different where the P value was<0.05.
Results and Discussion
Demographic and clinical characteristics of patients with OSCC
Among the included 17 patients, 13 were males and 4 females between the age of 44 and 73 years. The tumor developed in the tongue (T) in six cases and in the floor of the mouth (F) in four cases, and in three cases, it was detected in the gingival (G) region. In four cases, the tumor development showed multiple localization, and in two patients, the tumor developed in the T and either in the F or in the G region, while in another two patients, the tumor development was detected in the T, in the F, and also in the G region.
Eight patients were discovered in early tumor develop- ment stage (stage I: 5; and stage II: 3), and nine patients were diagnosed with advanced tumors (stage III: 4; and stage IV: 5). There were six well-differen- tiated (W), seven moderately differentiated (M), and four poorly differentiated (P) OSCC samples (Table 1).
Shotgun proteomics analysis of saliva samples Three randomly selected samples from patients with OSCC and matched controls, respectively, were sub- jected to shotgun proteomics analysis. More than 500 proteins were identified from salivary samples. For
protein quantification, spectral counting was used and the ratios of OSCC : CTL protein quantities have been determined. Detailed information of the identified proteins is presented in Table S1.
The proteins with at least three unique sequences and with at least twofold change value (OSCC/CTL ratio
<0.5 or>2) were subjected to further examination. A cluster analysis was carried out, and a heat map was generated to visualize the changes in protein amount in CTL and OSCC samples (Fig.1). Based on cluster anal- ysis, the protein levels can discriminate the OSCC group from the CTL group. Proteins were classified as salivary proteins or proteins being present in saliva under nor- mal conditions and as acute-phase proteins (Table2).
For protein classification, the UniProt and Sys-Body- Fluid databases were used; the latter contains more than 10 000 proteins of different body fluid proteomes [30].
In addition, some proteins were classified as salivary proteins based on the literature data [21,31–35].
Two proteins, cytochrome cand mucin-7, were only present in the CTL samples, and six proteins, comple- ment factor H (CFH) and C5 (C5), corticosteroid- binding globulin (SERPINA6), heparin cofactor 2 (SERPIND1), apolipoprotein E (APOE), and serum paraoxonase/arylesterase 1 (PON1), were only present in the OSCC samples (Table3).
Functional analysis of salivary proteins
It was observed that the level of some proteins such as apolipoproteins, components of the complement
system, proteinases, proteinase inhibitors, components of the coagulation cascade is upregulated. This might indi- cate a change in proteolysis most probably associated with the interrelated coagulation cascade-complement activation processes. At the same time, the level of proteins having role in metabolism and host defense was downregulated showing extensive cancer-related changes (Table2). For a more detailed functional anal- ysis of the differentially expressed proteins, GO analysis was performed; the Biological Process, Molecular Func- tion, and Cellular Localization according to GO (http://
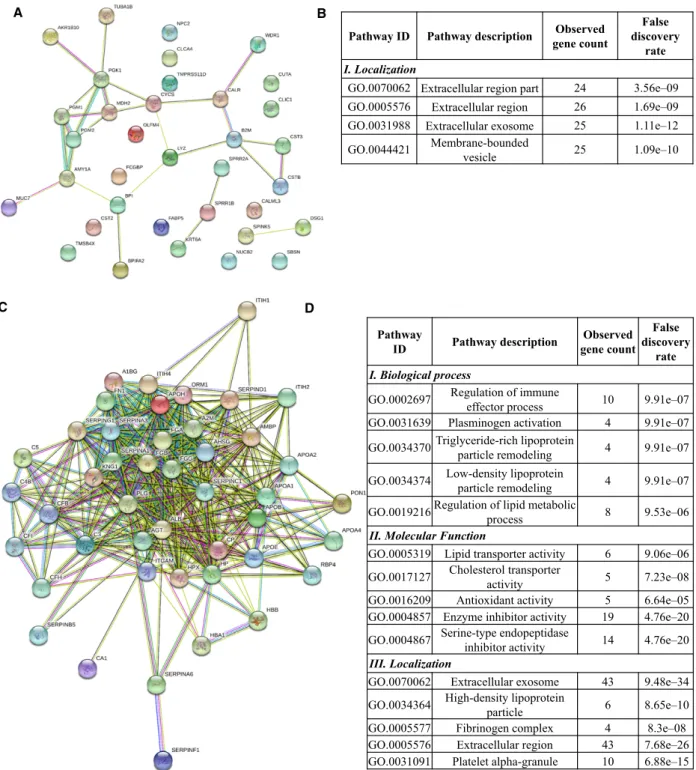
www.geneontology.org/) were examined. First, the net- work of differentially expressed proteins was generated using STRING version 10.5 [28,29], followed by GO enrichment analysis provided by String. The network of downregulated proteins contained 35 proteins (nodes) and 27 possible protein–protein interactions analyzed at medium stringency (Fig.2A). No biological function was enriched in the downregulated proteins in this loosely connected network (Fig.2B); however, seven of 35 downregulated proteins are metabolic enzymes par- ticipating mainly in carbohydrate metabolism and 10 of 35 proteins have a role in defense. The upregulated 45 proteins show a highly interconnected protein–protein interaction network with 400 interactions analyzed at medium stringency (Fig.2C). The enriched functions indicate active regulatory mechanisms implicating the immune system, lipid metabolism, plasminogen activa- tion, antioxidant activity, and inhibition of enzymatic activities (Fig.2D). Regarding localization of up- or downregulated proteins, all are mainly extracellular
Table 1.Demographic and clinical characteristics of patients with OSCC. In the case of each patient, the gender, age, tumor localization, TNM classification, tumor stage, and stage of differentiation are given. M is for male and F for female. Regarding tumor localization, T is for tongue, G is for gingiva, and F is for floor of the mouth. The W is for well-differentiated, M is for moderately differentiated, and P is for poorly differentiated tumors.
Patient code Gender Age (year) Tumor localization TNM classification Tumor stage Stage of differentiation
1 M 73 T T2N1M0 III W
2 F 69 G T4N0M0 IV W
3 F 67 F T4N2M0 IV W
4 M 52 T; G; F T4N1M0 IV M
5 M 57 T T3N0M0 III W
6 F 59 T T1N0M0 I W
7 M 67 F T1N0M0 I W
8 F 50 T T2N0M0 II M
9 M 52 T; G T2N2M0 IV M
10 M 48 T T1N0M0 I M
11 M 64 T T2N0M0 II P
12 M 44 G T4N1M0 IV M
13 M 44 T; F T3N0M0 III M
14 M 60 F T2N0M0 II M
15 M 49 T; G; F T3N1M0 III P
16 M 47 G T1N0M0 I P
17 M 64 F T1N0M0 I P
proteins according to GO (Fig.2B,D), but a part of the upregulated proteins originate from lipid particles or platelet alpha-granules indicating the presence of a pos- sibly cancer-induced complex process involving systemic mechanisms.
To obtain more insights into the changes associated with OSCC, a literature search was performed to see which proteins have been associated with oncogenesis.
Most of the proteins were already associated with OSCC, and 32 proteins were identified to be present in saliva in this pathological condition.
Complement C4B (C4B), complement factor B (CFB), complement C3, and alpha-1-antitrypsin were shown to be associated with the risk of developing OSCC according to a targeted proteomics study [36].
The levels of apolipoproteins A and E; PON1; inter- alpha-trypsin inhibitor heavy chain H1, H2, and H4;
kininogen 1; protein AMBP; nucleobindin-2; SER- PIND1; and SERPINA6 were found to be upregulated in OSCC in shotgun proteomics experiments carried out on saliva samples [23]. The presence of APOE was related to the increased invasion potential of OSCC [37].
CTL1 CTL2 CTL3 OSCC1 OSCC2 OSCC3
SERPINC1 CFI SERPINA3 ORM1 APOB SERPINA1 APOA2 APOH SERPING1 A2M APOA1 A1BG FGA FGB AHSG KNG1 C3 FGG HPX HP APOA4 AMBP ITIH1 AGT CP CFB C4B ITIH2 ITIH4 PLG SERPINA6 CFH APOE C5 PON1 SERPIND1 ALB SERPINB5 SERPINF1 FN1 CA1 HBA1 HBB RBP4 ITGAM FCGBP BPI CLCA4 CYCS AKR1B10 CALR SPRR2A BPIFA2 CST2 B2M CALML3 SPRR1B DSG1 FABP5 CSTB MDH2 NPC2 TMPRSS11D PGK1 TMSB4X TUBA1B CST3 CUTA KRT6A LYZ NUCB2 SPINK5 SBSN AMY1A WDR1 CLIC1 OLFM4 PGM2 PGM1 MUC7
0.00 1.00 2.00 3.00
Relave protein abundance [%]
Fig. 1.Cluster analysis and heat map of proteins identified in the CTL and OSCC groups. The relative peptide count (%), characteristic of each sample, is shown.
Table 2.List of proteins with at least twofold change between OSCC and CTL groups. The UniProt protein ID, the protein name, and function are presented. The representative identification and quantification data, the number (#) of unique peptides, the sequence coverage (%Cov), and the OSCC/CTL ratio are given in each case. Classification indicating salivary (S) or acute-phase (A) proteins is presented. The type of sample from patients with OSCC where the protein was identified is also listed. NI denotes proteins not identified in OSCC yet.
Protein ID Protein name
# Unique peptide %Cov
OSCC/
CTL ratio Classification Function
Type of OSCC sample O60218 Aldo-keto reductase
family 1 member B10
5 17 0.10 S Metabolic enzyme Salivaa[23]
P02763 Alpha-1-acid glycoprotein 1
8 37 3.14 AS Immune response, transport Saliva [16]
P01011 Alpha-1-antichymotrypsin 12 31 3.29 AS Protease inhibitor NI
P01009 Alpha-1-antitrypsin 25 62 3.70 S Protease inhibitor Saliva [36]
P04217 Alpha-1B-glycoprotein 12 39 3.25 S Immune response Saliva [16]
P02765 Alpha-2-HS-glycoprotein 7 26 2.70 AS Protease inhibitor, immune
response, transport
NI
P01023 Alpha-2-macroglobulin 54 51 2.16 S Protease inhibitor NI
P04745 Alpha-amylase 1 42 83 0.21 S Metabolic enzyme Saliva [14]
P01019 Angiotensinogen 7 18 8.50 AS Renin–angiotensin system NI
P01008 Antithrombin III 7 22 2.08 AS Protease inhibitor, blood
coagulation
NI
P02647 Apolipoprotein A-I 24 69 2.14 S Lipid metabolism Saliva [23]
P02652 Apolipoprotein A-II 7 67 3.85 S Lipid metabolism Saliva [23]
P06727 Apolipoprotein A-IV 5 16 3.55 S Lipid metabolism Saliva [23]
P04114 Apolipoprotein B-100 42 13 8.12 S Lipid metabolism NI
P02649 APOE 4 18 Only in OSCC S Lipid metabolism Saliva [23]
P17213 Bactericidal permeability- increasing protein
4 12 0.24 S Immune response NI
P02749 Beta-2-glycoprotein 1 12 44 3.02 S Lipid metabolism, blood
coagulation
Saliva [22]
P61769 Beta-2-microglobulin 5 57 0.46 S Immune response NI
Q96DR5 BPI fold-containing family A member 2
11 41 0.49 S Immune response, defense NI
Q14CN2 Calcium-activated chloride channel regulator 4
5 8 0.23 S Transport NI
P27482 Calmodulin-like protein 3 6 64 0.37 S Metal binding, chaperone NI
P27797 Calreticulin 4 19 0.37 S Chaperone NI
P00915 Carbonic anhydrase 1 6 34 8.55 S Metabolic enzyme, acid–
base balance
Saliva [22]
P00450 Ceruloplasmin 27 37 3.65 AS Metal binding Blood [39]
O00299 Chloride intracellular channel protein 1
7 34 0.31 S Transport, cell cycle
regulation
NI
P01024 Complement C3 84 61 2.77 AS Immune response Saliva [36]
P0C0L5 Complement C4-B 32 25 6.69 AS Immune response Saliva [36]
P01031 Complement C5 7 5 Only in OSCC AS Immune response NI
B4E1Z4 CFB 22 22 5.44 AS Immune response Saliva [36]
P08603 CFH 21 22 Only in OSCC AS Immune response NI
P05156 Complement factor I 3 7 6.42 AS Immune response NI
P22528 Cornifin-B 6 79 0.45 S Cornification NI
P08185 Corticosteroid-binding globulin
4 15 Only in OSCC AS Protease inhibitor Saliva [23]
P04080 Cystatin-B 6 86 0.39 S Protease inhibitor NI
P01034 Cystatin-C 7 43 0.33 S Protease inhibitor NI
P09228 Cystatin-SA 13 69 0.35 S Protease inhibitor Saliva [14]
P99999 Cytochromec 4 32 0.00 A Electron transport chain,
apoptosis
Tissue [53]
Q02413 Desmoglein-1 8 12 0.40 S Desmosome component NI
Table 2.(Continued).
Protein ID Protein name
# Unique peptide %Cov
OSCC/
CTL ratio Classification Function
Type of OSCC sample P61916 Epididymal secretory
protein E1
4 33 0.30 S Lipid metabolism,
cholesterol transport
NI Q01469 Fatty acid-binding
protein, epidermal
12 79 0.49 S Lipid metabolism Salivaa[23]
P02671 Fibrinogen alpha chain 11 13 2.67 AS Blood coagulation Blood [40]
P02675 Fibrinogen beta chain 20 49 2.91 AS Blood coagulation Blood [40]
P02679 Fibrinogen gamma chain 18 48 2.43 AS Blood coagulation Blood [40]
B7ZLE5 FN1 protein 24 17 5.73 S Cell adhesion Tissue [42]
P00738 Haptoglobin 29 67 2.61 AS Heme binding Blood [38]
P69905 Hemoglobin subunit alpha
11 92 3.37 S Oxygen transport Salivaa[23]
P68871 Hemoglobin subunit beta
17 94 4.41 S Oxygen transport Salivaa[23]
P02790 Hemopexin 20 52 2.41 AS Heme binding Saliva [16, 22]
P05546 Heparin cofactor 2 8 17 Only in OSCC A Blood coagulation Saliva [23]
Q9Y6R7 IgGFc-binding protein 52 17 0.49 S Immune response NI
P11215 Integrin alpha-M 6 9 2.01 S Immune response Tissue [41]
P19827 Inter-alpha-trypsin inhibitor heavy chain H1
8 14 3.76 S Protease inhibitor Saliva [23]
P19823 Inter-alpha-trypsin inhibitor heavy chain H2
10 18 11.23 S Protease inhibitor Saliva [23]
Q14624 Inter-alpha-trypsin inhibitor heavy chain H4
13 22 5.33 S Protease inhibitor Saliva [23]
P02538 Keratin, type II cytoskeletal 6A
21 39 0.44 S Cytoskeleton NI
P01042 Kininogen-1 11 18 2.89 S Protease inhibitor, blood
coagulation
Saliva [23]
P61626 Lysozyme C 7 54 0.47 S Host defense NI
P40926 Malate dehydrogenase, mitochondrial
4 17 0.37 S Metabolic enzyme NI
Q8TAX7 Mucin-7 4 12 0.00 S Host defense NI
P80303 Nucleobindin-2 8 26 0.32 S Metal binding Saliva [23]
Q6UX06 Olfactomedin-4 7 20 0.47 S Cell adhesion NI
P36871 Phosphoglucomutase-1 6 13 0.08 S Metabolic enzyme NI
Q96G03 Phosphoglucomutase-2 5 11 0.40 S Metabolic enzyme NI
P00558 Phosphoglycerate kinase 1
10 33 0.44 S Metabolic enzyme Saliva [22]
P36955 Pigment epithelium- derived factor
4 12 7.17 S Tumor development,
angiogenesis
NI P05155 Plasma protease C1
inhibitor
8 21 5.95 S Protease inhibitor, blood
coagulation
NI
P00747 Plasminogen 9 17 5.11 AS Blood coagulation NI
P02760 Protein AMBP 6 23 5.41 S Protease inhibitor, host
defense
Saliva [23]
O60888 Protein CutA 3 33 0.43 S Metal binding, enzyme
binding
NI
P02753 Retinol-binding protein 4 5 24 2.54 S Protease inhibitor, host
defense
Blood [38]
Q9NQ38 Serine protease inhibitor Kazal-type 5
11 13 0.32 S Lipid metabolism NI
P36952 Serpin B5 4 14 2.63 S Tumor suppressor Blood [12]
P02768 Serum albumin 71 84 2.53 S Transport Saliva [22]
P27169 Serum paraoxonase/
arylesterase 1
9 37 Only in OSCC A Detoxification Saliva [23]
The alpha-1-acid glycoprotein, alpha-1B glycopro- tein, alpha-amylase, beta-2-glycoprotein, carbonic anhydrase 1, cystatin-SA, hemopexin, phosphoglycer- ate kinase, and serum albumin were identified as potential salivary markers of OSCC [14,16,22].
Some of the proteins found to be differentially expressed in our study, such as fibrinogen alpha, beta, and gamma chains, haptoglobin, SERPINB5, retinol- binding protein 4, and ceruloplasmin, were shown to be plasma markers of OSCC, while the presence of integrin alpha-M and fibronectin FN1 was demon- strated in the OSCC tissue [12,38–42].
In the case of 36 proteins, no association with OSCC was found so far (Table2). Angiotensinogen and plasminogen themselves were not found to be
associated with OSCC, but the plasminogen activator system was shown to be a predictive marker for early OSCC, and by bioinformatics analysis, the angioten- sin-converting enzymes were associated with malig- nant epithelial neoplasia characteristic of OSCC [43,44]. In the case of six proteins, not the protein from our list, but another protein from the same family was already demonstrated to be differentially expressed in OSCC (Table2). In the case of SER- PINB5, there are contradictory data; in our study, the level of SERPINB5 was found to be elevated in OSCC; however, the SERPINB5 and different forms of SERPINS from clade B were found by other groups to be downregulated in OSCC on mRNA level and higher SERPINB5 levels were found to
Table 2.(Continued).
Protein ID Protein name
# Unique peptide %Cov
OSCC/
CTL ratio Classification Function
Type of OSCC sample P35326 Small proline-rich protein
2A
6 79 0.29 S Cornification Salivaa[23]
Q6UWP8 Suprabasin 12 33 0.05 S Cell proliferation NI
P62328 Thymosin beta-4 5 64 0.42 S Actin binding, cell
proliferation
NI O60235 Transmembrane
protease serine 11D
3 10 0.20 S Protease, host defense NI
P68363 Tubulin alpha-1B chain 4 12 0.40 S Microtubule component Salivaa[23]
O75083 WD repeat-containing protein 1
7 19 0.13 S Cell migration NI
aIndicates that not the protein itself, but another close family member of it was already found in OSCC.
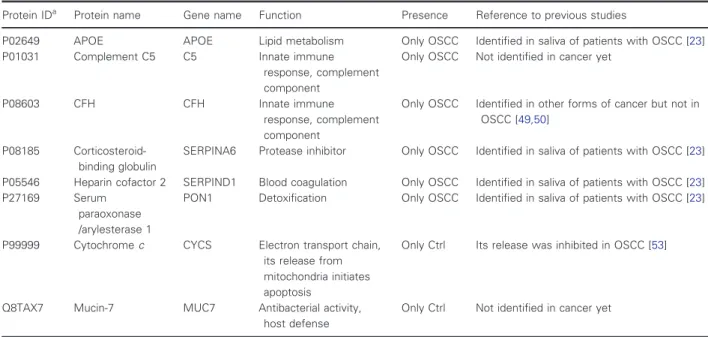
Table 3.Proteins identified only in the OSCC or CTL group.
Protein IDa Protein name Gene name Function Presence Reference to previous studies
P02649 APOE APOE Lipid metabolism Only OSCC Identified in saliva of patients with OSCC [23]
P01031 Complement C5 C5 Innate immune
response, complement component
Only OSCC Not identified in cancer yet
P08603 CFH CFH Innate immune
response, complement component
Only OSCC Identified in other forms of cancer but not in OSCC [49,50]
P08185 Corticosteroid- binding globulin
SERPINA6 Protease inhibitor Only OSCC Identified in saliva of patients with OSCC [23]
P05546 Heparin cofactor 2 SERPIND1 Blood coagulation Only OSCC Identified in saliva of patients with OSCC [23]
P27169 Serum
paraoxonase /arylesterase 1
PON1 Detoxification Only OSCC Identified in saliva of patients with OSCC [23]
P99999 Cytochromec CYCS Electron transport chain, its release from mitochondria initiates apoptosis
Only Ctrl Its release was inhibited in OSCC [53]
Q8TAX7 Mucin-7 MUC7 Antibacterial activity,
host defense
Only Ctrl Not identified in cancer yet
aBased on http://www.uniprot.org/.
correlate with better prognosis of patients with oral cancer [45,46].
Plasma protease C1 inhibitor (SERPING1), antithrombin III, and fibronectin were found to play a
role in carcinogenesis, but their implication in oral cancer, especially in OSCC, has not been demonstrated yet [47,48]. The CFH was previously identified in lung adenocarcinoma and cutaneous squamous cell Pathway ID Pathway description Observed
gene count
False discovery
rate I. Localization
GO.0070062 Extracellular region part 24 3.56e–09 GO.0005576 Extracellular region 26 1.69e–09 GO.0031988 Extracellular exosome 25 1.11e–12 GO.0044421 Membrane-bounded
vesicle 25 1.09e–10
A B
Pathway
ID Pathway description Observed gene count
False discovery
rate I. Biological process
GO.0002697 Regulation of immune
effector process 10 9.91e–07 GO.0031639 Plasminogen activation 4 9.91e–07 GO.0034370Triglyceride-rich lipoprotein
particle remodeling 4 9.91e–07 GO.0034374 Low-density lipoprotein
particle remodeling 4 9.91e–07 GO.0019216Regulation of lipid metabolic
process 8 9.53e–06
II. Molecular Function
GO.0005319 Lipid transporter activity 6 9.06e–06 GO.0017127 Cholesterol transporter
activity 5 7.23e–08
GO.0016209 Antioxidant activity 5 6.64e–05 GO.0004857 Enzyme inhibitor activity 19 4.76e–20 GO.0004867 Serine-type endopeptidase
inhibitor activity 14 4.76e–20 III. Localization
GO.0070062 Extracellular exosome 43 9.48e–34 GO.0034364 High-density lipoprotein
particle 6 8.65e–10
GO.0005577 Fibrinogen complex 4 8.3e–08 GO.0005576 Extracellular region 43 7.68e–26 GO.0031091 Platelet alpha-granule 10 6.88e–15
C D
Fig. 2.The protein–protein interaction network and functional classification of up- and downregulated proteins in OSCC. The network of downregulated (A) and upregulated (C) proteins in OSCC displayed by String 10.4 using default settings and medium stringency. Each node represents a protein and the edges represent protein–protein interactions based on different levels of evidence collected by String. The enrichment table of GO terms calculated by String in the case of downregulated (B) and upregulated (D) proteins is shown indicating the number of the proteins belonging to each term and the false discovery rate calculated by String.
carcinoma, but not in OSCC [49,50], and apoB100 was found in serum of patients with head and neck squa- mous cell carcinoma [51]. No data were found on the presence of complement C5 and mucin-7 in cancer;
however, other components of the complement system and other forms of mucins were all identified in differ- ent forms of cancer and in OSCC as well [36,52].
As for the involvement of cytochrome c, it was shown that the HIF-1a-dependent suppression of hypoxia-induced apoptosis in OSCC happens through the inhibition of cytochromecrelease [53].
Examination of the level of selected proteins by ELISA
Many of the studies published in the scientific litera- ture are based on shotgun proteomics experiments.
Only few of the proteins listed in Table2were verified
or validated either using SRM-based targeted or anti- body-based methods. Considering the proteins present only in OSCC based on our shotgun experiments, the data presented in the literature, and the availability of antibodies, SERPIND1 and C5 were selected for fur- ther studies. To test the utility of potential biomarkers identified in Asia for a European population, resistin reported to be a potential biomarker for OSCC in Tai- wan [23] was also selected.
The concentrations of C5, SERPIND1, and resistin were examined in the saliva of patients with OSCC, MCTL, and YCTL using quantitative sandwich ELISA kits (Fig.3). In the case of C5, the difference was significant but only when YCTL and patients with OSCC or YCTL and MCTL were compared, indicat- ing that the level of C5 was age-dependent or it was influenced by other factors. One such factor can be the inflammatory status related to poor oral hygiene often
(A)
(C)
(B)
SERPIND1 concentration (ng·mL–1) Resistin concentration (ng·mL–1)
C5 concentration (ng·mL–1)
OSCC YCTL MCTL
0.0 1.5 3.0 4.56 81 156
P value = 0.79 P value = 0.23
P value = 0.73
OSCC YCTL MCTL
0 1 2 3 4 5 7.5 14.0 20.5
P value = 0.784 P value = 0.48
P value = 1
* P value = 0.026
* P value = 0.021 P value = 0.095
Fig. 3.Examination of potential salivary biomarkers using ELISA. The concentration of SERPIND1 (A), resistin (B), and complement C5 (C) proteins in the saliva samples collected from patients with OSCC, YCTL, and MCTL. ThePvalue is indicated;*refers toP<0.05.
observed in the middle-aged and elderly population in Hungary [54]. This means that despite the differential expression of C5 in the OSCC group, the level of C5 does not discriminate between the target MCTL and the diseased group, and hence, it cannot be used as a biomarker for OSCC.
In the case of resistin and SERPIND1, no signifi- cant differences were found between the groups. Resis- tin was not up- or downregulated according to our shotgun experiments and did not show significant dif- ferences in the ELISA experiments either. In the case of SERPIND1, one possible explanation of the dis- agreement between the shotgun proteomics and ELISA data can be that the low number of samples (three for each group) tested by shotgun proteomics and the high individual variation of the saliva samples collected from the patients may lead to false-positive results.
This outcome highlights the importance of validation of the shotgun proteomics data on larger patient cohorts to decrease the false positivity of biomarker identifications. In a two-stage experimental approach, starting with a shotgun proteomics experiment, the level of resistin was found to be significantly higher in the saliva samples of patients with OSCC compared to controls. However, following ELISAs showed that the median values in the OSCC group were only slightly elevated compared to the control group [23]. In the same study, SERPIND1 was not validated but was shown to be upregulated in the saliva samples of patients with OSCC. In our study, a similar experi- mental setup was applied; in the shotgun experiment, the level of SERPIND1 was higher but the level of resistin did not change markedly in the OSCC group, and the validation of SERPIND1 and resistin shows that none of them turned to be useful potential biomarkers. The fact that resistin was identified as a biomarker for OSCC in Taiwan but not in Hungary gives further evidence for the importance of regional studies highlighted in our previous work [55].
Conclusions
Global analysis of salivary samples from patients with OSCC and controls contributes to the better understanding of the disease, including the interaction of tumor cells with their environment and the influ- ence of cancer lesion on salivary protein ecology.
Salivary proteins, characterizing patients with OSCC in this study, highlighted the importance of networks involving the immune system and proteolysis in this disease. Six proteins were only detected in OSCC samples by proteomics analyses and two of them were further examined using ELISA, but none of the
proteins turned to be a potential biomarker in OSCC in our study group. The fact that resistin was shown to be a possible biomarker in Taiwan but not in our study highlights the importance of regional or popu- lation-tailored studies.
Acknowledgements
This work was supported by the Janos Bolyai Research Scholarship of the Hungarian Academy of Sciences, Hungarian Scientific Research Fund OTKA K105034;
TAMOP-4.2.2.D-15/1/KONV-2015-0016 project imple- mented through the New Szechenyi Plan cofinanced by the European Social Fund; and the National Research, Development and Innovation Office [GINOP-2.3.2-15- 2016-00020 and GINOP-2.3.2-15-2016-00001]. The work of Kamilla Solyom and Janosne Toth is greatly acknowledged.
Author contributions
IM, EC, and CK designed the experiments; IM and JN performed stomatologic examination of patients;
BM and ZD carried out the experiments; BM, ZD, and EC evaluated the data and wrote the manuscript;
BM, ES, and EC prepared the figures and tables; and JT, KM, CK, and IM reviewed the manuscript.
References
1 Massano J, Regateiro FS, Januario G and Ferreira A (2006) Oral squamous cell carcinoma: review of prognostic and predictive factors.Oral Surg Oral Med Oral Pathol Oral Radiol Endod102, 67–76.
2 Argiris A, Karamouzis MV, Raben D and Ferris RL (2008) Head and neck cancer. Lancet 371,
1695–1709.
3 Gandini S, Botteri E, Iodice S, Boniol M, Lowenfels AB, Maisonneuve P and Boyle P (2008) Tobacco smoking and cancer: a meta-analysis.Int J Cancer122, 155–164.
4 Bagnardi V, Blangiardo M, La Vecchia C and Corrao G (2001) A meta-analysis of alcohol drinking and cancer risk.Br J Cancer85, 1700–1705.
5 Rosenquist K (2005) Risk factors in oral and
oropharyngeal squamous cell carcinoma: a population- based case-control study in southern Sweden.Swed Dent J Suppl,179, 1–66.
6 Suba Z, Mihalyi S, Takacs D and Gyulai-Gaal S (2009) Oral cancer: morbus Hungaricus in the 21st century.
Fogorv Sz102, 63–68.
7 Torre LA, Bray F, Siegel RL, Ferlay J, Lortet-Tieulent J and Jemal A (2015) Global cancer statistics, 2012.CA Cancer J Clin65, 87–108.
8 Myers JN, Elkins T, Roberts D and Byers RM (2000) Squamous cell carcinoma of the tongue in young adults:
increasing incidence and factors that predict treatment outcomes.Otolaryngol Head Neck Surg122, 44–51.
9 Garavello W, Bertuccio P, Levi F, Lucchini F, Bosetti C, Malvezzi M, Negri E and La Vecchia C (2010) The oral cancer epidemic in central and eastern Europe.Int J Cancer127, 160–171.
10 Santosh ABR, Jones T and Harvey J (2016) A review on oral cancer biomarkers: understanding the past and learning from the present.J Cancer Res Ther12, 486–492.
11 Sparano A, Weinstein G, Chalian A, Yodul M and Weber R (2004) Multivariate predictors of occult neck metastasis in early oral tongue cancer.Otolaryngol Head Neck Surg131, 472–476.
12 Shpitzer T, Hamzany Y, Bahar G, Feinmesser R, Savulescu D, Borovoi I, Gavish M and Nagler RM (2009) Salivary analysis of oral cancer biomarkers.Br J Cancer101, 1194–1198.
13 Shpitzer T, Bahar G, Feinmesser R and Nagler RM (2007) A comprehensive salivary analysis for oral cancer diagnosis.J Cancer Res Clin Oncol133, 613–617.
14 Sannam Khan R, Khurshid Z, Akhbar S and Faraz Moin S (2016) Advances of salivary proteomics in oral squamous cell carcinoma (OSCC) detection: an update.
Proteomes4, 41.
15 Shah FD, Begum R, Vajaria BN, Patel KR, Patel JB, Shukla SN and Patel PS (2011) A review on salivary genomics and proteomics biomarkers in oral cancer.
Indian J Clin Biochem26, 326–334.
16 Winck FV, Prado Ribeiro AC, Ramos Domingues R, Ling LY, Ria~no-Pachon DM, Rivera C, Brand~ao TB, Gouvea AF, Santos-Silva AR, Coletta RDet al.(2015) Insights into immune responses in oral cancer through proteomic analysis of saliva and salivary extracellular vesicles.Sci Rep5, 16305.
17 Cs}oszE, Kall o G, Markus B, Deak E, Csutak A and T}ozser J (2017) Quantitative body fluid proteomics in medicine—A focus on minimal invasiveness.
J Proteomics153, 30–43.
18 Yoshizawa JM, Schafer CA, Schafer JJ, Farrell JJ, Paster BJ and Wong DTW (2013) Salivary biomarkers:
toward future clinical and diagnostic utilities.Clin Microbiol Rev26, 781–791.
19 Nagler R, Bahar G, Shpitzer T and Feinmesser R (2006) Concomitant analysis of salivary tumor markers–a new diagnostic tool for oral cancer.Clin Cancer Res12, 3979–3984.
20 Schulz BL, Cooper-White J and Punyadeera CK (2013) Saliva proteome research: current status and future outlook.Crit Rev Biotechnol33, 246–259.
21 Grassl N, Kulak NA, Pichler G, Geyer PE, Jung J, Schubert S, Sinitcyn P, Cox J and Mann M (2016)
Ultra-deep and quantitative saliva proteome reveals dynamics of the oral microbiome. Genome Med 8, 44.
22 Hu S, Arellano M, Boontheung P, Wang J, Zhou H, Jiang J, Elashoff D, Wei R, Loo JA and Wong DT (2008) Salivary proteomics for oral cancer biomarker discovery.Clin Cancer Res14, 6246–6252.
23 Wu C-C, Chu H-W, Hsu C-W, Chang K-P and Liu H-P (2015) Saliva proteome profiling reveals potential salivary biomarkers for detection of oral cavity squamous cell carcinoma.Proteomics15, 3394–3404.
24 Yu J-S, Chen Y-T, Chiang W-F, Hsiao Y-C, Chu LJ, See L-C, Wu C-S, Tu H-T, Chen H-W, Chen C-Cet al.
(2016) Saliva protein biomarkers to detect oral squamous cell carcinoma in a high-risk population in Taiwan.Proc Natl Acad Sci113, 11549–11554.
25 Bradford MM (1976) A rapid and sensitive method for the quantitation of microgram quantities of protein utilizing the principle of protein-dye binding.Anal Biochem72, 248–254.
26 Guan S, Price JC, Prusiner SB, Ghaemmaghami S and Burlingame AL (2011) A data processing pipeline for mammalian proteome dynamics studies using stable isotope metabolic labeling.Mol Cell Proteomics10, M111.010728.
27 Saldanha Alok J (2004) Java Treeview—extensible visualization of microarray data.Bioinformatics20, 3246–3248.
28 Szklarczyk D, Morris JH, Cook H, Kuhn M, Wyder S, Simonovic M, Santos A, Doncheva NT, Roth A, Bork Pet al.(2017) The STRING database in 2017: quality- controlled protein-protein association networks, made broadly accessible.Nucleic Acids Res45, D362–D368.
29 Szklarczyk D, Franceschini A, Wyder S, Forslund K, Heller D, Huerta-Cepas J, Simonovic M, Roth A, Santos A, Tsafou KPet al.(2015) STRING v10:
protein-protein interaction networks, integrated over the tree of life.Nucleic Acids Res43, D447–D452.
30 Li S-J, Peng M, Li H, Liu B-S, Wang C, Wu J-R, Li Y-X and Zeng R (2009) Sys-BodyFluid: a systematical database for human body fluid proteome research.
Nucleic Acids Res37, D907–D912.
31 Swaak AJ, Visch LL and Zonneveld A (1988) Diagnostic significance of salivary levels of beta 2- microglobulin in Sj€ogren’s syndrome.Clin Rheumatol7, 28–34.
32 Guo T, Rudnick PA, Wang W, Lee CS, DeVoe DL and Balgley BM (2006) Characterization of the human salivary proteome by capillary isoelectric focusing/
nanoreversed-phase liquid chromatography coupled with ESI-tandem MS.J Proteome Res5, 1469–1478.
33 Rossetti DV, Martelli C, Longhi R, Iavarone F, Castagnola M and Desiderio C (2013) Quantitative analysis of thymosinb4in whole saliva by capillary electrophoresis-mass spectrometry using multiple ions
monitoring (CE-MIM-MS).Electrophoresis34, 2674–2682.
34 Morzel M, Chabanet C, Schwartz C, Lucchi G, Ducoroy P and Nicklaus S (2014) Salivary protein profiles are linked to bitter taste acceptance in infants.
Eur J Pediatr173, 575–582.
35 Alves DBM, Bingle L, Bingle CD, Lourenco SV, Silva AA, Pereira DL and Vargas PA (2017) BPI-fold (BPIF) containing/plunc protein expression in human fetal major and minor salivary glands.Braz Oral Res31, e6.
36 Kawahara R, Bollinger JG, Rivera C, Ribeiro ACP, Brand~ao TB, Leme AFP and MacCoss MJ (2016) A targeted proteomic strategy for the measurement of oral cancer candidate biomarkers in human saliva.
Proteomics16, 159–173.
37 Jayakar SK, Loudig O, Brandwein-Gensler M, Kim RS, Ow TJ, Ustun B, Harris TM, Prystowsky MB, Childs G, Segall JEet al.(2017) Apolipoprotein E promotes invasion in oral squamous cell carcinoma.Am J Pathol187, 2259–2272.
38 Chen Y, Azman SN, Kerishnan JP, Zain RB, Chen YN and Wong YL (2014) Identification of host-immune response protein candidates in the sera of human oral squamous cell carcinoma patients.PLoS ONE9, e109012.
39 Jayadeep A, Raveendran Pillai K, Kannan S, Nalinakumari KR, Mathew B, Krishnan Nair M and Menon VP (1997) Serum levels of copper, zinc, iron and ceruplasmin in oral leukoplakia and squamous cell carcinoma.J Exp Clin Cancer Res16, 295–300.
40 Pro Tung CL, Lin ST, Chou HC, Chen YW, Lin HC, Tung CL, Huang KJ, Chen YJ, Lee YR and Chan HL (2013) Proteomics-based identification of plasma biomarkers in oral squamous cell carcinoma.J Pharm Biomed Anal75, 7–17.
41 Ohara T, Kawashiri S, Tanaka A, Noguchi N, Kitahara H, Okamune A, Kato K, Hase T, Nakaya H and Yoshizawa K (2009) Integrin expression levels correlate with invasion, metastasis and prognosis of oral squamous cell carcinoma.Pathol Oncol Res36, 429–436.
42 Yen CY, Huang CY, Hou MF, Yang YH, Chang CH, Huang HW, Chen CH and Chang HW (2013)
Evaluating the performance of fibronectin 1 (FN1), integrina4b1 (ITGA4), syndecan-2 (SDC2), and glycoprotein CD44 as the potential biomarkers of oral squamous cell carcinoma (OSCC).Biomarkers18, 63–72.
43 Magnussen S, Rikardsen OG, Hadler-Olsen E, Uhlin- Hansen L, Steigen SE and Svineng G (2014) Urokinase plasminogen activator receptor (uPAR) and
plasminogen activator inhibitor-1 (PAI-1) are potential predictive biomarkers in early stage oral squamous cell carcinomas (OSCC).PLoS ONE9, e101895.
44 de Carvalho Fraga CA, Farias LC, Jones KM, Batista de Paula AM and Guimaraes ALS (2017)
Angiotensin-converting enzymes (ACE and ACE2) as potential targets for malignant epithelial neoplasia:
review and bioinformatics analyses focused in oral squamous cell carcinoma.Protein Pept Lett 24, 784–792.
45 Shiiba M, Nomura H, Shinozuka K, Saito K, Kouzu Y, Kasamatsu A, Sakamoto Y, Murano A, Ono K, Ogawara Ket al.(2010) Down-regulated expression of SERPIN genes located on chromosome 18q21 in oral squamous cell carcinomas.Oncol Rep24, 241–249.
46 Xia W, Lau YK, Hu MC, Li L, Johnston DA, Sheng S, El-Naggar A and Hung MC (2000) High tumoral maspin expression is associated with improved survival of patients with oral squamous cell carcinoma.
Oncogene19, 2398–2403.
47 Kocsis J, Meszaros T and Madaras B (2011) High levels of acute phase proteins and soluble 70 kDa heat shock proteins are independent and additive risk factors for mortality in colorectal cancer.Cell Stress
Chaperones16, 49–55.
48 Daly M, O’Meara A and Hallinan FM (1987) Identification and characterization of a new antithrombin III familial variant (AT Dublin) with possible increased frequency in children with cancer.Br J Haematol65, 457–462.
49 Cui T, Chen Y, Knosel T, Yang L, Zoller K, Galler K, Berndt A, Mihlan M, Zipfel PF and Petersen I (2011) Human complement factor H is a novel diagnostic marker for lung adenocarcinoma.Int J Oncol39, 161–168.
50 Riihil€a PM, Nissinen LM, Ala-aho R, Kallajoki M, Grenman R, Meri S, Peltonen S, Peltonen J and K€ah€ari V (2014) Complement factor H: a biomarker for progression of cutaneous squamous cell carcinoma.
J Invest Dermatol134, 498–506.
51 Li G, Da M, Zhang W, Wu H, Ye J, Chen J, Ma L, Gu N, Wu Y and Song X (2016) Alteration of serum lipid profile and its prognostic value in head and neck squamous cell carcinoma.J Oral Pathol Med45, 167–172.
52 Li P, Xiao LY and Tan H (2015) Muc-1 promotes migration and invasion of oral squamous cell
carcinoma cells via PI3K-Akt signaling.Int J Clin Exp Pathol8, 10365–10374.
53 Sasabe E, Tatemoto Y, Li D, Yamamoto T and Osaki T (2005) Mechanism of HIF-1a-dependent suppression of hypoxia-induced apoptosis in squamous cell carcinoma cells.Cancer Sci96, 394–402.
54 Banoczy J and Rig o O (1991) Prevalence study of oral precancerous lesions within a complex screening system in Hungary.Community Dent Oral Epidemiol19, 265–267.
55 Cs}oszE, L abiscsak P, Kallo G, Markus B, Emri M, Szabo A, Tar I, T}ozser J, Kiss C and Marton I (2017) Proteomics investigation of OSCC-specific salivary biomarkers in a Hungarian population highlights the importance of identification of population-tailored biomarkers.PLoS ONE12, e0177282.
Supporting information
Additional Supporting Information may be found online in the supporting information tab for this article:
Table S1. List of identified proteins.