Spanish validation of the Sexual Addiction Screening Test
JESÚS CASTRO-CALVO1,2*, RAFAEL BALLESTER-ARNAL1, JOEL BILLIEUX2, BEATRIZ GIL-JULIÁ3and MARÍA DOLORES GIL-LLARIO4
1Salusex-Unisexsida, Departamento de Psicología Básica, Clínica y Psicobiología, Facultad de Ciencias de la Salud, Universitat Jaume I, Castell´on, Spain
2Addictive and Compulsive Behaviours Lab, Institute for Health and Behaviour, University of Luxembourg, Esch-sur-Alzette, Luxembourg
3Departamento de Personalidad, Evaluaci´on y Tratamientos Psicol´ogicos, Universitat de València, Estudi General, Spain
4Departamento de Psicología Evolutiva y de la Educaci´on, Universitat de València, Estudi General, Spain (Received: March 11, 2018; revised manuscript received: May 22, 2018; accepted: May 28, 2018)
Background and aims: Sexual addiction is a pathological behavior characterized by a combination of excessive sexual desire and impaired ability to control it. Its incidence ranges between 1.2% and 32.2%, although this number may vary depending on the screening tool used. This wide variability is largely due to the use of non-validated instruments (e.g., structural validity relying on exploratory analyses, instruments translated without an additional validation process, or instruments validated in another format). To deal with these limitations, this study tested the psychometric properties of the Spanish paper-and-pencil and online versions of the Sexual Addiction Screening Test (SAST).Methods:A total of 2,528 participants (1,163 males) completed the Spanish version of the SAST, along with other instruments assessing sexual compulsivity (1,585=paper-and-pencil, 943=online).Results:The exploratory factor analysis yielded a four-factor structure explaining 57.39% of the variance for the SAST paper-and-pencil version. This factor structure was then verified for the online version through the use of confirmatory factor analysis [χ2(264)=441.59;χ2/df=1.66; RMSEA=0.02; CFI=0.94; IFI=0.94]. This methodology was also used to support measurement invariance (configural, metric, and scalar invariance) according to gender. The reliability of the total score ranged from .82 to .85. Similarly, correlations with related scales were positive and significant (rbetween .22 and .71). Temporal stability 1 year after thefirst application was 0.65 (paper-and-pencil format) and 0.60 (online version).Conclusion:These results, together with the absence of questionnaires translated into Spanish to assess this construct, justify the use of the SAST in the evaluation of sexual addiction in Spanish-speaking countries.
Keywords: Sexual Addiction Screening Test (SAST), Spanish validation, psychometric properties, compulsive sexual behavior, hypersexuality
INTRODUCTION
Sex addiction (also called sexual compulsivity or hypersex- uality) is a pathological behavior characterized by a combi- nation of excessive sexual desire – expressed through normophilic fantasies, impulses, and/or sexual behaviors– and impaired ability to control it (Kafka, 2013; Walters, Knight, & Långström, 2011). The most common manifesta- tions include compulsive masturbation, abusive use of online sexual activities (e.g., pornography or sexual web- cams), incessant search for new sexual partners, and/or compulsive sex with a stable partner (Karila et al., 2014;
Wéry et al., 2016). According to McBride, Reece, and Sanders (2008), compulsive sexual behavior is functionally impairing and has a negative impact on various aspects of daily living (e.g., medical, financial, legal, psychological, social, and spiritual). Couple problems are commonly reported (present in 56.2% of these patients; Spenhoff, Kruger, Hartmann, & Kobs, 2013) along with various psychological problems (e.g., poor self-esteem, negative affect, guilt, and shame) (Reid, Harper, & Anderson, 2009).
Although no consensus exists regarding the conceptualiza- tion of sex addiction (Wéry & Billieux, 2017), common criteria used to diagnose this pathological behavior include (a) exces- sive time and effort spent on sexual activity; (b) impaired self- control; (c) systematic failure to fulfill family, social, or work responsibilities; and (d) persistence in the sexual behavior despite its consequences. Inspired by the criteria used in substance-use disorders, some authors include tolerance, absti- nence, and craving as common symptoms among individuals with sexual addiction (Allen, Kannis-Dymand, & Katsikitis, 2017;Rosenberg, Carnes, & O’Connor, 2014). However, the applicability of these criteria to behavioral addictions is still under debate (King, Herd, & Delfabbro, 2017;Starcevic, 2016).
Based on screening scales, the prevalence of excessive sexual behavior ranges from 3% to 17.4% in men and from
* Corresponding author: Jesús Castro-Calvo; Salusex-Unisexsida, Departamento de Psicología Básica, Clínica y Psicobiología, Facultad de Ciencias de la Salud, Universidad Jaume I, s/n Vicent Sos Baynat, Castell´on de la Plana 12071, Spain; Phone: +34 964 729709; Fax: +34 964 729267; E-mail:castro@uji.es
This is an open-access article distributed under the terms of theCreative Commons Attribution-NonCommercial 4.0 International License, which permits unrestricted use, distribution, and reproduction in any medium for non-commercial purposes, provided the original author and source are credited, a link to the CC License is provided, and changes–if any–are indicated.
FULL-LENGTH REPORT Journal of Behavioral Addictions 7(3), pp. 584–600 (2018)
DOI: 10.1556/2006.7.2018.57
1.2% to 32.2% in women (Odlaug et al., 2013; Odlaug &
Grant, 2010; Rettenberger, Klein, & Briken, 2015;Seegers, 2003). These wide ranges reflect the enormous variability in available screening scales and call for caution when using such instruments as diagnostic tools. In a review of the main instruments used to assess sex addiction symptoms, Hook, Hook, Davis, Worthington, and Penberthy (2010) point out some of the problems that compromise the reliability of the existing screening scales. One problem that the authors highlighted is reliance on non-validated instruments (e.g., structural validity based only on exploratory analyses, instruments translated without an additional validation pro- cess, or instruments validated in another format). Another problem is that few screening scales establish empirically based cut-off points to identify individuals with a clinically relevant problem (Miner, Raymond, Coleman, & Swinburne Romine, 2017). Notably, each screening scale is derived from a specific conceptualization (e.g., addictive disorder and obsessive–compulsive disorder), which further emphasizes the current conceptual chaos and hinders the strict comparison of available studies (Karila et al., 2014). An increasing number of scholars agree that sexual addiction, in terms of manifesta- tion and etiology, is equivalent to substance addiction (Potenza, Gola, Voon, Kor, & Kraus, 2017); however, experts still believe that more research is needed to understand how central features of addiction are expressed in the clinical picture of sex addiction and compulsivity (Kor, Fogel, Reid, & Potenza, 2013; Kraus, Voon, & Potenza, 2016).
Similarly, the current beta draft of the International Classifi- cation of Diseases (ICD-11; World Health Organization, 2018) is now considering the inclusion of compulsive sexual behavior disorder as an impulse control disorder (Kraus et al., 2018), a category intimately linked to other “behavioral addictions,” such as gambling or gaming disorder (Grant et al., 2014; Potenza et al., 2017). For this reason, it is reasonable to further validate scales aligned to the current conceptualization of excessive sexual behavior.
Another important issue pertains to the limited diagnostic convergence of existing screening tools. Castro-Calvo, Ballester-Arnal, and Gil-Llario (2015) conducted a study in which three sexual addiction screening scales were adminis- tered to 600 Spanish youths. Their results revealed high correlations between scales (rbetween .529 and .732) but the diagnostic convergence was, at best, 46.3%. One potential explanation for thesefindings is the lack of systematic valida- tion (in this case in Spanish) of available scales to measure excessive sexual behaviors. Similarly, Wéry et al. (2016) found that 95.8% of a sample of self-identified sexually addicted patients seeking treatment in an outpatient clinic met the criteria for the diagnosis of sexual addiction according to the SAST, whereas this percentage dropped to 56.9% and 52.8%
when other diagnostic criteria were applied. Conjointly, these results are in line with the view that traditional screening tools targeting excessive and addictive behaviors frequently produce false-positive cases (Maraz, Király, & Demetrovics, 2015).
Language limitations are especially relevant, given the scarcity of instruments to assess sexual impulse control in languages other than English (Andreassen, Pallesen, Griffiths, Torsheim, & Sinha, 2018; Klein, Rettenberger, Boom, & Briken, 2014;Scanavino et al., 2016). Only 2 of 32 scales cited by Womack, Hook, Ramos, Davis, and
Penberthy (2013) in their review of hypersexual behavior assessment questionnaires had an adapted and validated version in Spanish: the Sexual Compulsivity Scale (SCS;
Ballester-Arnal, G´omez-Martínez, Gil-Llario, & Salmer´on- Sánchez, 2013) and the Internet Sex Screening Test (ISST;
Ballester-Arnal, Gil-Llario, G´omez-Martínez, & Gil-Julià, 2010). Similarly, most contemporary studies recruit and evaluate their participants through the Internet, without con- sidering that the factorial structure, reliability, and scores obtained in the online administration of a questionnaire are not necessarily equivalent to those of the questionnaire’s classic paper-and-pencil format (Alfonsson, Maathz, & Hursti, 2014; Weigold, Weigold, Drakeford, Dykema, & Smith, 2016). Increasing acknowledgement of this limitation has led to the recent publication of a meta-analysis that examines the psychometric characteristics of the most often used online instruments for clinical assessment (van Ballegooijen, Riper, Cuijpers, van Oppen, & Smit, 2016). Nevertheless, compara- ble data are lacking in thefield of sex addiction, despite the fact that most recent studies are conducted online (Graham, Walters, Harris, & Knight, 2016;Jardin et al., 2017;Jerome, Woods, Moskowitz, & Carrico, 2016; Parsons, Rendina, Ventuneac, Moody, & Grov, 2016;Štulhofer, Jurin, & Briken, 2016;Vaillancourt-Morel et al., 2016).
LIMITATIONS OF PREVIOUS STUDIES
In consideration of these limitations, the main objective of this study was to test the psychometric properties of a Spanish paper-and-pencil and online version of one of the most frequently used scales for the screening of sex addiction: the SAST (Carnes, 1983). This scale was devel- oped to measure excessive sexual behaviors as a behavioral addiction and comprises items recycled from substance abuse disorders to measure symptoms, such as withdrawal, tolerance, or craving. Its use is largely disseminated in clinical and research contexts, and it has been validated in several languages, such as Portuguese (Silveira, Vieira, Palomo, & Silveira, 2000) and Polish (Gola et al., 2017), but to date, not in Spanish.
Although this instrument and its different versions have been successfully used in research conducted with commu- nity samples (Opitz, Tsytsarev, & Froh, 2009), university students (Giordano, Cashwell, Lankford, King, & Henson, 2017;Seegers, 2003;Tripodi et al., 2015), at-risk samples (injection drug users, women who are at sexual risk, men who have sex with men, etc.; Storholm, Fisher, Napper, Reynolds, & Halkitis, 2011), war veterans (Nelson &
Oehlert, 2008), health professionals (Spickard, Swiggart, Manley, & Dodd, 2002), sex addicts (Blankenship &
Laarser, 2004; Carnes, Hopkins, & Green, 2014; Weiss, 2004;Wéry et al., 2016), patients with substance-use dis- orders (Hartman, Ho, Arbour, Janice, & Lawson, 2012;
Stavro et al., 2013), and forensic samples (Hueppelsheuser, Crawford, & George, 1997; Marshall & Marshall, 2010;
Marshall, Marshall, Moulden, & Serran, 2008), available psychometric data have provided mixed results (in particu- lar, regarding factorial structure). More precisely, the origi- nal validation of the SAST found a one-factor solution that accounted for 50% of the scale variance (Carnes, 1983) and
was later replicated through exploratory factor analysis (EFA) in two independent samples (Marshall & Marshall, 2007;Nelson & Oehlert, 2008); nevertheless, both replica- tion studies were limited in terms of sample size, sample representativeness, and statistical analysis [in both cases, a classic EFA approach was carried out instead of an EFA based on the polychoric correlation matrix or a confirmatory factor analysis (CFA)]. Furthermore, recent studies have failed to replicate this original factorial structure. For exam- ple, in a study performed by the original authors of the SAST in a sample that was similar to that of the initial validation study (783 heterosexual sex addicts; Carnes, Green, & Carnes, 2010), a principal component analysis of the SAST (again, a classic and unsuitable EFA strategy for dichotomous data analysis) produced a four-factor solu- tion that accounted for 44.08% of the scale variance.
Marshall and Marshall (2010) also obtained a four-factor solution when they assessed the psychometric properties of the SAST in a sample of 231 incarcerated sexual offenders and age-matched non-offenders; however, item distribution and subscale content considerably differed from that obtained by Carnes et al. (2010). Furthermore, a critical review of item clustering revealed inconsistences in this factor solution, such as the inclusion of sexual preoccupa- tion symptoms in both thefirst and the second factors or the presence of two factors composed of only one item.
Similarly, a recent review about the psychometric properties of the SAST (Montgomery-Graham, 2017) showed that this instrument was appropriate in terms of its internal consistency, but the data on its validity and generalizability were inadequate. Finally, none of the studies performed so far evaluated the temporal consis- tency of the SAST, the equivalence of the factorial solu- tion in men and women, or the psychometric properties of its online application. Accordingly, the specific goals of the current study were to (a) adapt the SAST from English to Spanish; (b) explore its psychometric properties (factor structure, internal consistency, test–retest stability, and convergent validity); (c) test the goodness of fit of the SAST paper-and-pencil factorial solution during its online administration; and (d) analyze the metric and structural invariance according to gender.
METHODS
Participants
The study sample included 2,528 participants distributed into two samples. Thefirst sample (paper-and-pencil group) included 1,585 participants (683 males and 902 females).
Their age ranged between 18 and 27 years (M=20.58;
SD=24.21). The second sample (online group) included 943 participants (480 males and 463 females) aged between 18 and 40 years (M=24.21; SD=5.49). All participants were from Spain. Table 1 shows participants’ character- istics for each group. The only differences between the paper-and-pencil and online groups were related to age (d=0.86), sexual orientation (V=0.31), and lifetime sex- ual intercourse (V=0.21). In these cases, differences be- tween groups reached a medium to large effect size.
Procedure
Following questionnaire translation guidelines (Harkness, Penell, & Schoua-Glusberg, 2004), we completed English to Spanish translation of the SAST using group methodology.
Four members of the research team with experience in translation and validation of questionnaires, as well as in the study of sexual behaviors, performed independent trans- lations. The various versions were then compared so that the research team could agree on a preliminary version of the questionnaire. This version was then back-translated into English by a bilingual researcher familiar with sexual terminology who had not worked on the previous translation step, and it was compared with the original English scale.
After translation discrepancies were resolved, afinal version of the SAST was administered to 30 young people to determine whether the items were well understood. After several improvements were made in accordance with the participants’ suggestions, the final version was ready (TableA1 in the Appendix).
In the paper-and-pencil group, assessment instruments were administered at information desks located at the main entrance of different higher education centers. Students were asked to voluntarily collaborate with this research. Those who agreed anonymously provided informed consent and the evaluation instruments in paper-and-pencil format. A small percentage of these students were given the opportu- nity to continue collaborating. Those who accepted were asked to provide an e-mail address and a contact phone number. One year later, 200 of these students (100 males and 100 females) were randomly selected to complete the SAST again. In this group, 50% completed the SAST in paper-and-pencil format again and 50% completed it through the ADISEX online platform (http://adiccional sexo.uji.es/). This website offers participants the opportu- nity to undergo a complete evaluation about sexual addic- tion and is accessible through any search engine using terms such as “sexual addictions” and/or “sex addiction assess- ment”(in Spanish). The sample was balanced according to gender and application format (50 males and 50 females completed the paper-and-pencil version of the instrument and the other 50 males and 50 females the online version). The purpose of this test–retest procedure was to cross-validate and verify test–retest stability between the two assessment methods.
In the online study, the SAST and the remaining ques- tionnaires were administered through the ADISEX online platform. To enrich the profile and increase the number of users who went through with the evaluation, we initiated a campaign with the Facebook advertising system (suggested publications) to request collaboration in a research study. The specific objective of the investigation was not mentioned so as not to bias the sampling process. The information provided referred only to the fact that this was a study on sexual behavior. The campaign was focused on young people be- tween 18 and 30 years of age, so that the profiles would correspond to those in the study in the paper-and-pencil format.
The data derived from the online platform were processed to avoid duplicitous responses, and only those participants who completed at least 85% of the assessment tools (considered
“motivated participants”) were included in the study.
Instruments used in both paper-and-pencil and online groups
Sexual Addiction Screening Test (SAST;Carnes, 1983).The SAST is a 25-item scale designed to screen for the presence of addictive sexual behaviors and symptoms. It assesses, among other things, sexual preoccupation (e.g.,“Do you oftenfind yourself preoccupied with sexual thoughts?”), signs and symptoms of impaired control (“Do you have trouble stop- ping your sexual behavior when you know it is inappropri- ate?”), and problems resulting from sexual behavior (“Has your sexual activity interfered with your family life?”).
Respondents answer each item on a dichotomous scale (yes/no) and the total score on this instrument can range from 0 to 25. Internal consistency has been measured with several samples (sex addicts, community members, sex offenders, college students, and veterans), withαvalues for the total score ranging from .85 to .95 (Womack et al., 2013).
Sexual Compulsivity Scale (SCS;Kalichman et al., 1994), Spanish adaptation (Ballester-Arnal et al., 2013).The SCS is a 10-item scale that assesses obsessive and intrusive sexual thoughts (e.g., “I feel that my sexual thoughts and feelings are stronger than I am”) and out-of-control sexual behaviors (“I sometimes get so horny I could lose control”). Participants rate each item on a 4-point Likert-type scale ranging from 1 (not all like me) to 4 (very much like me). Total scores range from 10 to 40, with higher scores indicating heightened compulsive sexual behavior. The Spanish adaptation of the scale is characterized by a two-factor solution (“interference” and“control”) established through EFA in a sample of parti- cipants with similar characteristics to those included in this study. In the Spanish validation study, the authors reported an internal consistency of .83 and test–retest reliability (1-month interval) of .72. In this study, internal consistency for the SCS total score and its subscales ranged from .73 to .86 in the paper- and-pencil group and from .75 to .87 in the online group.
Hypersexual Behavior Inventory (HBI; Reid, Garos, &
Carpenter, 2011), Spanish adaptation (Ballester-Arnal, Castro-Calvo, Gil-Julià, & Gil-Llario, in press).The HBI is a 19-item Likert-type scale (1=never; 5=very frequent- ly) designed to measure basic dimensions of hypersexuality.
The HBI was originally validated in a male clinical popula- tion (Reid et al., 2011). In this sample, the resulting factor structure replicated the theoretical criteria under which HBI was designed. The first factor obtained, labeled“Coping,” reflected the use of sex in response to dysphoric mood states;
second factor,“Control,”showed problems in controlling or reducing sexual thoughts, urges, and behaviors; and the third factor, “Consequences,”explored the persistence of sexual fantasies, urges, and behaviors, despite their negative con- sequences. The authors obtained strong interrelationships among these factors and the reliability for each scale ranged between .89 and .95. Subsequently, Ballester-Arnal et al. (in press) obtained a similar factorial structure (threefirst-order factors grouped under a second-order factor) through a CFA in a sample of 2,250 participants between 18 and 40 years old, also demonstrating that the HBI is equally applicable in men and women without changes in its factorial structure (metric and configural invariance). In the Spanish validation study, the authors reported an internal consistency of be- tween .82 and .93 for the total score and the subscales. In this study, reliability for the overall scale and subscales ranged from .82 to .92 for the paper-and-pencil group and from .86 to .94 for the online group.
Instruments used only in online group
Sexual Sensation Seeking Scale (SSS; Kalichman et al., 1994), Spanish adaptation (Ballester-Arnal, Ruiz-Palomino, Espada-Sánchez, Morell-Mengual, & Gil-Llario, 2018).The SSS is an 11-item scale rated on a 4-point Likert scale that ranges from 1 (not at all like me) to 4 (very much like me).
Table 1.Sample characteristics for each group
Paper-and-pencil group (n=1,585) Online group (n=943)
Effect size
% orM(SD) % orM(SD)
Demographics
Sex (male) 43.1 50.9
V=0.07
Sex (female) 56.9 49.1
Age 20.58 (2.17) 24.21 (5.49) d=0.86
Steady partner (yes) 52.1 57.43 V=0.09
Religious beliefs (atheist) 55 73.1
V=0.18
Religious beliefs (practicing believer) 39 21.5
Religious beliefs (non-practicing believer) 6 5.4
Sexual orientation (heterosexual) 92.2 68.4
V=0.31
Sexual orientation (bisexual) 3.3 15.6
Sexual orientation (homosexual) 4.6 16
Sexual behavior
Lifetime sexual intercourse (yes) 96.6 80 V=0.21
Same-sex sexual intercourse (yes) 14.8 29.7 V=0.15
Masturbation (yes) 87 94.4 V=0.12
Mutual masturbation (yes) 89.9 88.9 V=0.01
Oral sex (yes) 90.6 79.4 V=0.13
Vaginal intercourse (yes) 90.4 89.5 V=0.01
Anal intercourse (yes) 36.4 53 V=0.15
Note. SD: standard deviation.
It assesses“the propensity to attain optimal levels of sexual excitement and to engage in novel sexual experiences” (Kalichman et al., 1994, p. 387). Psychometric studies sup- port its use among young people (Gray & Wilson, 2007) and adolescents (Ballester-Arnal et al., 2018). Internal consisten- cy (Cronbach’s α) for this scale was .82 in its Spanish adaptation. In this study, the same Cronbach’sαvalue was obtained (.82).
Internet Addiction Test (IAT;Young, 1998).The IAT is a 20-item scale that assesses the extent to which the respon- dents’ use of the Internet is problematic. Participants re- spond to each question on a 5-point Likert scale that ranges from 1 (rarely) to 5 (always). Summation scores can range from 20 to 100, with higher values indicating a greater likelihood of Internet addiction. The IAT is one of the most widely used scales to assess Internet addiction (Boysan et al., 2017). In a recent study that used the Spanish translation of the scale, reliability indices were robust (α=.91; Castro-Calvo, Ballester-Arnal, Gil-Llario, &
Giménez-García, 2016). In this study, internal consistency for this measure was strong (α=.91).
Internet Sex Screening Test (ISST;Delmonico & Miller, 2003), Spanish adaptationBallester-Arnal et al., 2010).The ISST evaluates the degree to which the online sexual behav- ior of a person is, or is not, problematic. Twenty-five items on a dichotomous scale (true/false) provide a total score (ISST- total) ranging from 0 to 25. In addition, the ISST allows estimation of scores on five subscales: loss of control over online sexual behavior and other pathological indicators (ISST-compulsivity), solitary cybersex (ISST-solitary), social cybersex (ISST-social), economic investment in online sex- ual activities (ISST-money), and concerns about the severity of cybersex consumption (ISST-severity). Ballester-Arnal et al. (2010) reported good internal consistency (α=.88) and test–retest stability (r=.82) in a sample of college students between 18 and 25 years old. In this study, internal consistency for the ISST-total score (α=.82) and for each subscale (between .63 and .72) was acceptable.
Data analysis
First, we considered descriptive analyses in relation to sociodemographic and sexual behavior data using the SPSS statistical package (version 24.0). To compare participants’ characteristics in both groups (paper-and-pencil and online format), we performedttests (continuous variables) andχ2 tests (categorical variables). The effect size for these con- trasts was computed using G*Power software (version 3.1);
in particular, we estimated Cohen’sdand Cramer’sV(inχ2 tables, 2×kis equivalent to Cohen’sWindex for effect size;
Sheskin, 2007).
To determine the factorial structure of the SAST, wefirst performed an EFA, considering only the participants in the paper-and-pencil group. FACTOR software (version 9.2) was used to perform the EFA (Lorenzo-Seva & Ferrando, 2013). The main advantage of FACTOR in comparison to other statistical software is the possibility of performing the EFA on the basis of the tetrachoric/polychoric correlation matrix; this option is preferable when modeling dichotomous data (such as in the case of the SAST;Ferrando & Lorenzo- Seva, 2017). We used parallel analysis to determine the
number of factors to extract (Timmerman & Lorenzo-Seva, 2011), and they were extracted through robust diagonally weighted least squares (DWLS), applying an oblique rota- tion (direct oblimin).
Subsequently, a CFA was performed with the partici- pants of the online group. The adjustment of three factorial models was compared and a multigroup CFA was per- formed to test the hypothesis of measurement invariance (configural, metric, and scalar) according to gender. The software used to perform these analyses was EQS 6.2. The normality violation was corrected using robust methods.
The goodness of fit for the different factorial models was analyzed using the following indices: Satorra–Bentler chi- square (χ2), relative chi-square (χ2/df), general model sig- nificance (p), root mean square error of approximation (RMSEA), and comparative and incrementalfit indices (CFI and IFI). An appropriatefit was considered whenχ2was not significant (p>.05),χ2/dfwas between 1 and 2, CFI and IFI were≥0.95, and RMSEA was≤0.05 (Bagozzi & Yi, 2011).
According to less restrictive criteria, values between 2 and 3 for χ2/df, ≥0.90 for CFI and IFI, and ≤0.08 for RMSEA could also be considered acceptable (Hooper, Coughlan, &
Mullen, 2008).
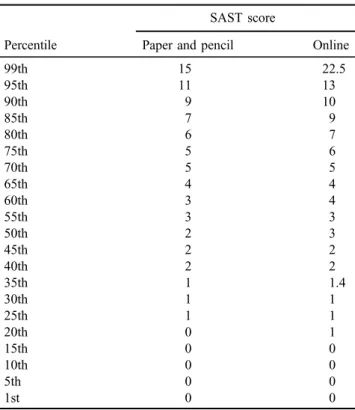
Finally, the general mean score of the items, subscales, and total score of the SAST were explored, as well as the magnitude of the differences according to the application format. Different reliability indices were calculated; in particular, we employed an R package (userfriendly science) (Peters, 2014) to estimate ordinal Cronbach’s α and Ω, Spearman–Brown reliability coefficient (the most appropri- ate reliability statistic for a two-item scale; Eisinga, Grotenhuis, & Pelzer, 2013), item-scale, and item-test cor- relations. We also estimated temporary stability 1 year after the first application. Convergent validity was explored by correlating (Pearson’s r) the SAST total score and its subscales with related measures. Finally, the percentile distribution of the SAST scores was obtained and is includ- ed as additional content in the Appendix (TableA2).
Ethics
The study procedures were carried out in accordance with the Declaration of Helsinki. The Institutional Review Board of the Jaume I University approved the study. Volunteer participants in the research were informed about the study aim and they provided informed consent.
RESULTS
EFA of the SAST: paper-and-pencil group
To verify the applicability of the EFA to the SAST, we calculated the Kaiser–Meyer–Olkin index (0.87) and Bartlett’s test for sphericity [χ2(300)=6,171.70, p<.001]. Through analysis of the anti-image correlation matrix, we also verified the adequacy of the 25 SAST items for EFA (all anti-image correlations >.84). After parallel analysis of the polychoric correlation matrix (Garrido, Abad, & Ponsoda, 2013), we estimated that the appropriate number of factors to be extracted was four (factor eigenvalues>1.17). The factorial
solution derived from the DWLS factor analysis revealed that this four-factor structure explained 57.39% of the total vari- ance of the questionnaire. Table 2includes the standardized factor loadings obtained in the EFA.
Thefirst factor (“loss of control”), which is composed of five items (Items 8, 14, 15, 17, and 21) and has an eigenvalue of 9.43, explained the highest percentage of the variance (37.75%). These items reflect difficulties in controlling and voluntarily resisting impulses, thoughts, and sexual behaviors (e.g., “Have you attempted to stop some parts of your sexual activity?”). With an eigenvalue of 2.04 and 8.17% of explained variance, the second factor (“addiction symptoms”) grouped 11 items (Items 2, 3, 4, 5, 6, 7, 13, 19, 23, 24, and 25). This factor comprises several questions with a common denominator: all of them are related to different symptoms included in the sex addiction clinical picture (e.g.,“Has sex been a way for you to escape your problems?”or“Do you oftenfind yourself preoccu- pied with sexual thoughts?”). The seven items that make up the third factor (“functional impairment”: Items 1, 9, 10, 12, 18, 20, and 22) evaluate the impact of sex addiction on different areas of the patient’s life (“Has your sexual activity interfered with your family life?”). This factor has an eigenvalue of 1.68 and an explained variance of 6.74%.
The fourth factor (“hiding”) integrates the remaining two items (Items 11 and 16) and has a lower eigenvalue (1.18) and percentage of explained variance (4.72%). These items reflect the tendency to conceal one’s own sexual behavior (“Do you have to hide some of your sexual behavior from others?”).
CFA of the SAST: Online group
To assess whether the factor structure of the SAST in the paper-and-pencil format was equivalent in its online appli- cation, we conducted a CFA. For this purpose, the robust maximum likelihood method was applied (a method that allows one to obtain statistics that correct the normality violation). This method is recommended when analyzing categorical variables (Finney & DiStefano, 2013). On the basis of the EFA results, two models were compared:
the first (M1) replicated the factorial structure derived from the EFA (four correlatedfirst-order factors), and the second (M2) proposed grouping the fourfirst-order factors under a second-order factor that explained the shared variance. To compare the accuracy of these models with the original factor structure, we also tested the goodness of fit of a model that replicated the originally proposed Table 2.SAST factorial loadings
Items
Factorial loadings
Factor 1 Factor 2 Factor 3 Factor 4 Factor 1: loss of control
8. Do you ever feel bad about your sexual behavior? 0.48
14. Have you made promises to yourself to quit some aspect of your sexual behavior? 0.78 15. Have you made efforts to quit a type of sexual activity and failed? 0.92 17. Have you attempted to stop some parts of your sexual activity? 0.90 21. Have you felt the need to discontinue a certain form of sexual activity? 0.71 Factor 2: addiction symptoms
2. Have you ever subscribed to or regularly purchased sexually explicit magazines? 0.49
3. Did your parents have trouble with sexual behavior? 0.33
4. Do you oftenfind yourself preoccupied with sexual thoughts? 0.35
5. Do you feel that your sexual behavior is not normal? 0.52
6. Does your spouse [or significant other (s)] ever worry or complain about your sexual behavior?
0.49 7. Do you have trouble stopping your sexual behavior when you know it is
inappropriate?
0.47
13. Are any of your sexual activities against the law? 0.43
19. Has sex been a way for you to escape your problems? 0.44
23. Have you ever been sexual with minors? 0.41
24. Do you feel controlled by your sexual desire? 0.72
25. Do you ever think your sexual desire is stronger than you are? 0.81 Factor 3: functional impairment
1. Were you sexually abused as a child or adolescent? 0.32
9. Has your sexual behavior ever created problems for you or your family? 0.70 10. Have you ever sought help for your sexual behavior that you did not like? 0.24
12. Has anyone been hurt emotionally because of your sexual behavior? 0.33
18. Have you ever felt degraded by your sexual behavior? 0.47
20. When you have sex, do you feel depressed afterward? 0.40
22. Has your sexual activity interfered with your family life? 0.92
Factor 4: hide
11. Have you ever worried about peoplefinding out about your sexual activities? 0.70
16. Do you have to hide some of your sexual behavior from others? 0.82
Note.SAST: Sexual Addiction Screening Test.
one-factor solution (M3). Table 3 shows goodness-of-fit indices for the different models.
As Table3shows, the model with the most satisfactoryfit indices was the second one (M2). In this model, the χ2 Satorra–Bentler value of significance (correctedχ2for sam- ples that did not follow the normality assumption) did not exceed the 0.05 value necessary to consider it a satisfactoryfit for the model. Nevertheless, it has been shown that this statistic is highly conditioned by sample size (Jöreskog &
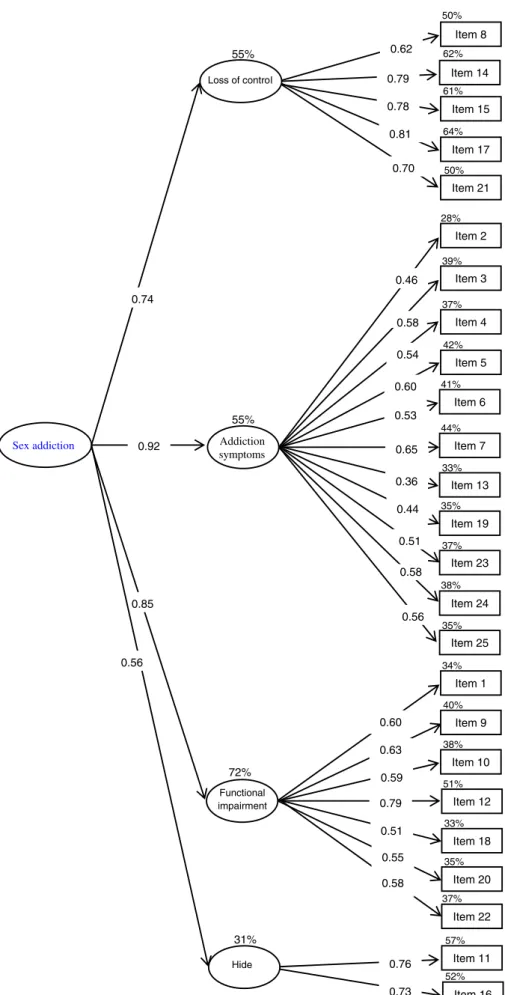
Sörbom, 1993; Markland, 2007), which in this study far exceeds the standard required for this type of analysis (Hair, Black, & Babin, 2010). For this reason, it may be more appropriate to use other indices considered less sensitive to sample size. In this sense, the value of the relativeχ2(χ2/df) was 1.66, with acceptablefit considered to be values below 3 and perfectfit between 1 and 2. The RMSEA was below the 0.05 value required by the strictest criteria to consider a model parsimonious. Finally, the CFI and the IFI reached a value of 0.94, which is very close to the cut-off point established to consider it an excellent fit to the model. Both M1 and M2 were superior to the original one-factor solution (M3). The resulting factorial model (M2) is depicted in Figure 1.
To confirm whether the factor structure of the second model (M2) was applicable to men and women, we per- formed three multigroup CFAs according to gender. In the first, the hypothesis of the factor structure invariance (structural invariance) was tested, whereas in the second, the invariance of the factor loadings (metric invariance) was analyzed. In addition, we tested the hypothesis of the intercepts invariance (scalar invariance). As Table 3 shows, the three models showed an acceptable goodness of fit, although the metric invariance indices were slightly better than the structural and scalar invariance indices.
Specifically, the value of the relativeχ2was in all the cases less than 2 (1.53 and 1.40), the RMSEA value was less than 0.05, and the CFI and IFI indices were equal to or higher than 0.90. These analyses show that the factor structure of the SAST is equivalent in men and women; in addition, factor loadings and items intercepts did not vary signifi- cantly according to gender.
Descriptive data, reliability, and temporal stability of the SAST
Mean scores of the total sample in the SAST items and factors are reported in Table 4. Regarding internal
consistency, ordinal Cronbach’s αand Ω for the majority of the SAST factors and for the total score as well as Spearman–Brown reliability coefficient for factor 4 exceed the criterion established by Hunsley and Mash (2008) to consider the reliability of a scale appropriate. Regard- ing application format, internal consistency indices were slightly higher for the online version (αSAST-Total=.96;
αcontrol=.95; αsymptoms=.91; αfunctional-impairment=.90;
S-Bhiding=.70). Internal consistency was also supported by item-scale (between .26 and .88), item-test (.26 and .68), and scale-test correlations (.57 and .89).
Concerning temporal stability, test–retest correlation 1 year after the first paper-and-pencil application was .65, when the retest was performed in the same format and it was .60 in the online version. The temporal stability of the four factors ranged between .43 and .59 (rpencil_paper-pencil_paper) and between .22 and .62 (rpencil_paper_online). In both cases, the temporal stability was lower in the interference factor (which denotes the sensitivity of this scale over time). All correlations were significant atp<.001.
Convergent validity of the SAST
To determine convergent validity, we correlated SAST-total and subscale scores with instruments used to assess the same construct or similar dimensions (Table 5).
As expected, the correlation between SAST and other sexual addiction screening measures, such as the SCS or the HBI was high, positive, and significant (in all casesr>.22 and significant atp<.001). In addition, online participants completed other scales that also showed high, positive, and significant correlations with the SAST-total and subscale scores. Specifically, the correlations between the SAST and the SSS ranged between .16 and .36 and between .23 and .36 with the IAT. Finally, a small to medium relationship was found between the SAST and the ISST, particularly, with the online sexual compulsivity factor (ISST-compulsivity;
rbetween .28 and .45).
DISCUSSION
The main objective of this study was to adapt and test the psychometric properties of the SAST, one of the most frequently used instruments to screen for sexual addiction.
In this sense, the main conclusion derived from this study is Table 3.Goodness-of-fit indices for the CFA and the multigroup CFA
χ2 df p χ2/df RMSEA CFI IFI
CFA
Model 1 (M1) 471.43 264 <.001 1.78 0.02 0.92 0.93
Model 2 (M2) 441.59 265 <.001 1.66 0.02 0.94 0.94
Model 3 (M3) 1,166.27 274 <.001 4.25 0.06 0.69 0.69
Multigroup CFA
Configural invariance 812.47 528 <.001 1.53 0.03 0.90 0.90
Metric invariance 777.58 553 <.001 1.40 0.03 0.92 0.92
Scalar invariance 875.91 570 <.001 1.53 0.03 0.92 0.92
Note.CFA: confirmatory factor analysis;χ2: Satorra–Bentler chi-square;df: degrees of freedom;p: general model significance;χ2/df: normed chi-square; RMSEA: root mean square error of approximation; CFI: comparativefit index; IFI: incrementalfit index.
0.74
0.92
0.85
0.60 0.63 0.59 0.79 0.51 0.55 0.58 Functional
impairment 72%
Item 1
Item 9
Item 10
Item 12
Item 18
Item 20 Item 22 34%
40%
38%
51%
33%
35%
37%
0.62 0.79 0.78 0.81 0.70 55%
Item 8
Item 14 Item 15
Item 17 Item 21 50%
62%
61%
64%
50%
0.46
0.58 0.54
0.53 0.65 0.36 0.60
Addiction symptoms
55%
Item 2
Item 3
Item 4
Item 6
Item 7
Item 13 Item 5 28%
39%
37%
41%
44%
33%
42%
Item 19
Item 23 35%
37%
Item 24
Item 25 38%
0.56 35%
0.58 0.51 0.44
Hide 0.76
0.73 31%
Item 11 Item 16 57%
52%
0.56 Sex addiction
Loss of control
Figure 1.Confirmatory factor analyses for the SAST (M2).R2is expressed as a percentage outside the main endogenous variables boxes. Coefficients are reported in standardized format. All parameters were significant atp<.001. Error terms are not included in order to
facilitate interpretation
Table4.Total,factoranditemscores,effectsize,andreliabilitycoefficientsforeachgroup Total (n=2,528)
Paperand pencil (n=1,585)Online (n=943)Paper-and-pencilreliabilityOnlinereliability RangeM(SD)M(SD)M(SD)dα(CI)Ω(CI)I-SrI-Trα(CI)Ω(CI)I-SrI-Tr Totalscore(SAST-total)0–253.78(4.01)3.56(3.67)4.15(4.49)0.14.93(0.93,0.94).93(0.93,0.94).96(0.96,0.96).96(0.96,0.96) Factor1:lossofcontrol0–50.74(1.34)0.67(1.26)0.86(1.48)0.13.92(0.92,0.93).93(0.92,0.93).76.95(0.95,0.96).95(0.95,0.96).83 Item80–10.18(0.38)0.17(0.37)0.21(0.40)0.10.68.59.69.68 Item140–10.18(0.38)0.17(0.38)0.19(0.39)0.05.76.55.83.65 Item150–10.12(0.32)0.11(0.30)0.14(0.34)0.09.75.53.80.64 Item170–10.15(0.35)0.13(0.33)0.18(0.37)0.14.78.57.83.66 Item210–10.12(0.32)0.10(0.30)0.16(0.36)0.18.74.57.77.62 Factor2:addictionsymptoms0–111.79(1.93)1.75(1.88)1.86(2.00)0.05.86(0.85,0.87).87(0.86,0.88).87.91(0.90,0.91).91(0.91,0.92).89 Item20–10.50(0.50)0.50(0.50)0.50(0.50)NA.56.47.38.27 Item30–10.03(0.17)0.03(0.16)0.04(0.19)0.05.26.23.34.35 Item40–10.21(0.40)0.21(0.41)0.20(0.40)0.02.56.54.59.55 Item50–10.12(0.32)0.10(0.29)0.16(0.36)0.18.52.48.63.59 Item60–10.10(0.29)0.09(0.29)0.10(0.30)0.03.48.43.57.50 Item70–10.11(0.30)0.11(0.30)0.11(0.30)NA.54.52.62.60 Item130–10.06(0.23)0.07(0.26)0.04(0.19)0.13.38.30.44.41 Item190–10.26(0.44)0.23(0.42)0.32(0.46)0.20.50.42.56.49 Item230–10.11(0.30)0.12(0.32)0.08(0.27)0.12.40.31.44.35 Item240–10.11(0.31)0.11(0.31)0.11(0.31)NA.55.45.62.56 Item250–10.19(0.39)0.18(0.38)0.20(0.40)0.05.65.55.64.56 Factor3:functionalimpairment0–70.57(1.05)0.50(0.91)0.67(1.24)0.15.82(0.80,0.83).82(0.81,0.84).70.90(0.89,0.91).90(0.90,0.91).79 Item10–10.05(0.21)0.02(0.14)0.09(0.29)0.30.33.26.46.30 Item90–10.09(0.28)0.08(0.27)0.10(0.29)0.07.62.44.67.57 Item100–10.05(0.22)0.05(0.22)0.05(0.22)NA.44.29.63.51 Item120–10.18(0.38)0.19(0.39)0.17(0.37)0.05.64.46.65.50 Item180–10.10(0.30)0.09(0.28)0.13(0.33)0.13.60.45.67.52 Item200–10.06(0.23)0.04(0.19)0.09(0.28)0.20.42.32.61.50 Item220–10.04(0.19)0.03(0.17)0.05(0.21)0.10.53.34.60.48 Factor4:hide0–20.67(0.81)0.62(0.78)0.74(0.85)0.14.60a .57.70a .59 Item110–10.37(0.48)0.35(0.47)0.40(0.49)0.10.85.48.88.52 Item160–10.31(0.46)0.28(0.45)0.35(0.47)0.15.84.49.88.51 Note.AccordingtoEisingaetal.(2013),thisisthemostappropriatereliabilitystatisticforatwo-itemscale.SAST:SexualAddictionScreeningTest;I–Sr:correcteditem-scalecorrelation; I–Tr:correcteditem-testcorrelation. a InsteadofordinalCronbach’sαandΩ,reliabilityoffactor4hasbeencalculatedthroughtheSpearman–Brownreliabilityindex.
Table5.CorrelationsbetweentheSASTandtheoreticallyrelatedmeasuresforeachgroup Paper-and-pencilgroupOnlinegroup SAST-totalLossof controlAddiction symptomsFunctional impairmentHideSAST-totalLossof controlAddiction symptomsFunctional impairmentHide SCS(n=2,528) SCS-total.64***.39***.67***.42***.26***.61***.46***.66***.42***.24*** SCS-interference.57***.36***.58***.42***.22***.56***.42***.58***.44***.20*** SCS-control.59***.35***.63***.35***.25***.55***.42***.62***.33***.22*** HBI(n=2,528) HBI-total.70***.71***.71***.46***.31***.71***.61***.67***.48***.41*** HBI-coping.55***.39***.59***.35***.26***.53***.40***.54***.34***.33*** HBI-control.67***.56***.59***.46***.31***.70***.70***.58***.49***.40*** HBI-consequences.65***.37***.71***.41***.26***.62***.50***.61***.43***.31*** SSS(n=943) SSS-total.30***.17***.36***.16***.20*** IAT(n=943) IAT-total.36***.29***.34***.23***.25*** ISST(n=943) ISST-total.46***.38***.43***.27***.41*** ISST-compulsivity.45***.36***.42***.28***.37*** ISST-solitary.36***.28***.35***.19***.37*** ISST-social.27***.18***.26***.19***.22*** ISST-money.15***.08***.16***.13***.08*** ISST-severity.28***.37***.18***.11***.29*** Note:SAST:SexualAddictionScreeningTest;SCS:SexualCompulsivityScale;HBI:HypersexualBehaviorInventory;SSS:SexualSensationSeekingScale;IAT:InternetAddictionTest;ISST: InternetSexScreeningTest. ***p<.001.
that the SAST is a reliable, valid, and effective tool to assess sex addiction symptoms in both genders. The SAST is also characterized by elevated test–retest reliability, and both versions of the scale (paper and pencil and online) present adequate psychometric properties.
Regarding its factor structure, the 25 items of the SAST load in four subscales that are in turn grouped under a higher order factor, labeled generically as “sex addiction.” This higher order factor (which explains between 31% and 72%
of the variance of thefirst-order factors) is the psychometric equivalent to the general diagnostic description of the sex addiction condition, while the four subscales represent the main clusters of symptoms encountered.
Among the four factors,“loss of control”is the one with greater explanatory capacity over the entire questionnaire (37.7% of its variance). Related items assess the capacity to control or voluntarily stop sexual behavior, which is con- sidered the main diagnostic indicator of sex addiction and hypersexuality (Kafka, 2014). Furthermore, it is consistent with one of the main criteria of the ICD-11 in the diagnosis of compulsive sexual behavior disorder: “the person has made numerous unsuccessful efforts to control or significantly reduce repetitive sexual behavior” (Kraus et al., 2018, p. 109).
The second most important factor was“addiction symp- toms” (8.17% of the explained variance), so named because it comprises symptoms usually reported by indi- viduals with addictive behaviors. This factor includes questions about the use of sex as a coping strategy, about some of the most frequent symptoms encountered in the condition (e.g., preoccupation and intrusive thoughts), and about the perceived impairing nature of the sexual behavior itself (e.g., perceiving sexual behavior as abnormal), which constitutes some of the most relevant criteria for its diag- nosis (Kaplan & Krueger, 2010). Among them, the use of sex as a coping mechanism has key clinical relevance according to Kafka’s formulation of a hypersexuality diagnosis (Kafka, 2010,2013).
The “functional impairment” factor is related to the tangible negative consequences resulting from excessive sexual behaviors. Functional impairment represents one of the main criteria for the diagnosis of mental disorders in general. Recent papers have emphasized that in the case of behavioral addictions, which mostly relate to common daily life or leisure activities, this criterion should be central and mandatory to endorse the condition (Billieux et al., 2017;
Kardefelt-Winther et al., 2017). In particular, the seven items of this factor explore two of the six areas in which sex addiction causes a negative impact according to McBride et al. (2008): family (“Has your sexual behavior ever created problems for you or your family?”) and psychological (“When you have sex, do you feel depressed afterward?”). Although it seems too narrow to restrict the screening to two of the six types of negative outcomes, it is also true that it is in the family and personal sphere where the consequences of excessive and problematic sexual behavior tend to be more frequent and serious (Reid et al., 2012;Spenhoff et al., 2013).
Finally, the“Hiding”factor appears especially relevant to sexual addiction, as it is related to symptoms that load on a specific factor. In sexual addictions, it is common for
patients to hide their problem from their partner or relatives, which is also one of the main barriers when seeking specialized therapeutic help (Skegg, Nada-Raja, Dickson,
& Paul, 2010;Winters, Christoff, & Gorzalka, 2010). This is especially relevant in women with sexual addiction, where aspects such as social desirability or peer pressure have been identified as barriers to seeking treatment (Dhuffar &
Griffiths, 2016).
The structural factor shown in this study is not equivalent to those reported in previous psychometric studies, but, to our view, it captures the main components of sexual addic- tion in a more parsimonious and homogeneous way. Indeed, the four-factor solution obtained by Carnes et al. (2010) blends very different aspects of the clinical picture in the same scale (e.g., Factor 1 includes items regarding loss of control over sexual behavior together with personal distress symptoms), whereas it separates related domains (e.g., functional impairment symptoms are scattered across thefirst and third factors). Furthermore, it includes a factor (“associated features”) that groups together three symptoms that, in our opinion, contribute less to the assessment of sexual addiction (e.g., “Did your parents have trouble with sexual behavior?”). Similarly, Marshall and Marshall (2010) stated that the 25 SAST items could be grouped into four clusters: The first cluster mixes four types of symptoms (concerns about being normal, inter- ference, compulsivity, and sexual preoccupations), the content of thefirst and second clusters (once again, sexual preoccupations) is redundant, and the third and fourth clusters comprise a single item. On the other hand, our proposal of a factorial model in which a second-order factor explains the shared variance between thefirst-order scales is compatible with the original one-factor solution proposed by Carnes (1989) and replicated later in two independent samples (Marshall & Marshall, 2007;Nelson
& Oehlert, 2008). Furthermore, it supports the classic conception of sex addiction as a unitary construct (Graham et al., 2016) and the suitability of using a global SAST score as an indicator of general severity.
Regarding psychometric properties, this study demon- strates that the SAST is a reliable and valid screen for sexual addiction. Cronbach’sαandΩof the total score was .93 in the paper-and-pencil format and .96 in the online version.
These values are higher to those obtained in previous validation studies (Montgomery-Graham, 2017). In addi- tion, the SAST scores –especially the total score– were stable 1 year after the initial administration (rbetween .60 and .65), regardless of the format in which the retest was administered. To date, no study has explored the temporal stability of this scale (Montgomery-Graham, 2017) much less for such a long time span. The weaker temporal stability was obtained for the functional impairment construct, which is one of the most sensitive symptoms in the episodic evolution that characterizes the clinical course of this disor- der (Reid et al., 2012). Finally, correlations with the total score of other screening instruments, such as the SCS (r=.64 and .61 in the paper-and-pencil and online group, respectively) or the HBI (rof .70 and .61), as well as other related variables, such as sexual sensation seeking (r=.30), Internet addiction (r=.36), and cybersex addiction (r=.46), support the validity of the SAST.