Morphological and functional changes during accelerated liver regeneration
András Budai M.D.
Semmelweis University
Doctoral School of Clinical Sciences
Supervisor: Attila Szijártó, M.D., Ds.C
Official reviewers: Prof. Attila Oláh, M.D., Ph.D.
Krisztina Hagymási, M.D., Ph.D.
Chair of the Final Examination Committee: György Wéber M.D., Ph.D.
Members of the Final Examination Committee: Andrea Szabó M.D., Ph.D.
Csaba Dávid, Ph.D.
Budapest
2019
1. Introduction
Liver tumours are among the leading death causes in the developing and western world.
Despite immense innovation and research efforts of the last 30 years in oncotherapy, resection of the tumorous tissue with clear margins remains the only truly curative option in the treatment of liver malignancies. Unfortunately, due the hidden nature of liver tumors, majority of the patients require extended hepatectomy due to the developed state of their illnesses. The liver has immense regeneratory reservoir, however, in case of extended hepatectomy this can be depleted and due to the resection of too much functional parenchyma in order to reach R 0 resection. In these cases post-hepatectomy liver failure develops. Due to this, around 45% of patients are primarily unable for resection. In these cases the probability of post-hepatectomy liver failure (PHLF) increases considerably. Thus, majority of patients become unable to resection. Fortunately there were tremendous surgical innovations in the past 30 years to evade PHLF by the increase of the size of the remnant liver. The most notable of these are portal vein embolization (PVE) and portal vein ligation (PVL) of the diseased hemiliver, which induces the hypertrophy of the contralateral liver parts. Portal vein occlusion (PVO) techniques made many patients available for operation yet again, whom have been primarily unavailable due to insufficient liver remnant size or function.
Unfortunately PVO techniques have some significant backdraws as well. They usually require significant amount of time (4-8 weeks) to take effect and cause proper regeneration and hypertrophy. For this, many of the patients will eventually become unfit for curative resection due to disease progression.
The solution to this problem came in 2007, when Hans J. Schlitt discovered ALPPS (Association liver partition and portal vein ligation for staged hepatectomy) by chance, which combines portal ligation and in situ parenchymal transection between the diseased and intact hemilivers. Uniquely with this technique, a significantly accelerated regenerative response can be triggered in the remnant liver, and those cases became treatable, which were unable for surgery due to the sheer size of the tumorous disease or its biological behaviour.
Unfortunately every surgical intervention has side effects and risks. ALPPS bears significantly higher mortality and morbidity rates compared to conventional PVO techniques.
(Even 50% mortality and 79% morbidity rate.) Interestingly, the incidence of PHLF rises significantly when ALPPS is utilized, even, when the remnant liver volume seems sufficient. This was further supported by scintigraphy based investigations This suggests severe functional decline during the accelerated regenerative process.,
Liver regeneration is a very energy dependent process, which is mainly supported by the ATP production of oxidative phosphorylation (OXPHOS). According to the previous investigations one might assume mitochondrial function disorder In the background of functional decline of ALPPS induced liver regeneration. The investigations of the present theses revolve around the modeling, assessment and comparison of functional changes during PVL and ALPPS induced
liver regeneration.
2. Aims
In the first (I) study the assessment and comparison of PVL and ALPPS induced liver regenerations was carried out in order to investigate the mitochondrial background of the high mortality and morbidity rates and the accompanying cellular energetic disorders. The aims of the investigations were the following:
1. Designing a rodent ALPPS model, which simulates the human scenario both in anatomical and physiological manner.
2. Determining the state of mitochondrial function, eg. ATP production, oxygen
consumption, NAD(P)H balance during PVL and ALPPS induced liver regeneration.
3. The investigations of singnaization related to the observed mitochondrial function changes.
4. Assessing whether morphological alterations are present concomitantly with the functional and biogenetical changes.
In the second (II) investigation physical activity as a possible prehabilitation technique was tested according to the following aims:
1. Investigating how physical activity changes the ALPPS induced regenerative process.
2. Assessment of mitochondrial function in sedentary lifestyle and physically prehabilitated animals.
3. Assessment of the intracellular processes behind mitochondrial function changes caused by the physical prehabilitation.
3. Materials and methods
3.1. Ethical statement
All animal studies were carried out according to the regulations of the European Union and the Hungarian Animal Welfare regulations (Approval no.: PEI/001/1732-6/2015).
3.2. Animal husbandry
In the first set of experiments male Wistar rats were used (n=100, bodyweight: 200-210
g). In the second study older animals, weighting 300-350 g were used. The animals were placed in a specific animal housing unit, under standardized conditions of 12 hour day-night cycle, temperature (20-23 °C) and humidity (40-60 %).
3.3. Operative procedure
The portal ligation of the right lateral (-RLL), left medial (LML), left lateral (LLL)-t and caudate lobes(CL) with suture material (6-0 Black Silk, Atramat, Mexico DF, Mexico) under a surgical microscope történt (Leica M650, Leica Microsystems, Zürich) (PVL). In the ALPPS group an additional in situ parenchymal transection was done utilizing U-sutures and electrocautery. The sacrifice was carried out with lethal dose of ketamine and xylazine.
3.4. Physical preconditioning protocol
The animals of the second study were divided into ALPPS and ALPPS+P groups. The ALPPS group received no conditioning, whilst the ALPPS+P group received 6 weeks of treadmill exercise, which contained 1h running with elevating speed (maximum 16 m/min).
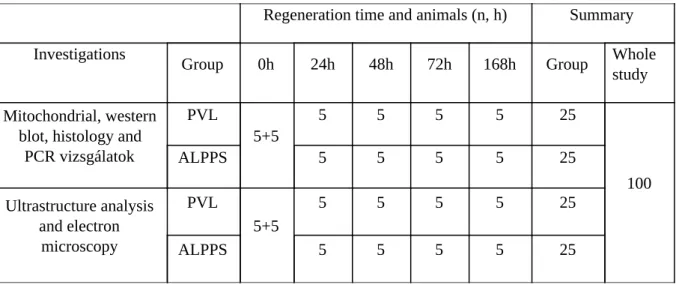
3.5. Allocation of the animals
Table 1: Animal allocation in the first study.
Regeneration time and animals (n, h) Summary
Investigations
Group 0h 24h 48h 72h 168h Group Whole
study Mitochondrial, western
blot, histology and PCR vizsgálatok
PVL
5+5
5 5 5 5 25
100
ALPPS 5 5 5 5 25
Ultrastructure analysis and electron
microscopy
PVL
5+5
5 5 5 5 25
ALPPS 5 5 5 5 25
Table 2: Animal allocation in the second study
Regeneration time and animals (n, h) Summary
Investigations
Group 0h 24h 48h 72h 168h group Whole
study Mitochondrial,
western blot, histology and PCR
vizsgálatok
ALPPS 6 6 6 6 6 30
60
ALPPS+P 6 6 6 6 6 30
3.6. Morphometric analysis
3.6.1. Liver weight and regeneration rate measurements
The regeneration rate was assessed with the following formula. (Lobe weight/bodyweight/control group lobe weight/bodyweight) *100 .
3.6.2. Histology
Tissue samples from the regenerating right median lobe (RML) were fixed in 4%
paraformaldehyde for 24 h and embedded in paraffin. Ki-67 immunostaining was performed according to the manufacturer’s recommendations using MIB-5 anti-Ki-67 antibody (Dako, Hovedstaden, Denmark). Histological slides were scanned (Pannoramic 250 Flash®; 3DHistech, Budapest, Hungary) and evaluated using Quant Center® software (3DHistech). Results are shown as percentage of positive cells per detection area.
3.6.3. Electron microscopy
Following administration of a lethal dose of ketamine and xylazine, intracardiac perfusion was carried out with 150 ml saline followed by 100 ml 4 percent paraformaldehyde and 200 ml 2 per cent glutaraldehyde. Pieces of RML (1 × 1 × 1 mm) were postfixed in 1 per cent osmium tetroxide for 1 h at 4∘, then dehydrated and embedded in Araldite® (Sigma-Aldrich, St Louis, Missouri, USA). Ultrathin sections were prepared and contrast-stained with lead citrate. An H-7500 transmission electron microscope (Hitachi, Tokyo, Japan) equipped with a Megaview II digital camera (Olympus, Tokyo, Japan) was used for image acquisition. Mitochondrial area was measured in every fully captured cell using FIJI software. To aid with interpretation, mitochondria with an area of less than 0⋅24 μm2 (median mitochondrial area in the control group) were classified as small.
3.7. Mitochondrial assessments
3.7.1. Mitochondrial isolationMitochondria were isolated from the regenerating (RML) lobe using 0.5 g of liver tissue.
The supernatant was centrifuged at 200G for 10 minutes. The pellet was resuspended. This
process was repeated 3 times, at the las one the supernatant was discarded, and the mitochondria were suspended in 200 microlitres of measurement puffer.
3.7.2. Assessment of mitochondrial respiration.
Oxygen consumption was measured via reduced nicotinamide adenine dinucleotide dehydrogenase (first respiratory complex) and succinate dehydrogenase (second respiratory complex) using an Oxygraph-2K ® high resolution respirometry system (Oroboros Instruments, Innsbruck, Austria). Both state 4 (basal function; indicates the endogenous substrate supply) and the adenosine 5′ -diphosphate (ADP)-stimulated state 3 (induced function; indicates maximum oxygen consumption) oxygen consumption were evaluated. Complex I oxygen consumption was measured in the presence of glutamate–malate (GM), whereas complex II oxygen consumption was measured with succinate in the medium (Table S2, supporting information).
3.7.3. Mitochondrial ATP production assessment
Mitochondrial ATP production was measured by the method of Tretter and colleagues, based on coupled enzyme reactions, which result in the reduction of nicotinamide adenine dinucleotide phosphate. The absorbance of reduced nicotinamide adenine dinucleotide phosphate was measured at 340 nm using a V650 UV/VIS double-beam spectrophotometer (ABL&E Jasco, Tokyo, Japan). The endogenous substrate supply indicating basal ATP production was investigated in the presence of mitochondria and ADP only. To evaluate the induced, complex I or II-mediated maximum achievable ATP production, GM or succinate was added to the medium.
3.7.4. Mitochondrial NAD(P)H balance assessment
Citrate cycle function (endogenous substrate production) leading to matrix reduced nicotinamide adenine. dinucleotide (phosphate) (NAD(P)H) autofluorescence was measured using a PTI Deltascan® fluorescence spectrophotometer (Photon Technology International, Lawrenceville, New Jersey, USA) at 37∘C, at 344 nm excitation and 460 nm emission wavelengths. Basal NAD(P)H autofluorescence was assessed with only mitochondria present in the incubation medium. GM or succinate was added to the medium to evaluate NAD(P)H content when complex I or II activity was induced
3.7.5. Mitochondrial ROS (reactive oxygen species) production measurements
The measurements were conducted in the presence of H 2 O 2 Amplex Red fluorescent pigment at 550 nm excitation and 585 nm emission wavelengths . The instruments were calibrated with known amount of H 2 O 2.
3.8. qPCR measurements
NucleoSpin® RNA II kit (Macherey-Nagel # 740955.250 Düren, Németország) was used to isolate RNA content of samples. The cDNA libraries were synthesized with etro cDNA Synthesis kit (Bioline #BIO-65026 Luckenwalde, Germany). The qPCR reaction medium contained 1 ul EvaGreen pigment, 10 ul 2x iTaq supermix, 2,5 ul primer solution. LightCycler 480 instrument was used for detection.
3.9. Western blot assessments
Liver tissue was pre-homogenized in phosphate-buffered saline with an Ultra Turrax®
homogenizer (IKAWerke, Staufen im Breisgau, Germany). Some 100 μl pre-homogenate was
re-homogenized in 1000 μl RIPA buffer. Samples containing 20 μg protein were electrophoresed on 8–12 per cent (v/v) sodium dodecyl sulphate–polyacrylamide gels. Proteins were transferred on to polyvinylidene difluoride membranes. Samples were incubated with primary antibodies (Table S3, supporting information). Bound primary antibodies were detected using horseradish peroxidase-conjugated secondary antibodies (Jackson ImmunoResearch, West Grove, Pennsylvania, USA) and SuperSignal West Pico® chemiluminescent substrate (Thermo Scientific, Waltham, Massachusetts, USA). Protein bands were visualized on X-ray films and quantified with FIJI software. Total protein load served as internal control.
3.10. Statistical analysis
Results are presented as mean (s.d.). Statistical analysis was carried out in GraphPad Prism® version 6.1. Results were assessed by two-way ANOVA with Bonferroni’s post hoc analysis. p<0.05 was considered significant.
4. Results
1
stexperiment: Cellular energetic changes in PVL and ALPPS induced liver regeneration
4.1.1. Lobe weight changes
The weight gain and pace of hypertrophy of the RML wassignificantly higher after ALPPS than after PVL (168 h,P <0.001).
4.1.2. Changes of cell proliferation rates
The Ki-67 index was significantly higher in the ALPPS group after 24 h (P <0.001) and 48 h (P= 0.015).
4.1.3. Oxygen consumption changes after PVL and ALPPS
Basal complex I activity was not affected by the operations. Basal oxygen consumption via complex II increased significantly 24 h after ALPPS and returned to baseline 48 h after the intervention, with no significant differences compared with control levels or the PVL group . In the PVL group, induction of complex I by GM +ADP resulted in a tendency towards an increase in oxygen consumption 24 and 48 h after the interventions. In the ALPPS group, the oxygen consumption increased initially then returned close to basal level, becoming significantly lower than that in the PVL group 48 h after operation (P= 0.040). In the case of complex II induction, mitochondrial activity was significantly increased in both groups compared with controls after 24 h (PVL versus control, P= 0⋅002; ALPPS versus control, P= 0.010). Induced complex II oxygen consumption in the PVL group remained significantly higher than the control value, whereas oxidation in the ALPPS group returned to the control level, becoming significantly lower than that in the PVL group.
4.1.4. Changes of ATP production after ALPPS and PVL
In the PVL group the basal ATP production of CI significantly increased 24h after the operations compared to the control group and remained significantly elevated until the end of the experiments . ALPPS also produced a significant increase in ATP production 24h after the operation. However, after the first day, ATP production quickly returned close to the control values and the ATP output of CI was significantly lower compared to the PVL group at 48th and 72th postoperative hours. (48h: p=0.014, PVL vs. ALPPS) In case of CII, the basal ATP production also significantly increased by the 24th hour in PVL treated animals compared to the control groups, and remained significantly increased until the 72th hour. In contrast, ATP production in the ALPPS groups - after a temporary elevation - quickly returned to the control level, producing a significant difference between the PVL and ALPPS groups. (48h: p=0.019, PVL vs. ALPPS) By induction with GM, the ATP production of CI significantly increased in the PVL group compared to the control values at the 24th postoperative hours, then returned to the control level. In the ALPPS groups the induced ATP production did not show significant changes compared to the control values. However, a gradual functional deterioration was observable, which caused a significant difference between the ALPPS and PVL group at 48th hours. (48h:
p=0.038 PVL vs. ALPPS). Interestingly, the induced ATP production of SDH presented significant impairments in both animal groups. The alterations in the ALPPS group were more
severe, the induced ATP production after 48 hours was significantly lower after ALPPS compared to PVL (48h: p=0.029, PVL vs. ALPPS).
4.1.5. NAD(P)H balance after PVL and ALPPS
In the PVL groups the basal NAD(P)H concentrations related to CI and CII activity did not show significant differences compared to the control value. On the other hand, NAD(P)H concentration in the ALPPS groups gradually decreased after the operations with significantly lower values compared to the control group between the 48th and 168th postoperative hours.
These alterations resulted in significant differences in CI activity between the ALPPS and PVL groups at 24th and 48th hours and at the 24th hour in the CII. By the induction of proper substrates similar trends could be seen. The NAD(P)H content in the PVL group showed no changes compared to the control group. In the ALPPS group significantly lower concentrations were present compared to the control values at 48th, 72th and 168th postoperative hours in the case of CI and at 72th hours in case of CII induction. These changes also manifested in significantly lower NAD(P)H content in the ALPPS group compared to those seen in PVL treated animals.
4.1.6. Changes of mRNA expression
The PGC1- α expression showed significant elevation in the ALPPS group compared to the PVL. The NRF1 expression showed no significant changes between the animal groups. Both NRF2 and mTFA mRNA content showed to be elevated by the 24 th postoperative hour in both animal groups compared to their corresponding control,whilst showing no statistical differences compared to each other.
4.1.7. Inflammatory response increases after ALPPS
Liver tissue lysate TNF-α levels significantly increased by the 24th hour in both animal groups compared to the control value. While the protein levels of PVL treated livers normalize after 48 hours, the TNF-α concentration in the ALPPS group remained significantly higher compared to the control and the PVL groups. In the first 72 postoperative hours, the NF-κB protein levels showed significant increase in both animal groups compared to the corresponding control groups. However, the alterations in protein concentration were more pronounced after ALPPS compared to that seen in PVL treated animals.
4.1.8. Mitochondrial biogenesis after ALPPS and PVL
48 hours after the operation the protein levels of PGC1-α significantly increased in the PVL group compared to the control value. In contrast, in the ALPPS group it showed no significant changes, and the protein levels of PGC1-α proved to be significantly lower at 48th postoperative hours compared to PVL. (48h: PVL vs. ALPPS, p=0.044). The NRF-1 protein levels were significantly increased in the PVL group in the first 72th hours compared to the control values, while in the ALPPS group the NRF1 levels remained unchanged throughout the entire experiment and were significantly lower in the first 72 postoperative hours compared to the values seen after PVL (24h: p=0.046; 48h: p=0.378; 72h: p=0.049, PVL vs. ALPPS). The NRF2 protein levels have shown no significant elevation in any of the animal groups compared to the control group, and no significant differences were present either between the ALPPS and PVL treated animals. In the case of cytochrome-c and mTFA protein levels in liver tissue lysates, no significant change was observable between the groups or compared to the control values.
4.1.9. Changes of mitochondrial protein content after PVL or ALPPS
In the mitochondrial fraction, significant changes of cytochrome-c and mTFA protein levels were detected. The mitochondrial mTFA levels gradually raised in the PVL group, while in the ALPPS group a tendencious decrease was observable. These together caused significant differences between the PVL and ALPPS treated animal at 48th and 72th hours. (48h: p=0.002, 72h; p=0.029 PVL vs ALPPS). The mitochondrial cytochrome-c levels were elevated in the PVL groups at 48th and 72th hours compared to the control value. In the ALPPS group however, they remained unchanged and were significantly lower compared to the PVL values in the first 72 hours.
4.1.10. Mitochondrial morphology alters significantly after ALPPS
The average mitochondrial area was unchanged in the PVL group when compared to the control group throughout the entire experiment. In the ALPPS group, however, a significant decrease can be spotted in the average mitochondrial area at 48th postoperative hour compared to the control values and to the PVL group (48h; p=0.038, PVL vs. ALPPS; p=0,034, PVL vs control). These alterations were also well detectable in the changes of the mitochondrial area distribution. The PVL group showed no significant changes compared to the control, while in the ALPPS group majority of the mitochondria were below <0.24µm2 at 48th hours.
2
ndexperiment: Effects of prehabilitation in ALPPS induced liver regeneration
4.2.1. Bodyweight changes in ALPPS and ALPPS+P treated animals
Physical prehabilitation resulted in lowered bodyweights in the ALPPS+P group compared to the ALPPS group (p<0.001, ALPPS vs. ALPPS+P). This difference was present both before and after the operations (p<0.001, ALPPS vs. ALPPS+P).
4.2.2. Alterations of RML regeneration rate after ALPPS and ALPPS+P
In the case of ALPPS the regeneration rate significantly elevated by 24 hours after the operations. In the ALPPS+P group this gain was more dynamic and pronounced, thus results in this group were significantly higher compared to the ALPPS and control groups as well.
4.2.3. Acceleration of proliferation after prehabilitation
The Ki-67 index shown significant elevation in both animal groups in the first 72 hours of regeneration if compared to the controls. However, Ki-67 index in the ALPPS+P group remained higher for a lonfer period of time, which presented significantly elevated values in the 72 nd postoperative hour compared to the ALPPS group.
4.2.4. Oxygen consumption changes in prehabilitated and non-prehabilitated ALPPS treated animals
In the non-prehabilitated (ALPPS) group basal CI oxygen consumption was paradoxically higher 24 hours after the operations if compared to the prehabilitated group (p<0.001, ALPPS vs ALPPS+P). The oxygen consumption of complex II showed similar tendencies, as basal CII oxygen consumption of the ALPPS+P group was decreased compared to the ALPPS group. The induced CI activity did not result in significant differences between the animal groups, only in
tendentiously elevated levels in the ALPPS+P group. Induced CII activity did not result in significant changes.
4.2.5. Prehabilitation enhances ATP production rates
Basal ATP production rates of complex I was significantly higher throughout the whole experiment in the ALPPS+P group compared to the non-prehabiliated ALPPS group. In the case of complex II, control ATP production values were significantly higher in the ALPPS+P group compared to the ALPPS group, and remained higher until the 72 nd postoperative hour (p<0.001).
Regarding induced ATP production, complex I function showed to be significantly higher 24, 48, 72 and 168 hours after operation in the operations in the ALPPS+P group, while complex II functions were higher in the control animals and 24, 48 and 72 hours after the interventions when compared to the ALPPS group (p<0.001, ALPPS vs. ALPPS+P).
4.2.6. P/O ratio changes in ALPPS treated and prehabilitated ALPPS operated animals
The complex I P/O ratios were statistically similar in the two animal groups, however values of the ALPPS+P group remained somewhat higher between the 24 th and the 72 th postoperative hours. In the case of comlex II, the P/O ratio was significantly elevated 48h after operations in the ALPPS+P group, compared to the ALPPS group (p<0.05, ALPPS vs.
ALPPS+P).
4.2.7. NAD(P)H balance in prehabilitated and non-prehabilitated animals.
In the case of basal CI activity, the NAD(P)H content shown significant elevations in the postoperative 24 th and 48 th hour if compared to the control group. In the case of sedentary animal groups a significant decrease was visible in NAD(P)H content if compared to the ALPPS+P group. Basal CII activity resulted in significant NAD(P)H content elevation in the 24 th postoperative hour compared to the ALPPS group (p=0.035, ALPPS vs. ALPPS+P). Induced CI and CII state resulted in similar alterations of NAD(P)H content.
4.2.8. Inflammatory responses in prehabilitated and non-prehabilitated ALPPS operated animals
Tissue lysate IL1-beta levels shown to be significantly higher 48 and 72 hours after the operations in the ALPPS group compared to the ALPPS+P treated ones (48h: p<0.001 and 72h: p<0.05 ALPPS vs. ALPPS+P). Aligning to these tendencies, IL1-RA levels were tendentiously higher in the ALPPS+P group and presented significantly higher values 24, 48 and 168 hours after the operations compared to the ALPPS group. IL-6 protein concentrations in the ALPPS group were significantly elevated by the 48th and 72nd postoperative hour compared to the ALPPS+P group (p=0.042, ALPPS vs. ALPPS+P). The downstream NF-KB P65 concentrations were significantly elevated after 24h after ALPPS treatment and were tendentiously higher in the control group, 48 and 72 hours compared to the ALPPS+P group.
4.2.9. Mitochondrial biogenesis in prehabilitated and sedentary lifestyle ALPPS treated animals
Tissue lysate PGC1-alpha levels showed no significant elevations in the ALPPS group while were increased significantly in the ALPPS+P group 24 and 48 hours after the operations compared to the corresponding controls (p<0.001 ALPPS vs. ALPPS+P and ALPPS+P vs.
control). This alteration caused significantly elevated PGC1-alpha protein levels 48h after the interventions in the ALPPS+P group compared to the ALPPS group. NRF1 levels were significantéy elevated 48h after the the operations in the ALPPS+P group and after 48, 72 and 168 hours in the ALPPS group compared to the corresponding controls (p<0.001 ALPPS vs.
ALPPS+P and ALPPS+P vs. control). However, the values in the ALPPS+P group were significantly elevated from the start until the 48th postoperative hour compared to the non prehabilitated ALPPS group. NRF2 protein concentrations showed significant elevation 24, 48 and 72 hour after the operations in both animal groups if compared to the corresponding controls.
However elevation of NRF2 in the ALPPS+P group far exceeded that of the ALPPS group, presenting significantly higher values 24 and 48 hours after the intervention (24h: p<0.01 and 48h: p<0.001, ALPPS vs. ALPPS+P).
4.2.10. Prehabilitation elevates OXPHOS protein levels in ALPPS treated animals
Tissue lysate complex I levels did not differ significantly from the corresponding controls except the values 168 hours after the operations in the ALPPS group. Comparing the animal groups complex I protein expression was significantly more pronounced 24 and 72 hours after the operations in the ALPPS+P group. Complex II protein expression showed significant decrease by the 168th hour compared to the corresponding control. Group comparison showed significantly higher protein levels in the ALPPS+P group compared to the ALPPS group 24, 48 and 72 hours after operations as well as in control animals. Regarding complex 3 there were no significant differences in any of the animal groups if compared to controls, but the values of the ALPPS+P group showed to be tendentiously higher, which presented significant elevation compared to the ALPPS group in the 24th postoperative hour. Complex IV concentrations were significantly indifferent from controls except the 72 hour values of the ALPPS+P group. If between group differences were measured, ALPPS+P values were significantly elevated 24 and 72 hours after the operations compared to the corresponding ALPPS values. ATP synthase protein concentrations showed significant elevation in the ALPPS+P group compared to the control and were significantly higher than the ALPPS values 24 hours after the operations.
5. Conclusions
Experiment I:
1. Our ALPPS model - with some restrictions - was able to mimic the changes that were seen in human cases. It produced significantly elevated regeneration rates and proliferative index.
2. ALPPS and PVL is followed by a strong inflammatory pathway activation, which interferes with the replenishment of mitochondria.
3. Alongside the upregulated regeneration the decrease of mitochondrial function was observable in the ALPPS treated animals, when the proliferation was the most intensive.
This timeframe can be interpreted as 10-14 days postoperatively in humans.
4. The damage in biogenesis is also manifested physically. Smaller sized mitochondria are visible after ALPPS. This is further supported by the decrease of mitochondrial protein content.
Experiment II:
1. Physical preconditioning significantly altered the dynamic of regeneration of the liver.
The proliferation index, and the regeneration rate was significantly elevated in the prehabilitated animal group.
2. The immense regenerative upregulation is accompanied by an elevated liver mitochondrial function increase in the prehabilitated animals, which supports the energy requirements of the rapid proliferation.
3. The elevation of energy utput of the mitochondria might be due to the elevation of stress induced biogenetic mediators. Doue to this mitochondrial and energy production component levels rose significantly in the prehabilitated animals.
6. Bibliography of the author
Publications used in the thesis:
● A. Budai , A. Fulop, O. Hahn, P. Onody, T. Kovacs, T. Nemeth, M. Dunay, A. Szijarto
“Animal Models for Associating Liver Partition and Portal Vein Ligation for Staged Hepatectomy (ALPPS): Achievements and Future Perspectives”, Eur Surg Res.
2017;58(3-4):140-157. doi: 10.1159/000453108. Epub 2017 Mar 9.
● A. Budai , G. Horváth, L. Tretter, Z. Radák, E. Koltai, Z. Bori, F. Torma, Á. Lukáts, Röhlich, A. Szijártó, A. FülöpMitochondrial function after associating liver partition and portal vein ligation for staged hepatectomy in an experimental model. Brit J Surg. DOI:
10.1002/bjs.10978
Other publications of the author:
● Fulop A., Szijarto A., Harsanyi L., Budai A ., Pekli D., Korsos D., Horvath I., Kovacs N., Karlinger K.,Mathe D., Szigeti K: „Demonstration of metabolic and cellular effects of portal vein ligation using multi-modal PET/MRI measurements in healthy rat liver PLoS One.” 2014 Mar 5;9(3):e90760. doi: 10.1371/journal.pone.0090760. eCollection 2014
● Fülöp A., Budai A ., Czigány Z., Lotz G., Dezső K., Paku S., Harsányi L., Szijártó A.:
„Alterations in hepatic lobar function in regenerating rat liver.” J Surg Res. 2015 Aug;197(2):307-17. doi: 10.1016/j.jss.2015.04.033. Epub 2015 Apr 15
● David Tibor Lauber, Dóra Krisztina Tihanyi1, Zoltán Czigány, András Budai , Kovács, Tibor, Dóra Drozgyik, András Fülöp, Attila Szijártó: „Effects of different degrees of extended portal vein ligation on liver regeneration.” J Surg Res