Article
Integrated (epi)-Genomic Analyses Identify
Subgroup-Specific Therapeutic Targets in CNS Rhabdoid Tumors
Graphical Abstract
Highlights
d
ATRTs comprise three molecular and epigenetic subgroups:
group 1, 2A, and 2B
d
Distinct chromatin landscape drives subgroup-specific lineage and signaling features
d
ATRT subgroups exhibit distinct sensitivity to signaling and epigenetic inhibitors
d
Epigenetically regulated
PDGFRBenhancer drives TKI sensitivity in group 2 ATRTs
Authors
Jonathon Torchia, Brian Golbourn, Shengrui Feng, ..., James T. Rutka, Nada Jabado, Annie Huang
Correspondence
ddecarv@uhnresearch.ca (D.D.D.C.), james.rutka@sickkids.ca (J.T.R.), nada.jabado@mcgill.ca (N.J.), annie.huang@sickkids.ca (A.H.)
In Brief
Torchia et al. show that atypical teratoid rhabdoid tumors (ATRTs) are composed of three epigenetic subgroups that correlate with differential cellular responses to a panel of signaling and epigenetic inhibitors. Specifically, dasatinib and nilotinib are identified as promising therapeutics for group 2 ATRTs.
Torchia et al., 2016, Cancer Cell30, 891–908 December 12, 2016ª2016 Elsevier Inc.
http://dx.doi.org/10.1016/j.ccell.2016.11.003
Cancer Cell
Article
Integrated (epi)-Genomic Analyses Identify Subgroup-Specific Therapeutic Targets in CNS Rhabdoid Tumors
Jonathon Torchia,1,2,7,13,73Brian Golbourn,1,8,13,73Shengrui Feng,3,14,73King Ching Ho,7,13,73Patrick Sin-Chan,1,2,7,13 Alexandre Vasiljevic,15Joseph D. Norman,7,13Paul Guilhamon,14Livia Garzia,10,13Natalia R. Agamez,7,13Mei Lu,7,13 Tiffany S. Chan,1,2,7,13Daniel Picard,7,13Pasqualino de Antonellis,10,13Dong-Anh Khuong-Quang,16,17Aline C. Planello,14 Constanze Zeller,14Dalia Barsyte-Lovejoy,14Lucie Lafay-Cousin,20Louis Letourneau,19Mathieu Bourgey,19
(Author list continued on next page)
SUMMARY
We recently reported that atypical teratoid rhabdoid tumors (ATRTs) comprise at least two transcriptional subtypes with different clinical outcomes; however, the mechanisms underlying therapeutic heterogeneity remained unclear. In this study, we analyzed 191 primary ATRTs and 10 ATRT cell lines to define the genomic and epigenomic landscape of ATRTs and identify subgroup-specific therapeutic targets. We found ATRTs segregated into three epigenetic subgroups with distinct genomic profiles,
SMARCB1genotypes, and chro- matin landscape that correlated with differential cellular responses to a panel of signaling and epigenetic inhibitors. Significantly, we discovered that differential methylation of a
PDGFRB-associated enhancer con- fers specific sensitivity of group 2 ATRT cells to dasatinib and nilotinib, and suggest that these are promising therapies for this highly lethal ATRT subtype.
1Department of Laboratory Medicine and Pathobiology
2Department of Paediatrics
3Department of Medical Biophysics
4Department of Molecular Genetics
5Department of Computer Science
6Department of Surgery
University of Toronto, Toronto, ON M5G0A4, Canada
7Division of Hematology/Oncology
8Division of Neurosurgery
9Division of Pathology
10Program in Developmental & Stem Cell Biology
11Program in Genetics & Genome Biology
12Department of Paediatric Laboratory Medicine
13Arthur and Sonia Labatt Brain Tumour Research Centre Hospital for Sick Children, Toronto, ON M5G1X8, Canada
14Princess Margaret Cancer Center, University Health Network, Toronto, ON M5G1L7, Canada
15Department of Pathology, Groupement Hospitalier Est, CHU de Lyon, Lyon-Bron 69677, France
16Department of Pediatrics
17Department of Human Genetics
18Department of Pathology
McGill University, Montreal, QC H3Z2Z3, Canada
19Genome Quebec Innovation Centre, McGill University, Montreal, QC H3A1A4, Canada
(Affiliations continued on next page)
Significance
ATRTs are considered to be genetically homogeneous with bland genomes. Our integrated genomic studies indicate a higher non-coding mutation rate and predominantly structural coding alterations, which suggest a more complex ATRT genome. We identify three epigenetic ATRT subtypes associated with distinct genotypic, chromatin, and functional landscapes that correlate with cellular responses to various signaling and epigenetic pathway inhibitors. Significantly, we identify two well-characterized cancer drugs, dasatinib and nilotinib, as promising therapeutic agents for group 2 ATRTs.
Together with our earlier findings, our data provide compelling rationale for the development of a risk- and biology-stratified trial for ATRTs.
Cancer Cell30, 891–908, December 12, 2016ª2016 Elsevier Inc. 891
INTRODUCTION
Rhabdoid tumors (RT) are highly malignant, multi-lineage neoplasms of early childhood originally described in kidneys and soft tissues, but most frequently seen in the CNS where they are called atypical teratoid rhabdoid tumors (ATRTs).
ATRTs were historically considered incurable, and although outcomes have improved with intensified multimodal ther- apy, most patients survive less than 1 year after diagnosis (Chi et al., 2008; Hilden, 2004; Lafay-Cousin et al., 2012; Te- kautz, 2005).
BiallelicSMARCB1loss-of-function alterations are diagnostic of all RTs (Versteege et al., 1998). Up to 35% of ATRTs patients have heritableSMARCB1alterations, which predispose to mul- tiple RTs (Eaton et al., 2011). Indeed, Smarcb1+/ mice also develop soft-tissue- or neural-crest-derived RTs (Klochendler- Yeivin et al., 2000; Roberts et al., 2002), and ATRTs can arise from conditional inactivation of Smarcb1 (Han et al., 2016).
SMARCB1 is a constitutive component of the SWI/SNF chro- matin-remodeling complex, which exhibits substantial structural and functional diversity during neurogenesis. Loss ofSMARCA4 (Hasselblatt et al., 2011), which encodes another component of Man Yu,13Deena M.A. Gendoo,7,13Misko Dzamba,5Mark Barszczyk,13Tiago Medina,14
Alexandra N. Riemenschneider,8,13A. Sorana Morrissy,10,13Young-Shin Ra,22Vijay Ramaswamy,7,13Marc Remke,7,13 Christopher P. Dunham,23Stephen Yip,25Ho-keung Ng,26Jian-Qiang Lu,27Vivek Mehta,28Steffen Albrecht,18 Jose Pimentel,30Jennifer A. Chan,21Gino R. Somers,12Claudia C. Faria,31Lucia Roque,32Maryam Fouladi,33
Lindsey M. Hoffman,34Andrew S. Moore,35Yin Wang,36Seung Ah Choi,37Jordan R. Hansford,38Daniel Catchpoole,39 Diane K. Birks,34Nicholas K. Foreman,34Doug Strother,29Almos Klekner,40Laszlo´ Bogna´r,40Miklo´s Garami,41 Pe´ter Hauser,41Tibor Hortoba´gyi,42Beverly Wilson,29Juliette Hukin,24Anne-Sophie Carret,43Timothy E. Van Meter,44 Eugene I. Hwang,45Amar Gajjar,46Shih-Hwa Chiou,47Hideo Nakamura,48Helen Toledano,49Iris Fried,50Daniel Fults,51
(Author list continued on next page)
20Division of Pediatric Hematology/Oncology, Alberta Children’s Hospital, AB T3B6A8, Canada
21Department of Pathology and Laboratory Medicine, University of Calgary, Calgary, AB T2N1N4, Canada
22Department of Neurosurgery, Asan Medical Center, Seoul 138-736, Korea
23Division of Anatomic Pathology
24Division of Hematology and Oncology
Children’s and Women’s Health Centre of B.C, University of British Columbia, Vancouver, BC V6H3N1, Canada
25Department of Pathology & Laboratory Medicine, University of British Columbia, V6T1Z3, Canada
26Department of Anatomical and Cellular Pathology, Chinese University of Hong Kong, Hong Kong, China
27Laboratory Medicine and Pathology
28Division of Neurosurgery
29Division of Pediatric Hematology/Oncology
Stollery Children’s Hospital, University of Alberta, Edmonton, AB T2W3N2, Canada
30Divison of Pathology
31Department of Neurosurgery
Hospital de Santa Maria, Centro Hospitalar Lisboa Norte, Lisbon 1649-035, Portugal
32Cytometry and Cytogenetic Laboratory, CIPM, Portuguese Cancer Institute, Lisbon 1099-023, Portugal
33Division of Oncology, Department of Cancer and Blood Diseases, Cincinnati Children’s Hospital, Cincinnati, OH 45229, USA
34Department of Pediatrics, University of Colorado, Denver, CO 80045, USA
35Oncology Service, Children’s Health Queensland Hospital; University of Queensland Diamantina Institute, Brisbane, QLD 4102, Australia
36Research Institute of Health Development Strategies, Fudan University, Shanghai 200032, China
37Division of Pediatric Neurosurgery, Seoul National University Children’s Hospital, Seoul 03080, Korea
38Royal Children’s Hospital, Murdoch Children’s Research Institute, Melbourne, VIC 3052, Australia
39Children’s Cancer Research Unit, Children’s Hospital at Westmead, Westmead, NSW 2145, Australia
40Department of Neurosurgery, University of Debrecen, Debrecen 4032, Hungary
41Second Department of Pediatrics, Semmelweis University, Budapest 1094, Hungary
42Department of Histopathology, University of Szeged, Szeged 6720, Hungary
43Department of Pediatrics, Division of Hematology-Oncology, Universite´ de Montre´al/CHU Sainte-Justine, Montreal, QC H3T1C5, Canada
44Department of Neurosurgery, Virginia Commonwealth University, Richmond, VA 23298-0631, USA
45Department of Oncology, Children’s National Medical Center, Washington, DC 20010, USA
46Division of Neuro-Oncology, St. Jude Children’s Research Hospital, Memphis, TN 38105, USA
47Department of Medical Research, Taipei Veterans General Hospital and National Yang-Ming University, Taipei 112, Taiwan
48Department of Neurosurgery, Kumamoto University, Kumamoto 860-8556, Japan
49Department of Pediatric Hematology Oncology, Children’s Medical Center of Israel, Petach Tikva 49202, Isreal
50Department of Pediatric Hematology-Oncology, Hadassah Hebrew University Medical Center, Jerusalem 91120, Israel
51Department of Neurosurgery, University of Utah, School of Medicine, Salt Lake City, UT 84132, USA
52Department of Neurosurgery, Shizuoka Children’s Hospital, Shizuoka 420-8660, Japan
53Department of Pediatrics, McMaster University, Hamilton, ON L8S4K1, Canada
(Affiliations continued on next page)
892 Cancer Cell30, 891–908, December 12, 2016
the SWI/SNF complex in some ATRTs, further underscores SWI/SNF-directed epigenetic mechanisms as critical in ATRT development. Although cumulative data support a central role forSMARCB1in RT initiation, specific mechanisms driving tu- mor development remain unclear. SMARCB1 deficiency leads to aberrant nucleosomal positioning by the SWI/SNF complex and is associated with upregulation of EZH2, a histone methyl transferase of the repressive PRC2 complex (Roberts and Orkin, 2004) with consequent deregulation of multiple downstream signaling pathways. These observations have led to RT therapies targeting EZH2 and other downstream pathways (Kim and Rob- erts, 2016; Wilson et al., 2010).
Surprisingly, despite the highly malignant and heteroge- neous nature of ATRTs, exome studies indicate only recurrent SMARCB1coding alterations (Johann et al., 2016; Lee et al., 2012). We recently reported that ATRTs comprised at least two transcriptional subtypes with different clinical phenotypes (Torchia et al., 2015). While group 1 ATRTs with neurogenic sig- natures correlated with superior survival, group 2 ATRTs with
mesenchymal signatures had aggressive, treatment-resistant phenotypes and dismal outcomes. However, mechanisms un- derlying varied therapeutic responses in ATRT patients remain unclear. Therefore, we performed an integrated genomic and functional epigenomic analysis of a large cohort of primary tu- mors and cell lines to elucidate subgroup-specific therapeutic sensitivities in ATRT.
RESULTS
ATRTs Comprise Three Epigenetic Subtypes with Distinct Clinical Profiles and Genotypes
We integrated whole-genome sequencing (WGS), whole-exome sequencing (WES), high-resolution copy number profiling, and RNA-sequencing (RNA-seq) analyses with gene expression and methylation profiling on a total of 191 primary tumors (Table S1).
Consistent with prior studies, coding region single-nucleotide vari- ation (SNV) rate was low with only recurrentSMARCB1coding mutations (Figure 1A,Table S2). However, intergenic mutation Takafumi Wataya,52Chris Fryer,24David D. Eisenstat,29Katrin Scheinemann,53Adam J. Fleming,53Donna L. Johnston,54 Jean Michaud,55Shayna Zelcer,56Robert Hammond,57Samina Afzal,58David A. Ramsay,57Nongnuch Sirachainan,59 Suradej Hongeng,59Noppadol Larbcharoensub,60Richard G. Grundy,61Rishi R. Lulla,62Jason R. Fangusaro,62 Harriet Druker,7Ute Bartels,7Ronald Grant,7David Malkin,2,7,11C. Jane McGlade,3,13Theodore Nicolaides,63
Tarik Tihan,64Joanna Phillips,64Jacek Majewski,17,19Alexandre Montpetit,19Guillaume Bourque,17,19Gary D. Bader,4 Alyssa T. Reddy,65G. Yancey Gillespie,66Monika Warmuth-Metz,67Stefan Rutkowski,68Uri Tabori,1,7,11,13
Mathieu Lupien,3,14Michael Brudno,5,11Ulrich Sch€uller,69Torsten Pietsch,70Alexander R. Judkins,71 Cynthia E. Hawkins,1,9,13Eric Bouffet,7,13Seung-Ki Kim,37Peter B. Dirks,8,13Michael D. Taylor,8,10,13
Anat Erdreich-Epstein,72Cheryl H. Arrowsmith,14Daniel D. De Carvalho,3,14,*James T. Rutka,6,8,13,*Nada Jabado,16,17,* and Annie Huang1,2,7,13,74,*
54Department of Pediatrics
55Pathology and Laboratory Medicine
Children’s Hospital of Eastern Ontario, University of Ottawa, Ottawa, ON K1H8L1, Canada
56Division of Pediatric Hematology/Oncology, Children’s Hospital, London Health Sciences Center, London, ON N6A5A5, Canada
57Department of Pathology and Laboratory Medicine, Children’s Hospital of Western Ontario, University of Western Ontario, London, ON N6A5W9, Canada
58Department of Pediatrics, Dalhousie University, Halifax, NS B3H4R2, Canada
59Department of Pediatrics, Faculty of Medicine, Ramathibodi Hospital, Mahidol University, Bangkok 10300, Thailand
60Department of Pathology, Faculty of Medicine, Ramathibodi Hospital, Mahidol University, Bangkok 10400, Thailand
61Children’s Brain Tumour Research Centre, University of Nottingham, Nottingham NG72RD, England
62Division of Pediatric Hematology-Oncology and Stem Cell Transplantation, Ann and Robert H. Lurie Children’s Hospital of Chicago, Chicago, IL 60611, USA
63Department of Pediatrics (Hematology/Oncology)
64Department of Neurosurgery
University of California, San Francisco, San Francisco, CA 94143-0112, USA
65Department of Pediatric Hematology and Oncology
66Department of Neurosurgery
University of Alabama, Birmingham, AL 35233, USA
67Department of Neuroradiology, University of W€urzburg, W€urzburg 97070, Germany
68Department of Pediatric Hematology and Oncology
69Department of Neuropathology
University Medical Center Hamburg-Eppendorf, Hamburg 20246, Germany
70Institute for Neuropathology, University of Bonn Medical Center, Bonn 53105, Germany
71Department of Pathology & Laboratory Medicine, Children’s Hospital of Los Angeles, Los Angeles, CA 90027, USA
72Department of Pediatrics, Children’s Hospital Los Angeles, Keck School of Medicine, University of Southern California, Los Angeles, CA 90027, USA
73Co-first author
74Lead Contact
*Correspondence:ddecarv@uhnresearch.ca(D.D.D.C.),james.rutka@sickkids.ca(J.T.R.),nada.jabado@mcgill.ca(N.J.),annie.huang@
sickkids.ca(A.H.)
http://dx.doi.org/10.1016/j.ccell.2016.11.003
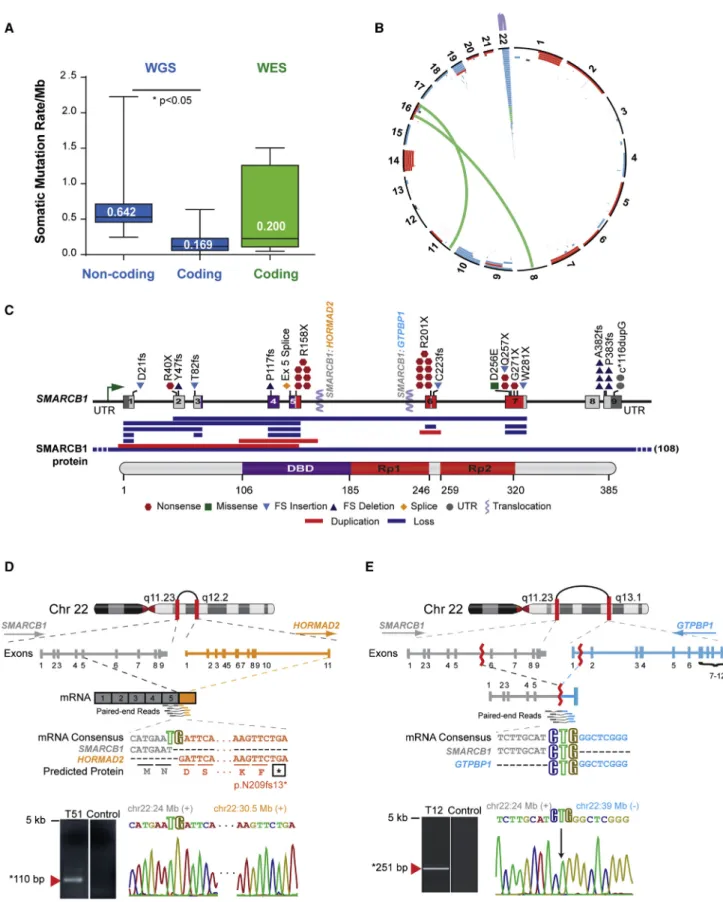
Figure 1. ATRT Coding Genome Is Predominantly Targeted By Structural Alterations
(A) Global genome and coding region somatic mutation rate in ATRTs. Median somatic mutation rates/Mb were calculated using WGS and WES data on 26 primary ATRTs with matched normal DNA. Boxplot middle represents median, box boundaries represent first and third quartiles; whiskers represent min and max values.
(legend continued on next page) 894 Cancer Cell30, 891–908, December 12, 2016
rate was significantly higher (0.64 mutation/Mb), suggesting that non-coding alterations may be important in ATRT (Figure 1A).
Interestingly, we identified a spectrum of 379 copy number alter- ations (CNAs), including whole-arm gains and losses, focal dele- tions, duplications, and complex inter- and intrachromosomal gene rearrangements and uncovered 1.84–3.57 structural alter- ations/ATRT (Figure 1B;Tables S2andS3). Cell adhesion, neural development, and chromatin-remodeling genes were targeted by recurrent coding region CNAs in up to 20% of ATRTs (Table S4) (Figure S1), andSMARCB1lacked previously reported mutational hotspots (Bourdeaut et al., 2011; Jackson et al., 2009). Notably, SMARCB1loss in 55.8% of ATRTs analyzed arose from structural events including exon duplications and gene fusions toHOR- MAD2andGTPBP1(Figures 1C–1E;Table S5), indicating struc- tural alterations as predominant mechanisms forSMARCB1loss in ATRTs.
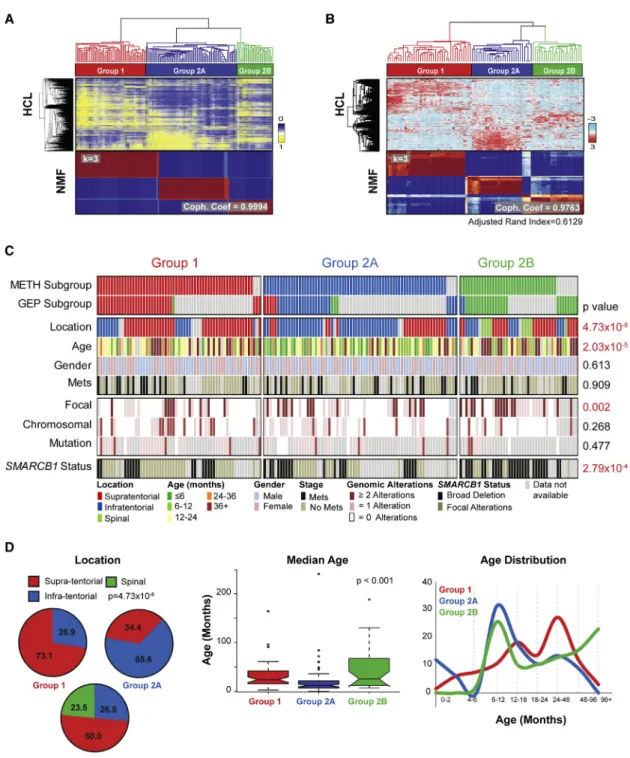
Unsupervised cluster analyses of 450k methylation micro- array data from 162 ATRTs revealed three epigenetic classes with high concordance to gene expression subtypes deter- mined from 90 primary ATRTs (Figures 2A and 2B,S2A–S2E).
While group 1 ATRTs comprised a single methylation cluster, group 2 tumors further segregated into two methylation sub- types (group 2A and 2B). ATRT subtypes correlated with distinct clinical and genotypic features (Figures 2C and 2D;Table S6);
group 1 and 2A tumors arose predominantly in the supraten- torial/cerebral (38/52; 73.1%) and infratentorial (cerebellum, brain stem) (42/64; 65.6%) locations, respectively. Group 1 and 2A ATRTs were seen in the oldest (median age 24 months;
95% confidence interval [CI] = 20.70–26.55) and youngest (median age 12 months; 95% CI = 11.05–13.00) children, respectively. Group 2B ATRTs encompassed more heteroge- neous locations and included infra- (9/34; 26.5%), supratento- rial (17/34; 50.0%), and all spinal (8/34; 23.5%) tumors. Group 2B patients spanned a broader age distribution and comprised the majority of patients older than 3 years of age (12/32; 37.5%).
We found no significant subgroup association with gender or tumor metastases.
Although SNV alteration rates were comparable across subgroups, we observed genotypic differences; group 2B tu- mors had more focal genomic alterations (mean = 1.83; 95%
CI = 1.43–2.31 alterations/tumor; p = 0.0024) than group 1 (mean = 0.86; 95% CI = 0.65–1.12 alterations/tumor) and 2A (mean = 0.88; 95% CI = 0.68–1.13 alterations/tumor;Figures 2C andTable S6) tumors. While group 1 tumors were distin- guished by recurrent chr14 gains and chr19 losses, group 2B tumors exhibited focal copy number losses across multiple chromosomes, and group 2A ATRTs were genomically bland (Figure S3). Strikingly, our analyses revealed the type of genetic event leading to SMARCB1 loss also differed between ATRT subgroups (p = 2.79310 4;Figure 2C;Table S6). Most group
1 tumors (30/45; 66.7%) exhibited focal/subgenic alterations with predicted retention of the SMARCB1transcriptional start site; however, group 2B tumors had large deletions encompass- ingSMARCB1and frequently additional chr22 genes, thus indi- catingSMARCB1genotype:phenotype correlations in ATRTs.
ATRT Subgroups Have Distinct Lineage-Enriched Functional Genomes
Our observation of specific genotypes suggests thatSMARCB1 loss may have different functional consequences in ATRT sub- types. To define core molecular and cellular features of ATRT subgroups, we integrated supervised analyses of transcriptional and methylation data and observed that, while ATRTs generally exhibited a hypermethylated genome relative to other pediatric brain tumors, group 2A ATRTs had the lowest CpG island methylation levels compared with group 1 and 2B tumors (Figure S4A). Distribution of differentially methylated probes in CpG islands or gene bodies were similar across subgroups (Fig- ure S4B); however, methylation and expression levels of lineage and developmental signaling genes differed significantly be- tween subgroups (Figure 3A). These findings were corroborated by ingenuity pathway analyses (Figure 3B; Table S7), which revealed neurogenic genes (FABP7,ASCL1, MYCN,c1orf61) and genes involved in NOTCH (DLL1/3 HES5/6), glutamate re- ceptor (SLC17A8,SLC17A6), and axonal guidance (TUBB2B/
3/4A,SEMA6A) signaling, were most highly expressed and hy- pomethylated in group 1 ATRTs. BMP signaling (BMP4,BAMBI, GDF5, FOXC1) and mesenchymal differentiation (SERPINF1, CLDN10,FBN2,MSX1,PDGFRB) genes were most differentially expressed and methylated in group 2A/B tumors (Figure 3C;
Table S7). Group 2A tumors were further distinguished by enrichment of visual cortex/hindbrain development (OTX2), retinol (RBP1,RBP7,RDH5,RDH10), and tyrosine (TYR) meta- bolism genes, while upregulation ofMYCandHOXB/Cclusters was seen in group 2B tumors (Figure 3C). Detailed analyses showed high concordance of CpG methylation patterns at promoters with ATRT subtypes, thus suggesting epigenetic regulation of developmental/cell lineage signaling pathways in ATRTs (Figures 3D and S5). Interestingly, while many group 2A enriched genes had functions in pluripotency and EMT, group 2B ATRTs exhibited heterogeneous profiles with enrich- ment of interferon signaling, cell adhesion, and cytoskeletal genes (Figure 3B).
To further investigate the distinct functional epigenome of ATRT subgroups, we performed high-resolution, genome-wide chromatin accessibility mapping using the assay for trans- posase-accessible chromatin (ATAC)-sequencing (ATAC-seq) analyses on five primary tumors (two group 1 and 2A, one group 2B) and four ATRT cell lines. In keeping with methylation and transcriptional analyses, principle component and correlation
(B) Circos plot of recurrent structural alterations, including SCNAs and gene rearrangements, from integrated WGS, RNA-seq, SNP, and 450k methylation array copy number data of 180 primary ATRTs.
(C) Schema ofSMARCB1alterations relative to DNA binding domain (DBD) and repeat regions 1 and 2 (Rp1 and Rp2) domains in the SMARCB1 protein.
(D) Schema of a chr22q intrachromosomal fusion ofSMARCB1exon 5 (gray) andHORMAD2exon 11 (orange) identified by RNA-seq in ATRT T51 with consensus sequence and RT-PCR and Sanger sequencing validation of the fusion mRNA.
(E) Schematic of a chr22q intrachromosomal translocation involvingSMARCB1intron 5 (gray) andGTPBP1intron 1 (blue) identified by WES in ATRT T12 with CREST predicted mRNA consensus sequence of respective gene fragments and PCR and Sanger sequencing validation of breakpoint.
See alsoFigure S1,Tables S1,S2,S3,S4, andS5.
Figure 2. ATRTs Comprise Three Epigenetic Subgroups with Distinct Clinical Profiles and Genotypes
(A and B) ATRTs were classified by unsupervised consensus hierarchical (HCL) and non-negative matrix factorization (NMF) cluster analyses of 450k methylation array (A) or Illumina HT12 gene expression array data (B). Adjusted Rand Index indicates concordance in methylation and gene expression clusters. Most stable tumor grouping indicated by highest cophenetic coefficient (Coph. Coef; k = 3) with 250 genes and 10,000 methylation probes are shown.
(C) Clinical, molecular, and genotypic features of 177 primary ATRTs. Tumor subgroups determined by methylation or gene expression are indicated by red (group 1), blue (group 2A), green (group 2B) or gray (group not available) bars; clinical (tumor location, patient age, metastatic status), global patterns of CNAs (chromosomal or subchromosomal/focal), and type ofSMARCB1alterations in individual tumors are indicated. Clinical or molecular features with significant subgroup correlation are indicated in red.SMARCB1alterations were classified as focal (point mutations, small indels, intergenic deletions) or broad (intragenic events, large deletions).
(D) Tumor location, median age, and age distribution in ATRT subgroups. Boxplot middle represents median, box boundaries represent first and third quartiles, and whiskers represent 10thand 90thpercentiles.
See alsoFigures S2, S3, andTable S6.
896 Cancer Cell30, 891–908, December 12, 2016
(legend on next page)
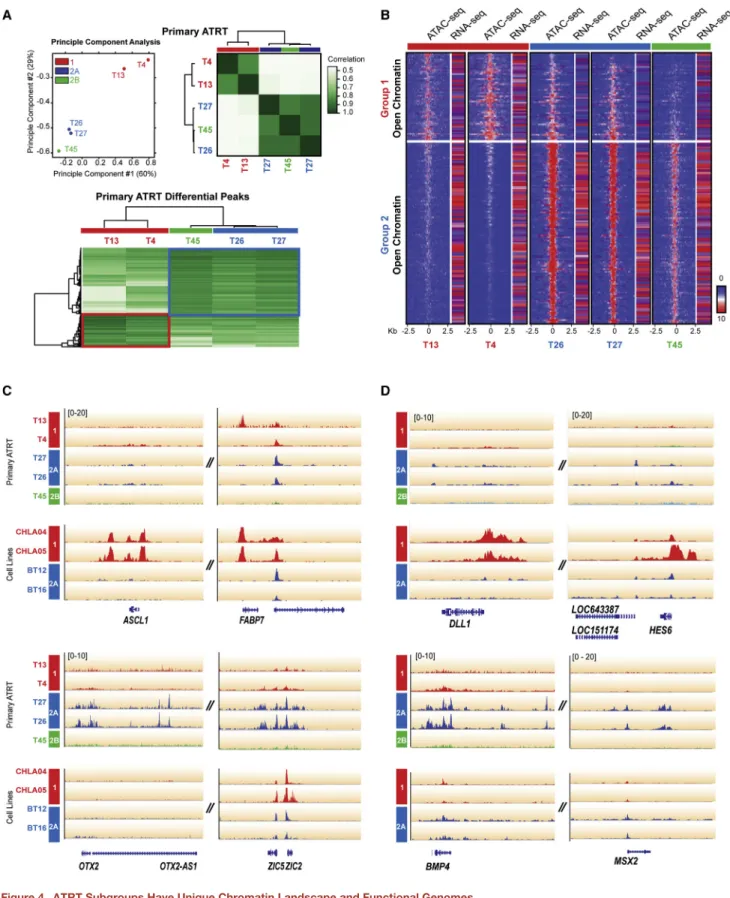
analysis of primary ATRT ATAC-seq data showed segregation and association of ATRT subtypes with distinct ATAC-seq pro- files (Figure 4A;Table S8). Integration of ATAC-seq footprints with RNA-seq data revealed open chromatin landscape in group 2A ATRTs that correlated with generally increased gene expression patterns in contrast to more closed chromatin land- scapes and decreased gene expression patterns in group 1 tumors, while group 2B ATRTs exhibited an intermediate pro- file (Figure 4B). Specifically, we observed that group 1 (ASCL1, FABP7) and group 2A/B (OTX2, ZIC1/4, ZIC5/2) cell lineage genes and multiple signaling genes including ligands of NOTCH (DLL1,HES6) and BMP (BMP4,MSX2) pathways displayed open chromatin in a subtype-specific pattern. ATAC-seq analyses of ATRT cell lines showed similar patterns indicating that subgroup lineage and signaling features were maintained in cell lines (Figures 4C and 4D). These data suggest that ATRT subgroups and SMARCB1 genotypes correlate with distinct functional epigenomes and indicate that epigenomic mechanisms drive lineage-specific gene expression and potential targetable thera- peutic pathways in ATRTs.
NOTCH and BMP Signaling Drive ATRT Subgroup- Specific Cell Growth
To investigate subtype-specific therapies, we used expression profiling to determine molecular grouping of ten ATRT cell lines including 78C and 34C, respectively, derived from tumors T13 (group 1), T45 (group 2B), and established lines CHLA02, CHLA04, CHLA05, CHLA06, CHLA266, BT12, BT16, and SH. Prediction analysis of microarray (PAM) analyses of gene expression data from primary ATRTs reproducibly classified cell lines into subgroups 1 and 2 which, respectively, showed enrichment of neurogenic/NOTCH and mesenchymal/BMP signaling genes seen in corresponding primary ATRT subtypes.
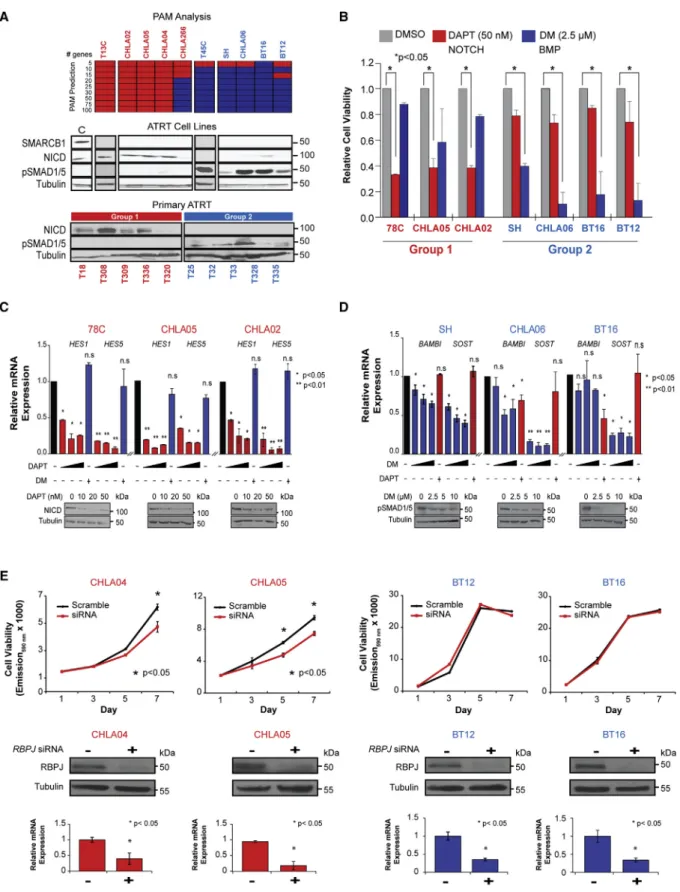
Western blot analyses confirmed expression of NOTCH intracel- lular domain (NICD) and phosphorylated SMAD1/5 (pSMAD1/5), respective effectors of NOTCH and BMP signaling in primary group 1 and 2 ATRTs and corresponding cell lines (Figure 5A), indicating that subtype signaling pathways were maintained.
To evaluate functional significance of NOTCH and BMP signaling, we used DAPT (N-[N-(3,5-difluorophenacetyl)-L-alanyl]- S-phenylglycine t-butyl ester), a g-secretase inhibitor (Geling et al., 2002), and dorsomorphin (DM) (Yu et al., 2008) to, respec- tively, assess effects of NOTCH and BMP inhibition on a panel of group 1 (78C, CHLA05, CHLA02) and group 2A/B (SH, CHLA06, BT16) cell lines with most consistent growth phenotypes. Cell viability assays showed robust dose-dependent growth inhibition of group 1 and 2 cell lines with DAPT and DM treatment, respec- tively (Figures 5B andS6A), while cross-treatment of group 1 and
2 cell lines respectively with DM and DAPT had insignificant growth effects. Western blot and qRT-PCR analyses confirmed growth inhibition by DAPT correlated with dose-dependent downregulation of NICD and NOTCH transcriptional targets HES1andHES5in group 1 lines (Figures 5C andS6B). Similarly, we observed a dose-dependent decrease in pSMAD1/5 and BMP target genesSOSTandBAMBIin group 2 cell lines (Figures 5D andS6B). Changes in NICD and pSMAD1/5 levels after DAPT and DM treatments also correlated with increased cell death in TUNEL assays (Figure S6C). We confirmed that the growth effects of g-secretase inhibitors were mediated via NOTCH signaling in group 1 cells using siRNA-mediated knockdown of the NOTCH effector RBPJ, which significantly diminished growth of group 1 (CHLA04/05) but not group 2 cell lines (BT12/BT16) (Figure 5E). These data collectively indicate that NOTCH and BMP are important ATRT subgroup-specific survival pathways and attractive pharmacologic targets.
Epigenetic Regulation of an Enhancer Element Underlies Group 2 ATRT Sensitivity to Pharmacologic Inhibitors of PDGFRB Signaling
Recent studies report promising therapies targeting various epigenetic and signaling pathways in ATRTs (Ginn and Gajjar, 2012); however, the relevance of these agents to ATRT subtypes is unknown as prior studies examined a few cell lines. To identify additional subgroup-specific targets, we tested the effects of 14 small molecules targeting epigenetic pathways on growth of three group 1 (CHLA04, 02, 05) and five group 2 ATRT (CHLA266/06, SH, BT16/12) lines (Figure S7A). We selected small-molecule inhibitors with well-defined in vitro cellular activity that target Bromo/BET domain proteins (JQ1, PFI-1,2 GSK2801, SGC- CBP30), methyltransferases (GSK343, UNC1999, UNC0642, UNC0638, A-366, J4, DOT1L, LLY507), and histone deacetylases (LAQ824). Cell viability assays showed that five of the 14 com- pounds had consistent significant effects on cell growth (>30%
reduction in cell viability), including UNC0638, UNC1999, JQ1, LAQ824, and J4. LAQ824 and J4 significantly diminished growth of all cell lines. In contrast, UNC0638, UNC1999, and JQ1 treat- ment induced >30% reduction in viability of all three group 1 cell lines but did not affect three out of five group 2 cell lines (Figures 6A, 6B,S7A, and S7B). Interestingly, gene expression analyses showed thatEHMT2(encodes G9a),EZH2,BRD4, and related loci (BRD1-BRD7) were highly expressed across all ATRTs (data not shown), and suggest that therapeutic sensitivity to epigenetic inhibitors may be dependent on a distinct functional chromatin landscape in ATRT subtypes.
Dasatinib and nilotinib are ATP-competitive small-molecule multi-tyrosine kinase inhibitors (TKIs) of BCR-ABL fusion protein,
Figure 3. ATRT Subgroups have Distinct Lineage-Enriched Transcriptional and Methylation Signatures
(A) Starburst plot of ATRT subgroup-specific genes with reciprocal changes in methylation (x axis) and gene expression (y axis). Genes associated with group 1 (left panel; red), group 2A (middle panel; blue), and group 2B (right panel; green) ATRTs are highlighted.
(B) Top ten (top axis) enriched pathways for each subgroup was determined by ingenuity pathway analysis (IPA) of subgroup-specific genes with ±2-fold difference in expression; relative enrichment of pathways is shown on bottom axis.
(C) Gene expression heatmap of subgroup-enriched neural/mesenchymal lineage and NOTCH/BMP/HOX signaling genes in ATRT determined by supervised t test with FDR correction. Genes enriched in individual subgroups, or shared by subgroups 2A and 2B are shown by solid and dashed boxes, respectively.
(D) Heatmaps show methylation levels of representative lineage genes in ATRT subgroups; methylation status of probes inASCL1,OTX2, andHOXB2are shown relative to transcriptional start sites.
See alsoFigures S4, S5, andTable S7.
898 Cancer Cell30, 891–908, December 12, 2016
Figure 4. ATRT Subgroups Have Unique Chromatin Landscape and Functional Genomes
(A) Principle component analysis (PCA) and correlation analysis of ATAC-seq data from five primary ATRTs. Aligned sequence reads from ATAC-seq profiling were converted to peak tag counts using HOMER software for PCA and correlation analysis using DiffBind software; color gradients indicate sample relatedness.
Heatmap shows peaks enriched in group 1 and 2 ATRTs.
(legend continued on next page)
stem cell factor receptor, platelet-derived growth factor receptor (PDGFR), and Src family kinases (Rix et al., 2007). Both drugs are widely used in treatment of leukemia (Kantarjian et al., 2006) and some solid tumors (Araujo and Logothetis, 2010) but have not been extensively investigated in pediatric brain tumors.
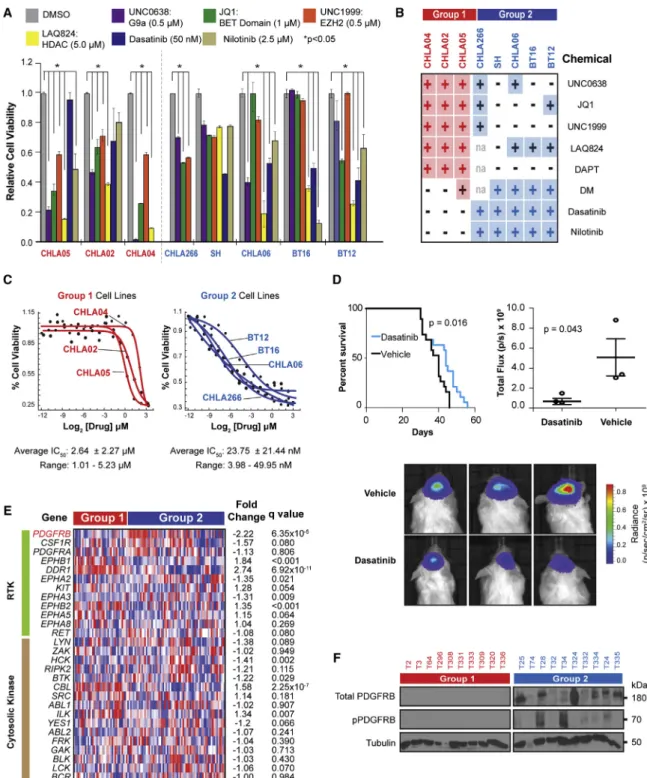
We therefore tested the sensitivity of ATRT cell lines to dasatinib and nilotinib as gene expression data indicated thatPDGFRB was most differentially expressed between ATRT subgroups. In contrast to the relative insensitivity of group 2 ATRTs to epige- netic inhibitors, the growth of all five group 2 cell lines tested, including CHLA266 that was reported previously to be dasatinib sensitive (Kolb et al., 2008), was robustly diminished after dasa- tinib and nilotinib treatment (Figures 6A and 6B). Importantly, neither drug significantly affected the growth of group 1 cell lines.
The well-characterized pharmacology of these drugs make them ideal candidates for clinical translation, hence we sought to further investigate the pharmacologic properties and mecha- nisms underlying the robust effect of both drugs on group 2 ATRT cell growth. Half-maximal inhibitory concentration (IC50) assays revealed group 2 cell lines were up to 1,000 times more sensitive to dasatinib than group 1 cell lines (IC50range 1.01 ± 0.02 to 5.23 ± 0.13mM versus 3.98 ± 0.90 to 49.95 nM for group 1 and 2, respectively) (Figure 6C). As there are no reports of dasatinib efficacy in brain tumors, we tested dasatinib treatment in vivo using a BT16 orthotopic xenograft model which recapitu- lates classical rhabdoid morphology (Figure S7C) with predict- able engraftment rates. Mice with BT16 xenografts treated with daily intraperitoneal dasatinib (30 mg/kg) injections for 2 weeks had significantly prolonged survival compared with vehicle- treated controls (Figure 6D). Bioluminescence imaging (BLI) of a subset of tumor-bearing mice showed that drug treatment correlated significantly with decreased BLI signals (p = 0.043;
Figure 6D).
To investigate mechanisms for dasatinib sensitivity, we compared expression of known dasatinib targets in ATRT sub- types. Integrated analyses identifiedPDGFRBas the most sig- nificantly differentially expressed locus in group 2 versus group 1 ATRTs (>2-fold change, p = 6.35310 5) (Figure 6E), which was confirmed by western blot analyses of primary ATRTs (Fig- ure 6F).CSF1R, which also encodes a potential dasatinib/nilo- tinib target and maps next toPDGFRB, was not differentially expressed or methylated in primary tumors or cell lines. These findings suggested that differential epigenetic regulation leading toPDGFRBupregulation may underlie the distinct sensitivity of group 2 cells to dasatinib and nilotinib. Consistent with high PDGFRBexpression in group 2 ATRTs, ATAC-seq analyses re- vealed open chromatin at the PDGFRB but not the CSF1R promoter, specifically in group 2 primary tumors and cell lines (Figures 7A and 7B). Interestingly, ATAC-seq analyses also iden- tified a distinct region of open chromatin in group 2 tumors and cell lines that corresponded to a potential regulatory domain
50 kb upstream of the PDGFRB promoter within exon 1 of CSF1R (chr5:149,491,285-149,493,716) (Figures 7A and 7B).
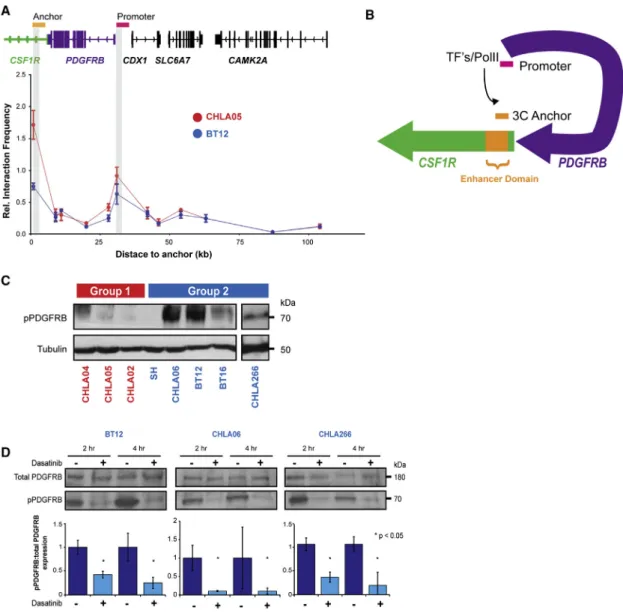
To examine whether juxtaposition of the PDGFRB promoter and putative enhancer by chromatin looping underliesPDGFRB upregulation in group 2 ATRTs, we performed C3D analyses on primary tumor ATAC-seq data to evaluate the probability of peak associations (Thurman et al., 2012). The Pearson correlation co- efficient calculated for ATAC-seq peaks within a 500 kb window of the PDGFRBpromoter showed significant correlations be- tween the PDGFRB promoter and putative enhancer only in group 2 tumors, T26 (0.5170; p < 0.0001) and T27 (0.3028; p = 0.0067) (Figure 7C), and strongly supported direct interaction of thePDGFRBpromoter and putative enhancer specifically in group 2 ATRTs. Detailed analyses ofCSF1RandPDGFRBre- vealed hypomethylation of six CG residues within the putative enhancer in group 2 tumors and cell lines that correlated signif- icantly with PDGFRBbut not CSF1R expression (Figure 7D).
Alignment with ENCODE data indicated features characteristic of enhancers in this region (Filippova et al., 1996; Malik et al., 2014), including differential H3KMe1, H3K4Me3, and H3K27Ac marks, and binding sites for multiple transcription factors including Myc network proteins, FOS and CTCF (Figures 7A andS8A). Together with the significant enrichment ofMYCand FOSexpression seen in group 2 ATRTs (Figure S8B), these find- ings suggest that differential epigenetic regulation of the putative enhancer underliesPDGFRBupregulation and distinct group 2 ATRT sensitivity to dasatinib and nilotinib. To confirm and map the putativePDGFRBenhancer, we performed H3K27Ac chro- matin immunoprecipitation sequencing (ChIP-seq) on two dasa- tinib/nilotinib-resistant group 1 (CHLA04, 05) cell lines and a representative dasatinib/nilotinib-sensitive group 2 (BT12) cell line. Peak analyses showed that enriched H3K27Ac marks aligned with the predicted enhancer region only in group 2 lines, indicating enhancer activity only in group 2 ATRT cells (Fig- ure 7B). 3C analyses revealed co-enrichment of probes mapping to the PDGFRBenhancer and promoter regions in BT12 and CHLA05 cells (Figure 8A). Of note, a second peak in thePDGFRB gene body was not associated with H3K27Ac enrichment in BT12 cells. Taken together with the enrichment of H3K27Ac marks at the putative PDGFRB enhancer in BT12 but not CHLA04 and 05 cells, these data indicate that direct interac- tion of a distant active enhancer and promoter via chromatin looping facilitatesPDGRBexpression in group 2 ATRT cells (Fig- ure 8B). Consistent with these observations, western blot ana- lyses showed high phospho-PDGFRB (pPDGFRB) expression in group 2, but not group 1 ATRT cell lines (Figure 8C), and robust downregulation of pPDGFRB after dasatinib treatment in group 2 cells (Figure 8D). Collectively, our results suggest that epigenetic regulation via differential methylation of aPDGFRB-associated enhancer specifically drives the sensitivity of group 2 ATRTs to small-molecule inhibitors of the PDGFRB signaling axis and
(B) Genome-wide chromatin openness profiles of group 1 (T4, 13), 2A (T26, 27), and 2B (T45) ATRTs. Differentially open chromatin peaks (FDR < 0.5) were identified using DiffBind analysis of ATAC-seq data. Heatmap shows average read density in 20 bp bins (range ±2.5 kb from peak center) and FPKM values of corresponding genes in individual tumors determined by RNA-seq. The color scale is proportional to read enrichment and normalized between ChIP-seq experiments relative to input DNA.
(C and D) ATAC-seq alignment tracks for subgroup-specific lineage (C) and signaling (D) genes in primary tumors and cell lines. Gene tracks are shown relative to hg19 RefSeq annotation and ATRT molecular group (red, 1; blue, 2A; green, 2B).
See alsoTable S8.
900 Cancer Cell30, 891–908, December 12, 2016
Figure 5. NOTCH and BMP Inhibitors Have Subgroup-Specific Effects on ATRT Cell Growth
(A) Molecular subtype of ten ATRT cell lines is shown with a heatmap of PAM predicted gene classifiers based on primary ATRT gene expression data and western blot analyses of NOTCH intracellular domain (NICD) and pSMAD1/5 expression in cell lines and primary tumors. UW228 medulloblastoma cell line served as a control (C) for SMARCB1 expression; tubulin served as loading control.
(legend continued on next page)
indicate that dasatinib/nilotinib are important agents for the particularly lethal group 2 ATRTs.
DISCUSSION
ATRTs are highly malignant cancers with substantial heteroge- neity in disease presentation and poorly defined biology for which best therapeutic approaches are undefined. Here, we demonstrate that ATRTs comprise three epigenetic subtypes that correlate with distinct tumor locations, patient age, line- age-enriched methylation and transcriptional signatures, and unique global and SMARCB1-specific genotypes. Our data reveal that ATRT subgroups are associated with a distinct epige- nomic landscape and sensitivity to inhibitors of NOTCH, BMP, PDGFRB, and epigenetic signaling. Significantly, we discovered that differential methylation of aPDGFRBenhancer underlies the robust and distinct sensitivity of group 2 ATRTs to dasatinib and nilotinib, two well-characterized and widely used cancer drugs.
Cumulative studies indicate that a convergence of epigenomic features reflecting cellular origins and specific somatic alter- ations underlies diverse tumor phenotypes (Feinberg et al., 2006). Here, we observed that ATRTs segregate into subtypes with specific lineage-enriched methylation signatures, distinct tumor location, and age of presentation suggestive of origins from different neural progenitors. In the predominantly supra- tentorial group 1 ATRTs, we observed distinct methylation and enrichment of neurogenic loci including forebrain markers LHX2(Roy et al., 2014) andMEIS2 (Cecconi et al., 1997), as well asFABP7andASCL1, markers of radial glial neural progen- itors (Anthony et al., 2004), indicating these as potential cell of origins for group 1 ATRTs. In contrast, differentially methylated and expressed loci in group 2 ATRTs were primarily mesen- chymal lineage/signaling (BMP/PDGFRB) and mid/hindbrain development (ZIC1, -2,-4,-5,OTX2,HOXB/C) genes and sug- gest that group 2A/B ATRTs, which are primarily infratentorial and spinal tumors, develop from mid/hindbrain neural pro- genitors. Enrichment of neuronal development pathways in group 1 tumors contrasted with a dominance of stem cell differ- entiation and pluripotency pathways in group 2A ATRTs. We also observed that, in contrast to group 1 and 2B, group 2A tu- mors were associated with global CpG island hypomethylation, a more open chromatin landscape and overall increased gene expression patterns reminiscent of more primitive cell types.
These data further suggest that group 2A tumors, which arise in the youngest patients (12.00 months 95% CI = 11.05–13.00), originate from highly primitive neural precursors. Our findings corroborate a recent study that also reported three epigenetic subtypes of ATRTs with distinct enhancer landscapes (Johann
et al., 2016), and a study of murine ATRTs derived from a condi- tional ROSA-Cre model (Han et al., 2016). Our data revealed that ATRTs have rare coding mutations but exhibit subtype-en- riched patterns of CNAs andSMARCB1genotypes, and suggest different mechanisms of tumor initiation and progression in ATRT subtypes. NotablySMARCB1deletions in group 2B ATRTs were frequently accompanied by copy number-driven gene expres- sion changes in candidate modifier loci with neurogenic and epigenetic functions, includingBCR,MKL, andEP300(Kaartinen et al., 2001).
As ATRTs lack other recurrent coding alterations, there has been substantial interest in epigenetic therapies for ATRTs.
Specifically, promising studies of EZH2 (Knutson et al., 2013) and BET domain (Tang et al., 2014) inhibitors have been re- ported. Intriguingly, while our screen of small epigenetic in- hibitors confirmed the therapeutic effects of UNC1999 and JQ1, respectively EZH2 and BET domain inhibitors, we observed growth inhibitory effects predominantly in group 1 lines. Simi- larly, we observed that only group 1 lines were sensitive to UNC0638, a chemical compound for histone methyl trans- ferase G9a, while LAQ824, a histone acetylase inhibitor, dimin- ished growth in all cell lines. These findings may reflect more general epigenetic functions of histone deacetylases versus histone methyl transferases. Interestingly, the cellular responses to epigenetic compounds overlapped with the sensitivity to inhibitors of NOTCH and BMP signaling pathways, critical medi- ators of lineage-specific progenitor cell survival (Ericson et al., 1998). Specifically, group 1 cells with neurogenic transcriptional and epigenomic profiles were sensitive to DAPT, UNC0638, and UNC1999, while group 2 cell lines with limited features of neural differentiation were largely insensitive to these three inhib- itors. In contrast, we observed a distinct sensitivity of group 2 cell lines to inhibitors of BMP and PDGFRB, both mediators of mesenchymal signaling. Of note, recent reports indicate a func- tional and physical interaction of the G9a/GLP and polycomb repressive complex 2 (PRC2) epigenetic silencing machineries and co-regulation of neuronal developmental genes by G9a and PRC2 (Mozzetta et al., 2014). These observations collec- tively indicate that lineage-associated epigenomic landscapes of ATRTs have critical implications for the development of ATRT subtype-specific therapies. Future investigations to define contributions of other epigenetic modifiers implicated by our genomic and experimental data will clearly be important for informing the development of ATRT therapies.
Our data extend an earlier report of PDGFRA/B expression in some ATRTs and rhabdoid tumor sensitivity to TKIs (Koos et al., 2010). Here, we observed that nilotinib and dasatinib have growth inhibitory effects only in group 2 ATRT cells,
(B) MTS assays of group 1 and 2 cell lines respectively at 3 and 5 days post-treatment with DAPT and dorsomorphin (DM), cell viability is normalized to DMSO- treated controls.
(C and D) Effect of DAPT and DM on NOTCH and BMP signaling in ATRT cells was confirmed by qRT-PCR analyses of respective target genes and western blot analyses for NICD and pSMAD1/5 in group 1 (C) and group 2 (D) cell lines treated with increasing doses (black triangles) of DAPT or DM, and cross-treated with a single dose of DM or DAPT; ± signs indicate presence or absence of specific drugs. mRNA levels are normalized to actin, and to carrier treated controls (black bars). Significance was calculated using Student’s t test.
(E) Cell viability of group 1 (CHLA04, 05) and group 2 (BT12, 16) cell lines treated with RBPJ (25 nM) and scrambled control (20 nM) siRNA were assessed using Alamar blue assays; western blot and qRT-PCR analyses confirmed RBPJ knockdown.
Error bars show ±SEM (n = 3).
See alsoFigure S6.
902 Cancer Cell30, 891–908, December 12, 2016
Figure 6. Subgroup-Specific Effect of Signaling and Epigenetic Pathway Inhibitors on ATRT Cell Growth
(A) Cell viability of cell lines treated with indicated small molecules for 7 days was determined by the MTS assays relative to DMSO controls over 5–7 days. Error bars show ±SEM (n = 3).
(B) Summary of MTS assays for cell lines treated with indicated chemicals. + and indicate > or <30% reduction in cell viability, respectively.
(C) Group 1 and 2 cell lines were treated with 0.3 nM–10mM dasatinib; IC50was determined using Alamar blue assays at day 6 post-treatment.
(D) Kaplan-Meier survival analysis of mice with orthotopic BT12 cell line xenografts treated with 30 mg/kg intraperitoneal dasatinib injections for 2 weeks. Dot plot (middle bar represents mean, whiskers represent 10thand 90thpercentiles) and BLI images depicting tumor mass at day 21 post-injection in three representative control and treated mice. Differences in survival and tumor growth were assessed using log rank (Mantel-Cox) test and ANOVA analysis, respectively.
(E) Gene expression heatmap ofPDGFRB(red) and putative receptor (green) and cytosolic tyrosine kinase (brown) targets of dasatinib/nilotinib in ATRTs.
Significance was determined by FDR adjusted Student’s t test.
(F) Western blot analyses of total and pPDGFRB in primary ATRTs.
See alsoFigure S7.
(legend on next page)
904 Cancer Cell30, 891–908, December 12, 2016
including the CHLA266 cell line reported previously to be dasa- tinib sensitive (Kolb et al., 2008). Importantly, our studies show that dasatinib significantly prolongs the survival of mice with or- thotopic group 2 ATRT xenografts, thus indicating that dasatinib can accumulate at a sufficient concentration for tyrosine kinase inhibition in brain tumors. Our studies also suggest that PDGFRB expression is a promising biomarker for dasatinib sensitivity in ATRTs. These findings have significant implications for ATRT treatment as the safety and efficacy of dasatinib are established in adults and children. Interestingly, consistent with the reported enrichment of BMP signaling/mesenchymal lineage genes in non-CNS RTs (Birks et al., 2011; Chun et al., 2016; Gadd et al., 2010), we observed an overlap in the methylation profiles of non-CNS RTs and group 2 ATRTs (data not shown), which sug- gests that some group 2 ATRTs and non-CNS tumors character- istically seen in very young children with rhabdoid predisposition syndrome, may have common or closely related cellular origins.
Indeed, we observed that dasatinib and nilotinib also robustly in- hibited the growth of G401, a renal RT cell line (data not shown) and suggest potential roles for dasatinib and nilotinib in non-CNS RT treatment.
Despite evidence of a critical etiologic role forSMARCB1in RT initiation, the pathobiology of ATRTs remains poorly elucidated.
Our data suggest thatSMARCB1loss via diverse mechanisms in different cellular contexts, together with additional epigenetic and genetic events, underlies the clinical heterogeneity of human ATRTs. These observations have significant implications for the fundamental understanding and targeting of SWI/SNF func- tion in neoplastic growth and clinical management of ATRTs.
Specifically, our analyses, which reveal a spectrum of alterations throughoutSMARCB1, indicate that current diagnostic methods may underestimate the frequency ofSMARCB1 alterations in ATRTs. We have identified known and potential drugs and drug-like inhibitors with different therapeutic effects in molecular subtypes of ATRTs. In addition to nominating dasatinib and nilo- tinib as promising repurposed drugs for ATRTs, our comprehen- sive characterization of ATRT cell lines provides a rich resource for the further development of other candidate ATRT drugs. Most importantly, our study underscores the significant limitations of current chemoradiotherapeutic regimens used uniformly for all ATRT patients. Together with our earlier observations that indi- cate differential outcomes for molecular subtypes of ATRTs, our study provides a critical framework for informing pre-clinical
studies as well as risk- and biology-stratified clinical trials for ATRTs.
EXPERIMENTAL PROCEDURES Tumor and Patient Information
All tumors and clinical information were collected through an international collaborative network (seeSupplemental Experimental Procedures) with con- sent as per protocols approved by the Hospital Research Ethics Board at participating institutions. In total, 194 CNS (191 primary and 3 recurrent) and 9 non-CNS RT samples were collected for genomic analyses (Table S3). All ATRTs were diagnosed according to the World Health Organization CNS tumor classification criteria (Louis and Wiestler, 2007) and confirmed by BAF47 immu- nostains (BD Biosciences, catalog no. 612110). BiallelicSMARCB1alterations were confirmed using FISH, MLPA, targeted exons 1–9 Sanger sequencing, or WGS/WES analyses. DNA or RNA from snap frozen tumor were investigated with one or more of WGS/WES, RNA-seq and high-resolution copy number/
SNP, gene expression, and methylation array analyses; 123 samples with DNA from formalin-fixed, paraffin-embedded materials were analyzed with the Illumina 450k methylation arrays. Animal studies were conducted in accor- dance with the policies and regulations for ethical treatment of animals approved for the Toronto Center for Phenogenomics.
Statistical Analyses
Difference in nucleotide transition/transversion rates from WGS SNV calls were determined using the two-proportion Z test with Yates’ correction for continuity. Significance of differences in gender, location, metastasis, and individual genomic loci between ATRT subgroups were analyzed using a two-sided Fisher’s exact test. The Kruskal-Wallis test was used to assess the significance of tumor subgroups in relation to age and counts of genomic alterations. Student’s t test and the Mann-Whitney-Wilcoxon test with false discovery rate (FDR) correction were used, respectively, to test for differences in gene expression and methylation between groups. All analyses were con- ducted in the R statistical environment (v2.15.2) or with SPSS version 22.0.
A p value of <0.05 was regarded as significant for all analyses.
ACCESSION NUMBERS
Data for whole-genome/exome DNA and RNA sequencing, ChIP sequencing for H3K27Ac, ATAC sequencing, gene expression, methylation and SNP gen- otyping array data have been deposited at the European Genome-Phenome Archive, EGA Study Accession ID EGAS00001000506.
SUPPLEMENTAL INFORMATION
Supplemental Information includes Supplemental Experimental Procedures, eight figures, and eight tables and can be found with this article online at http://dx.doi.org/10.1016/j.ccell.2016.11.003.
Figure 7. APDGFRBEnhancer Element Exhibits Differential Methylation and Chromatin Association in Group 2 ATRTs
(A) Schema ofCSF1R(green) andPDGFRB(purple) relative to UCSC and/or ENCODE tracks and flanking genes (chr5:149,370,252-149,566,612) with a zoomed view of putative enhancer relative to exon 1 and gene body ofCSF1R(blue) andPDGFRBpromoter (purple) (chr5:149,479,360-149,545,365), 450k probe lo- cations, DNaseI hypersensitivity, and ENCODE cell line tracks for H3K27Ac, H3K4Me1, and H3K4Me3 ChIP-seq data. Probes inPDGFRBpromoter and putative enhancer with relative hypomethylation in group 2 ATRTs is shown in red font and dashed pink and orange boxes.
(B) ATAC-seq signal forCSF1R/PDGFRBin primary ATRTs and cell line data is shown with C3D predicted associations (curved lines) ofPDGFRBenhancer and promoter (boxed). Bottom track shows H3K27Ac ChIP-seq signal for BT12, a dasatinib-sensitive group 2 cell line. Group 1, 2A, and 2B primary ATRTs and cell lines are indicated in red, blue, and green, respectively.
(C) Correlation matrix of associated open chromatin regions in a 120 kb window around thePDGFRBpromoter predicted by C3D analysis of ATAC-seq data from tumors T26 (top panel) and T27 (bottom panel). Absolute correlation is shown proportional to size of colored squares, positive and negative correlations are indicated in blue and red, respectively. All correlations were tested within a 500 kb window ofPDGFRBpromoter and adjusted for statistical significance (FDR method); blank squares indicate insignificant correlations.
(D) Pearson’s correlation/linear regression analyses ofPDGFRBandCSF1Rgene expression (log2, y axis) and methylation levels (bvalue, x axis) at the enhancer domain,PDGFRBgene body, North (N) shore, CpG island, andPDGFRBpromoter. Location of differentially methylatedCSF1R-PDGFRBprobes based on 450k array data of 75 ATRTs is schematized.
See alsoFigure S8.
AUTHOR CONTRIBUTIONS
A.H., D.D.C., N.J., and J.T.R. conceived the projects. J.T. analyzed WGS/
WES data assisted by L.L., M.B., S.M., A.V., B.G., M.D., P.S.C., and super- vised by A.H., G.D.B., A.M., G.Bu., N.J., and M.Br. A.H. supervised RNA-seq analyses by J.T., D.M.G., and J.D.N.; gene expression and correlative ana- lyses were carried out by J.T. with assistance from D.P. and G.D.B.; methyl- ation data were collected by J.T. with assistance from D.P. and D.K.Q. ATAC and ChIP assays were performed by S.F., C.Z., K.C.H., T.M., and N.R.A. un- der supervision of D.D.C. Cellular, biochemical assays, and xenograft studies were performed by B.G., L.G., P.A., and K.C.H. with help from N.R.A., M.L., and M.Y. and supervised by A.H. A.C.P. performed 3C experiments super- vised by D.D.C. J.T. performed analysis of ChIP and ATAC-seq data super- vised by A.H. and D.D.C. in consultation with Ma.L. and P.G. Sequencing
validation was performed under supervision of A.M., all other validation ex- periments were performed by B.G. and K.C.H. with assistance from T.S.C., A.N.R., and M.Y. under the supervision of A.H. and J.T.R. D.B., L.L.-C., Y.R., V.R., M.R., C.P.D., S.Y., H.-k.N., J.L., S.A., J.P., J.A.C., G.R.S., C.C.F., L.R., M.F., L.M.H., A.S.M., Y.W., S.A.C., J.R.H., D.C., D.K.B., N.F., D.S., A.K., M.G., P.H., T.H., L.B., B.W., J.H., A.C., T.E.V., E.I.H., S.C., H.N., H.T., I.F., H.D., D.F., T.W., C.F., D.D.E., K.S., D.J., J.M., S.Z., R.H., D.A.R., A.J..F., N.S., N.L., S.H., R.R.L., J.R.F., U.B., R.G., Da.M., U.S., T.N., T.T., J.Ph., J.Ma., S.Af., A.T.R., M.W.M., J.C.M., S.R., Y.G.G., M.D.T., U.T., T.P., A.R.J., E.B., S.K., A.E., P.D., and C.H.A. provided tumor mate- rials/clinical data, and/or cell lines used in this study. Statistical analyses were performed by J.T. Histopathological analyses were performed by C.E.H. and M.Ba. J.T. and A.H. wrote the manuscript with input from B.G., D.D.C., N.J., and J.T.R.
Figure 8. A Promoter-Enhancer Loop RegulatesPDGFRBExpression and Confers Dasatinib/Nilotinib Sensitivity in Group 2 ATRT (A) 3C analyses ofPDGFRBenhancer:promoter interaction in ATRT cell lines CHLA05 (red) and BT12 (blue). Plot indicates relative co-amplification and interaction frequency of an anchor primer in the putative enhancer with test primers located at various distances in theCSF1R/PDGFRBgene body and promoter (gray bars).
(B) Schema of 3C analysis indicating DNA looping and direct interaction ofPDGFRBpromoter and an enhancer 50 kb upstream.
(C) Western blot analyses of pPDGFRB expression in ATRT cell lines.
(D) Western blot and corresponding densitometric analyses of total and pPDGFRB expression in group 2 cell lines post-treatment with 50 nM of dasatinib (+) and DMSO ( ). Error bars show ±SEM (n = 3).
906 Cancer Cell30, 891–908, December 12, 2016