© 2019 by Acta Neurobiologiae Experimentalis
Differential expression of the c‑fos protein and synaptophysin in zebrin II positive
and zebrin II negative cerebellar cortical areas in 4‑aminopyridine seizures
Beáta Krisztin‑Péva, András Mihály* and Zoltán Tóth
Department of Anatomy, Faculty of Medicine, University of Szeged, Szeged, Hungary,
*Email: mihaly.andras@med.u‑szeged.hu
The present study examined temporal activation patterns of rat cerebellar cortical neurons in 4‑aminopyridine induced seizures, using c‑fos protein as a marker of neuronal activity. C‑fos‑containing cells were counted in each cerebellar cortical layer, and cell count was compared between zebrin II positive and zebrin II negative bands of the lobules of the vermis and cerebellar hemispheres. We found significant activation of granule cells and interneurons of the molecular layer in zebrin II positive bands. The Purkinje cells, in contrast, exhibited non‑significant, scattered c‑fos immunoreactivity across all bands.
Fluctuation of synaptophysin expression in the mossy fibre rosettes of the granular layer was determined via light microscopic immunohistochemistry. We detected a transient, significant decrease in synaptophysin staining density following 4‑aminopyridine seizures, which may indicate short‑term synaptic depression. We also identified different timing of increased c‑fos expression in the neurons of the cerebellar cortex in different cortical zones. In particular, the activation pattern of the interneurons of the molecular layer reflected the climbing fibre distribution, reflecting the zonal olivo‑cortico‑nuclear organization. Seizure‑induced activation of the granule cells corresponded with the zebrin II positive zones. This observation raises the possibility that zebrin II positive compartments may be more susceptible to cerebellar convulsions.
Key words: cerebellum, seizure, 4‑aminopyridine, c‑fos, zebrin II, synaptophysin, rat
INTRODUCTION
Recent immunohistochemical and electrophysio‑
logical studies have revealed intrinsic heterogeneity of the cerebellar cortex (Voogd and Ruigrok, 2004a; Xiao et al., 2014). Certain molecular markers, such as the ze‑
brin II/aldose C enzyme protein (Brochu et al., 1990;
Ahn et al., 1994), the glutamate transporter excitato‑
ry amino‑acid transporter 4 (Dehnes et al., 1998), and the metabotropic glutamate receptor mGluR1b (Mateos et al., 2001), show different expression patterns across different subgroups of Purkinje cells (PCs). Further, the zebrin II positive [Z(+)] and zebrin II negative [Z(‑)] PC
groups have been shown to alternate, and form ros‑
tro‑caudally oriented bands that span the entire vermis and both hemispheres (Hawkes and Herrup, 1995). The alternation and expansion of the Z(+) and Z(‑) compart‑
ments are best visualized in frontal‑ or horizontal‑plane sections of the cerebellar cortex, or in whole‑mount cerebellar immunohistochemistry (Brochu et al., 1990;
Sillitoe and Hawkes, 2002). It has also been demonstrat‑
ed that the expression pattern of zebrin II corresponds to the modular organization of the olivo‑cortico‑nu‑
clear connections (Voogd and Ruigrok 2004a; Sugihara and Quy 2007). Other studies have shown significantly enhanced glutamate (GLU) release from the climbing fibres in the Z(+) zones (Paukert et al., 2010). On the
Received 7 December 2018, accepted 30 May 2019 Acta Neurobiol Exp 2019, 79: 239–251 DOI: 10.21307/ane‑2019‑022
other hand, stimulation of the mossy fibres (MFs) has been shown to elicit different electrophysiological re‑
sponses in the Z(+) and Z(‑) zones (Ebner et al., 2012).
The zonal distribution of synaptophysin (SYP) in the cerebellar cortex is similar to the distribution of zebrin II in the PCs (Hawkes et al., 1985; Leclerc et al., 1989).
SYP is a synaptic vesicle protein with four transmem‑
brane domains. SYP is a marker of interneuronal syn‑
apses, and its ubiquity at the synapse has led to the use of SYP immunostaining for the quantification of syn‑
apses (Li et al., 2017).
Autopsy of epileptic patients revealed a shrinkage of the cerebellar cortex, and a reduction in the num‑
ber of PCs. These findings suggest that the cerebellum is involved in neuronal hyperactivity during epilepsy (Honavar and Meldrum, 2001). Indeed, several epileptic patients present cerebellar symptoms, and cerebellar epileptic foci have been clinically demonstrated (Boop et al., 2013). The neocortico‑ponto‑cerebellar connec‑
tions often participate in these pathologies (Mohamed et al., 2011). Further, degeneration of PCs has been shown to follow the zebrin II pattern in some patholog‑
ical conditions (Cerminara et al., 2015). Our previous experiments demonstrated the primary importance of the pontocerebellar MFs in overexcitation of the cere‑
bellar cortex in epilepsy (Tóth et al., 2015). Subsequent experiments (Tóth et al., 2018) demonstrated that ion‑
otropic glutamate receptors are involved in cerebellar convulsions that were precipitated by 4‑aminopyridine (4‑AP).
In our studies, we use 4‑AP to elicit generalised ton‑
ic–clonic seizures (GTCS). 4‑AP works by blocking K+ channels in different neuronal populations, thereby increasing transmitter release and inducing epileptic
neuronal activity (Thesleff 1980; Kovács et al., 2003).
Given that the major cerebellar afferents operate with glutamic acid transmitters, the postsynaptic effects of 4‑AP elicited convulsions can be long‑lasting and can be detected with immunohistochemistry (Tóth et al., 2015;
2018). C‑fos protein immunohistochemistry can be used as marker of neuronal activity, and for semiquantitative mapping of activated neurons (Willoughby et al., 1995;
Mihály et al., 1997; Herdegen and Leah, 1998; Tóth et al., 2015). The present study aimed to examine: the timing and lobular distribution of the postsynaptic activation pattern of the cerebellar cortical neurons in 4‑AP in‑
duced seizures; the sensitivity of Z(+) and Z(‑) micro‑
domains of the cerebellar cortex to convulsive activity and the seizure‑induced expression of c‑fos protein;
and possible seizure‑induced alterations of SYP immu‑
nostaining in the MF rosettes of the granular layer.
METHODS
Animals and treatment
We used 12‑14 week‑old, male Wistar rats weighing 220 – 280 g, bred in the Central Animal House of the University of Szeged. The animals were housed under standard conditions with free access to water and food.
The experiments were conducted in accordance with the “Directive 2010/63/EU of the European Parliament and of the Council of 22 September 2010 on the Protec‑
tion of Animals Used for Scientific Purposes”. The ex‑
perimental protocol was approved by the Institutional Ethics Committee on Animal Experiments at the Facul‑
ty of Medicine, University of Szeged.
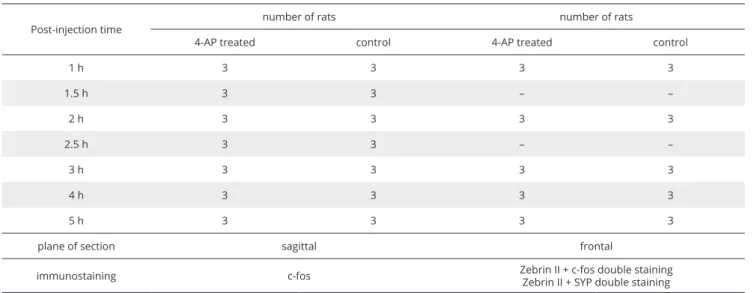
Table I. The plane of section, immunostaining method, and number of animals in each experimental group.
Post‑injection time number of rats number of rats
4‑AP treated control 4‑AP treated control
1 h 3 3 3 3
1.5 h 3 3 – –
2 h 3 3 3 3
2.5 h 3 3 – –
3 h 3 3 3 3
4 h 3 3 3 3
5 h 3 3 3 3
plane of section sagittal frontal
immunostaining c‑fos Zebrin II + c‑fos double staining
Zebrin II + SYP double staining
A total of 72 animals were used in the experiments (Table I). Seizures were induced with a single intra‑
peritoneal (i.p.) injection of 4‑AP (5 mg/kg, Sigma, St.
Louis, USA), dissolved in physiological saline at a con‑
centration of 0.67 mg/ml. This dose of 4‑AP proved to be epileptogenic in our previous investigations (Mihály et al., 1990; Szakács et al., 2003). The control group (see Table I) received a similar volume of phys‑
iological saline.
Behavioural symptoms and latency of the onset of GTCS were recorded from the time of 4‑AP injections.
At the end of the experiment (1 h, 1.5 h, 2 h, 2.5 h, 3 h, 4 h and 5 h after the injection of 4‑AP), the animals were deeply anaesthetized with halothane (Halothane, Sigma, St. Louis, USA) and perfused transcardially with 0.1 M phosphate‑buffered saline (PBS), pH 7.4, followed by 4% phosphate‑buffered paraformaldehyde, pH 7.4, as a fixative. Each time group (i.e., 1 h, 1.5 h, 2 h, 2.5 h, 3 h, 4 h and 5 h after the injection of 4‑AP) consisted of three animals treated with 4‑AP, and three control animals (Table I). The brain was subsequently removed and post‑fixed in 4% buffered paraformaldehyde for 24 h at room temperature. Following post‑fixation, the brains were cryoprotected overnight in 30% sucrose in PBS, pH 7.4, and 24 μm thick sagittal plane sections were cut from the vermis using a freezing microtome (Reichert‑Jung Cryocut 1800). Sagittal plane sections of the vermis were used to investigate seizure‑induced activation of the vermal cerebellar lobules (Tóth et al., 2015; 2018). Free‑floating tissue sections were pro‑
cessed for c‑fos immunohistochemistry.
In the second experiment, we investigated 1 h, 2 h, 3 h, 4 h and 5 h post‑injection times, again with three 4‑AP treated and three control animals in each time group. Coronal (i.e., frontal) plane frozen sections were cut from the whole cerebellum for immunohistochem‑
istry (Fig. 1). Coronal sections are needed to reveal the distribution of Z(+) and Z(‑) compartments of the cer‑
ebellar cortex (Brochu et al., 1990; Ahn et al., 1994; see also Fig. 1). The relevant characteristics of the exper‑
imental groups and immunostainings are summarized in Table I.
Immunohistochemistry
The sections were pretreated with 1.5% H2O2 and rinsed in 0.1 M PBS containing 0.2% Triton X‑100 (Sig‑
ma, St. Louis, MO, USA). Next, the sections were incu‑
bated in 20% normal pig serum for 1 h at room tem‑
perature. The primary antibody was polyclonal c‑fos antibody raised in rabbit (#sc‑52; Lot. No. J 300; Santa Cruz Biotechnology, CA, USA; 1:4000), which was fol‑
lowed by the secondary antibody, donkey anti‑rabbit
IgG (1:40; Jackson ImmunoResearch, PA, USA). Perox‑
idase–antiperoxidase (PAP) complex (dilution: 1:1000;
Jackson ImmunoResearch, PA, USA) was applied as a tertiary reagent, and the peroxidase reaction was vi‑
sualized with 3,3’‑diaminobenzidine tetrahydrochlo‑
ride (DAB; Sigma, St. Louis, MO), containing 0.3% nickel sulphate and 0.01% hydrogen peroxide (Ni‑DAB). Cell nuclei containing c‑fos were coloured black by the re‑
action product.
The primary antibody cocktails were composed of two different primary antibodies: mouse anti‑zebrin II (1:12000; Cat. No. Y 030144, Lot. No. AP 3658, ABM Inc., Canada) and rabbit anti‑c‑fos (1:4000), and mouse anti‑zebrin II (1:12000) and rabbit anti‑synaptophysin (1:3500; DAKO, Cat. No. A0010, Santa Clara, CA, USA;
see Table I). Both procedures were continued by the application of biotinylated anti‑mouse IgG (1:600; Vec‑
tor Laboratories, CA, USA) and plain donkey anti‑rab‑
bit IgG (1:40), detected with streptavidin‑peroxidase (1:2000; Vector Laboratories, CA, USA) and PAP (1:1000).
Streptavidin‑peroxidase was visualized by using plain 0.05% DAB (Sigma), with 0.01% hydrogen peroxide, yielding a brown reaction colour (zebrin II containing elements). The PAP complex, in contrast, was detected with Ni‑DAB yielding a black reaction colour (c‑fos‑ or SYP‑containing structures).
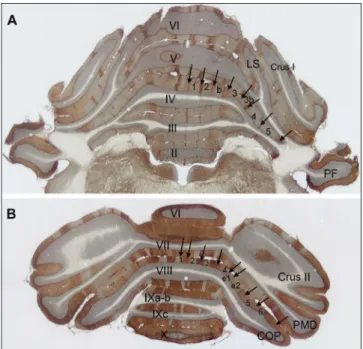
Fig. 1. Coronal plane low magnification images of double immunostained (zebrin II + c‑fos) anterior (A) and posterior lobes (B) of the cerebellum.
The Arabic numerals label the Z(‑) compartments of the fourth and eighth lobules, and the arrows indicate the intervening Z(+) bands. Abbreviations:
Roman numerals II–X: vermal lobules; a–c: sublobules; COP: copula pyramidis; Crus I and Crus II: crura of ansiform lobule; LS: simple lobule;
PF: paraflocculus; PMD: paramedian lobule. Bar: 1 mm.
Image analysis
A quantitative analysis was performed with a Nikon Eclipse 600 microscope equipped with a SPOT RT Slider digital camera (1600 × 1200 dpi in 8 bits) and using Im‑
age Pro Plus 4.5 morphometry software (Media Cyber‑
netics, Silver Spring, MD, USA). Areas of interest (AOIs) for the cell counting were selected blindly on the cap‑
tured sections, following background subtraction. For c‑fos and zebrin II immunostainings, the analysis was performed on five tissue sections from each animal. On the sagittal plane sections, the granular and PC layers were investigated in every lobule of the vermis, and the data were sorted according to cerebellar lobes.
Cell counts were completed using a 20x objective on the AOI, which was a 0.005 mm2 rectangular area of the granular layer. The number of c‑fos IR cell nuclei were corrected to a 1 mm2 tissue area (further detail is pro‑
vided in the Figure captions). Counting of the PC nuclei containing c‑fos IR was performed on the basis of the linear density of the c‑fos IR PCs. During the measure‑
ment, a freehand line was drawn through the centre of the PCs in the folium. The number of c‑fos IR cell nuclei were counted and the length of the line was also measured. The number of c‑fos IR PCs was corrected to a 1 mm PC layer length.
Double labelled sections were cut in the frontal (i.e., coronal) plane, allowing for the observation of the vermis and both hemispheres in each section (Fig. 1).
Image analysis was conducted on the first Z(‑) stripe labelled as P1(‑) (Brochu et al., 1990), and in the neigh‑
bouring P2(+) band in the anterior and posterior zones of the vermis (Fig. 1). In the hemisphere, the two most laterally situated bands were chosen, including P5(‑) and P6(+) in the anterior lobe, and P5(‑) also in the lobulus simplex (LS), the crura of the ansiform lobule (Crus I and Crus II), the paramedian lobule (PMD), P6(‑) or e2(‑) in the copula pyramidis (COP), and P7(+) in the posterior lobe (Fig. 1; Brochu et el. 1990). Image analy‑
sis was performed in the granular (0.005 mm2 rectangu‑
lar AOI) and molecular (0.01 mm2 rectangular AOI) lay‑
ers. The PC layer was counted using similar procedures to the sections of the vermis (see above). The number of c‑fos IR cell nuclei were corrected to a 1 mm2 tissue area. Zebrin II‑c‑fos double stained sections were ex‑
amined in relation to the number of c‑fos immunola‑
belled neuronal nuclei in the AOI. The zebrin II‑synap‑
tophysin labelled sections were investigated using two different methods: calculating the ratio of the SYP im‑
munoreactive area inside the AOI; and the standard op‑
tical density (OD) of SYP‑stained structures. During the determination of the density per area, the threshold was adjusted to segregate the immune‑signal from the background, and SYP immunoreactive areas were nor‑
malized to the area of the AOI, yielding the percentage of the labelled area. Standard OD was calculated using the morphometric software, according to the conven‑
tional logarithmic formula (Russ, 2011):
OD (x,y) = ‑lg INTENSITY(x,y) ‑ BLACK INCIDENT ‑ BLACK
Where INTENSITY(x,y) is the intensity at pixel (x,y);
BLACK is the intensity generated when no light goes through the material; and INCIDENT is the intensity of the incident light. BLACK=0 was determined without exception, and the INCIDENT was adjusted to the lev‑
el of the white matter. The cell counts were analysed at each predefined post‑injection time point by means of ANOVA, and Bonferroni corrected post hoc test were used following significant main effects or interactions.
The threshold of significance was set at p=0.05. Statisti‑
cal analyses were performed using SPSS 17.0 (SPSS, Inc., Chicago, USA). Of note, each measurement comprised of four tissue sections from each animal, and thus 12 measurements were included for each experimental group (n values are provided in the Figure captions).
RESULTS
Behaviour during generalized convulsions
Consistent with previous reports (Mihály et al., 1990, 2001; Szakács et al., 2003; Tóth et al., 2015), i.p. ad‑
ministration of 4‑AP caused characteristic behavioural symptoms, which culminated in GTCS. The GTCS symp‑
toms correspond with a stage 5 seizure on the Racine scale (Racine, 1972). Every animal injected with 4‑AP displayed GTCS. The symptoms of the first GTCS were always sudden and obvious; therefore, the latency mea‑
surements were reliable. The first GTCS developed at 16.7±1.4 minutes after the 4‑AP administration. The an‑
imals recovered from the convulsion 90–100 min after the 4‑AP injection.
Seizure‑induced alterations of c‑fos immunostaining in vermal lobules
The first series of experiments aimed at the detailed description of the c‑fos expression pattern of the gran‑
ule cell layer in the lobules of the vermis, in gener‑
alised 4‑AP seizures. The control animals displayed bas‑
al c‑fos staining; few labelled nuclei and low intensity
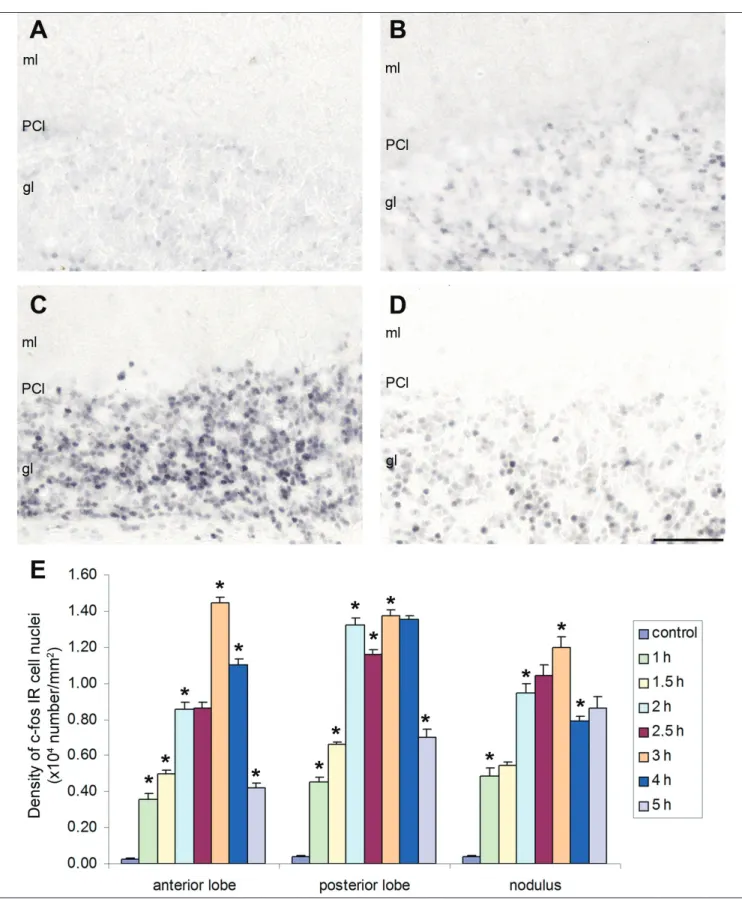
Fig. 2. Temporal alterations of c‑fos protein IR in the cell nuclei of the cerebellar vermis. The low magnification pictures represent sagittal plane sections of the posterior lobe. A: control, B: 4‑AP, 1 h post‑injection; C: 4‑AP, 3 h post‑injection; D: 4‑AP, 5 h post‑injection. Abbreviations: gl: granular layer, ml:
molecular layer, PCl: PC layer. Bar: 200 mm. E: The diagram shows the number of c‑fos IR cell nuclei in the granular layer of the vermal lobules following 4‑AP seizures. The vertical bars represent the standard error of the mean (SEM). The asterisks denote significant differences (P<0.05) between the signed and the previous column (n=15). Density values on the Y‑axis represent the number (x104) of c‑fos IR cell nuclei in 1 mm2 cortical tissue.
immunostaining were observed (Fig. 2A). The number of c‑fos IR cells increased significantly 1 h after 4‑AP administration (Fig. 2B, E), continued to further in‑
crease until 2 h (Fig. 2E). At this time point, the results of the measurements from the three vermal lobes di‑
verged. The anterior lobe showed a prominent peak in the density of the labelled cells 3 h after the injection, and it was followed by a continuous, significant decline (Fig. 2E). In the posterior lobe, the number of the c‑fos labelled cells increased significantly until 3 h after the injection, when number of cells reached a maximum level (Fig. 2C, E). This maximum persisted through 4 h, and a significant reduction was observed only at 5 h (Fig. 2D, E). The nodulus exhibited maximal c‑fos ex‑
pression at 3 h, followed by a significant decrease at 4 h and 5 h (Fig. 2E). Of note, the number of c‑fos IR cell nuclei in 1 mm2 at the 5 h time point were still signifi‑
cantly higher than the control condition (Fig. 2E). For the PC layer, the number of c‑fos IR cell nuclei did not display significant alterations in any of the investigat‑
ed convulsion times (i.e., 1 h, 3 h and 5 h; not shown), as compared to controls.
Zebrin II – c‑fos double staining revealed differential expression of c‑fos in cortical microdomains
Zebrin II/aldolase‑C was expressed in a subset of PCs, and these Z(+) and Z(‑) microdomains were clearly visible in the frontal (i.e., coronal)‑plane sections of the vermis and hemispheres (Figs 1 and 3). We investigated the differences between the Z(+) and Z(‑) bands in rela‑
tion to the number of the c‑fos IR cell nuclei. In control
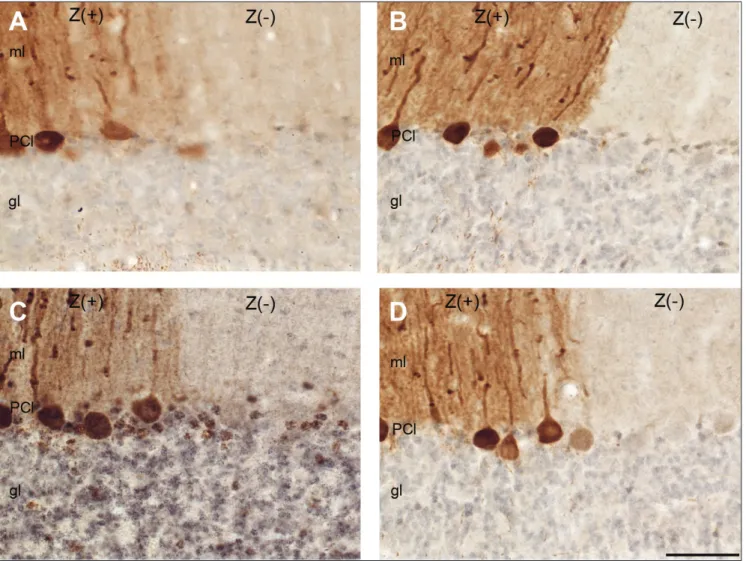
Fig. 3. Distribution of c‑fos IR cell nuclei in the Z(+) and Z(‑) bands of the cerebellar cortex, as measured on double immunostained frontal plane sections.
The brown colour indicates zebrin II positive PC’s (soma and cell processes are stained), and the black‑greyish colour denotes the c‑fos IR cell nuclei.
A: control; B: 4‑AP at 1 h post‑injection; C: 4‑AP at 3 h post‑injection; D: 4‑AP at 5 h post‑injection. Abbreviations: gl: granular layer, ml: molecular layer, PCl: PC layer. Bar: 100 mm.
animals, no differences were observed in Z(+) and Z(‑) bands in the cerebellum; however, a basal level of c‑fos IR was detected (Figs 3A and 4). The epileptic animals exhibited a significant elevation in the number of c‑fos IR cell nuclei in the vermis and in the hemispheres at each post‑injection time, as compared to controls (Figs 4 and 5). Comparison of the Z(+) and Z(‑) bands of the granular layer revealed a significantly greater number of c‑fos IR cells in the Z(+) areas as compared to the Z(‑) areas, at every time point (Fig. 3B‑D and 4‑5).
The Z(+) bands of the anterior vermal zone (lob‑
ules I to V) showed the characteristic activation pat‑
tern described in the c‑fos immunochemistry of the vermal lobules. In particular, we observed a continu‑
ous increase in the number of c‑fos IR cells until 3 h, which was then followed by a significant decrease. In the Z(‑) bands, the maximum number of c‑fos IR cells appeared 4 h after the administration of the drug; how‑
ever, the maximum failed to reach the mean value of the Z(+) peak (Fig. 4A). In the central vermal zone (i.e.,
lobules VI to VII), the maximum level of c‑fos protein expression in the Z(+) band was observed between 2 h and 4 h. In the Z(‑) band, in contrast, maximum c‑fos levels were observed 3 h to 4 h after the 4‑AP injection (Fig. 4B). In the posterior vermal zone (i.e., lobules VIII to dorsal IX), c‑fos staining in the Z(+) band was similar to that observed in the anterior zone, whereas stain‑
ing in the Z(‑) band was similar to that observed in the central zone (Fig. 4C). The nodulus was not compared directly due to the lack of Z(‑) PCs; in particular, only Z(+) c‑fos counts showed a significant peak at 3 h and a slow decrease thereafter (Fig. 4D).
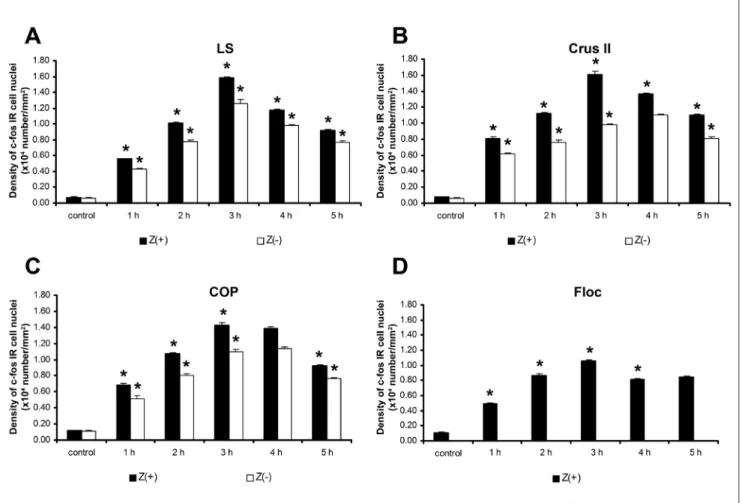
In the hemisphere, the time‑related changes in the density of c‑fos IR were similar in the Z(+) and Z(‑) bands (Fig. 5A‑D). Changes in c‑fos expression were similar in the LS and the crus II, wherein the highest value was reached 3 h following the injection of 4‑AP (Fig. 5B). A similar pattern was detected in the PMD (not shown) and in the COP (Fig. 5C), wherein the maximum immunoreactivity was observed at 3 h post‑injection.
Fig. 4. Changes in the density of c‑fos IR cell nuclei of the granular layer in the Z(+) and Z(‑) bands of the cerebellar vermis. A: anterior zone, B: central zone, C: posterior zone, D: nodulus. The vertical bars represent SEM. The asterisks denote significant differences (P<0.05) between the signed and previous columns. Significantly elevated c‑fos IR cell number was observed in the Z(+) and Z(‑) stripes in the convulsing animals (n=15). Significant differences were observed between the Z(+) and Z(‑) zones in the majority of the convulsing samples (i.e., A, B, C). Density values on the Y‑axis represent the number (x104) of c‑fos IR cell nuclei in 1 mm2 cortical tissue (n=15). Black columns indicate Z(+) areas, whereas white columns indicate Z(‑) areas.
The nodulus (Fig. 4D) and the Floc (Fig. 5D) displayed similar c‑fos expression in 4‑AP convulsions.
Scattered c‑fos staining was detected at every post‑injection time point in the PC layer of the Z(+) and Z(‑) regions (Fig. 3A‑D). Some c‑fos IR cell nuclei were surrounding PCs (Fig. 3B, C). However, no statis‑
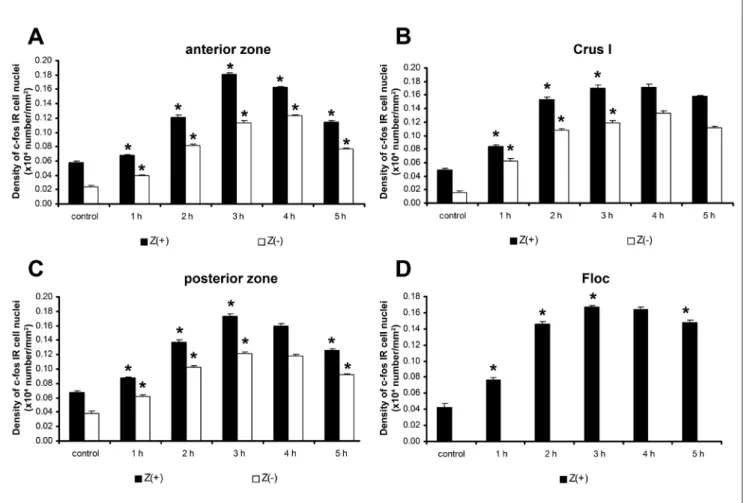
tical difference in c‑fos expression was observed in the PC layer as compared to controls. On the other hand, we observed a significant change in c‑fos expression in the interneurons of the molecular layer; in particular, the epileptic animals exhibited a significantly higher density of c‑fos labelled cells in the Z(+) stripes than in the Z(‑) stripes at every post‑injection time (Figs 6A‑D).
Maximal c‑fos IR in the Z(+) bands was most commonly detected 3 h after the 4‑AP injection (Fig. 6A‑D). The observed decrease in the number of the c‑fos IR cells was slow, because at 5 h we detected significantly ele‑
vated c‑fos IR cell numbers as compared to the control condition (Fig. 6A‑D).
Alterations in synaptophysin immunostaining in the granular layer during seizures
Next, we performed a quantitative analysis of ze‑
brin II‑SYP double immunohistochemistry sections in the granular layer (Fig. 7). The SYP IR areas clearly represented the MF rosettes located between the gran‑
ule cells (Fig. 7A‑C). The zebrin II‑SYP double labelled sections were investigated using two different meth‑
ods: density per area and standard OD. To determine the density per area, SYP‑IR areas were normalized to the area of the AOI (0.005 mm2), yielding the percent‑
age of SYP labelled area (Fig. 7D, E). We found that the proportion of SYP‑IR area did not differ during the time of the seizure (Fig. 7F). However, significant dif‑
ferences were observed when comparing the Z(+) and Z(‑) stripes in the examined cerebellar regions at every time‑point; in particular, the SYP‑IR areas were larg‑
Fig. 5. Changes in the density of c‑fos IR cell nuclei of the granular layer in the Z(+) and Z(‑) bands of the cerebellar hemisphere. A: lobulus simplex (LS), B: crus II, C: copula (COP), D: flocculus (Floc). The vertical bars represent SEM. The asterisks denote significant differences (P<0.05) between the signed and previous columns. A significant elevation in c‑fos IR cell number was observed in the Z(+) and Z(‑) stripes at every post‑injection time point, as compared to the control condition (n=15). Significant differences were observed between the Z(+) and Z(‑) stripes in the majority of the convulsing samples (i.e., A, B, C). Density values on the Y‑axis represent the number (x104) of c‑fos IR cell nuclei in 1 mm2 cortical tissue.
er in the Z(+) stripes as compared to the Z(‑) stripes (Fig. 7F).
The calculation of standard OD was based on a con‑
ventional formula that transforms the quantity of the transmitted light into a logarithmic scale. On this scale, higher values indicate darker pixels, thus correspond‑
ing to stronger immunostaining. We found significant‑
ly higher OD values in the Z(+) bands (as compared to the zebrin negative areas) in both control and seizing animals (Fig. 7G‑H). The dominance of Z(+) SYP was not modified during the seizures. However, at 1 h post‑in‑
jection, a significant reduction in SYP‑IR OD was de‑
tected in both the Z(+) and Z(‑) bands (Fig. 7G, H). This reduction was particularly evident in the vermal cen‑
tral zone and in the COP. A significant reduction in OD was also observed in the nodulus (Fig. 7I). Following this reduction, initial levels of SYP OD were restored by 3 h post‑4‑AP‑injection. We did not observe any alter‑
ation in SYP OD in the Floc (Fig. 7J).
DISCUSSION
Although the cerebellar cortex displays a relative‑
ly uniform cytoarchitecture and internal connections, there are inter‑regional differences in intrinsic neuro‑
chemicals, which may reflect differences in synaptic connections, electrophysiological responsiveness, and information processing (Hawkes et al., 1985; Leclerc et al., 1989; Dehnes et al., 1998; Mateos et al., 2001;
Paukert et al., 2010; Ebner et al., 2012; Xiao et al., 2014;
Zhou et al., 2014). The neurochemical microdomains of the cerebellar cortex can be detected using immuno‑
histochemistry by examining banding of different neu‑
rochemical markers in the sagittal plane (Sillitoe and Hawkes, 2002; Voogd and Ruigrok, 2004b). The present study demonstrates that epileptic seizures induce sig‑
nificantly stronger neuronal activation in the cortical microdomains of zebrin II expressing PCs as compared to zebrin negative cortical stripes.
Fig. 6. Changes in the density of c‑fos IR cell nuclei of the molecular layer in the Z(+) and Z(‑) bands of the cerebellar cortex. A: vermal anterior zone, B: crus I, C: vermal posterior zone, D: flocculus (Floc). Vertical bars represent SEM. The asterisks denote significant differences (P<0.05) between the signed and previous columns. A significant elevation in c‑fos IR cell number was observed in the Z(+) and Z(‑) stripes at every post‑injection time point, as compared to the control condition (n=15). Significant differences were observed between the Z(+) and Z(‑) stripes in the majority of the convulsing samples (i.e., A, B, C). Density values on the Y‑axis represent the number (x104) of c‑fos IR cell nuclei in 1 mm2 cortical tissue.
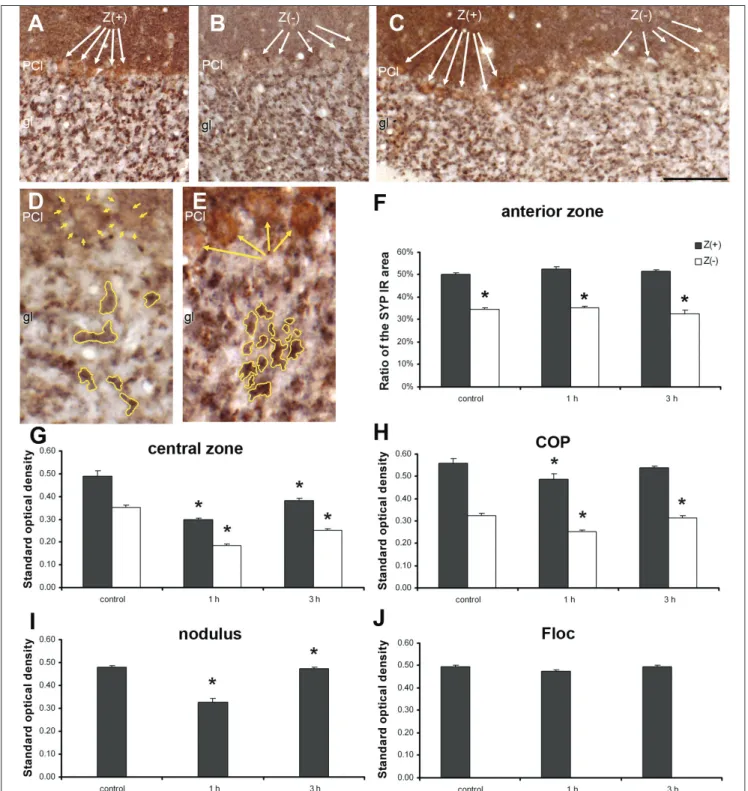
Fig. 7. Distribution of SYP IR structures in the Z(+) and Z(‑) bands of the cerebellar cortex in double immunostained coronal plane sections (SYP: black colour;
Zebrin II: brown colour). Dense SYP staining is visible in the molecular layer, due to the large number of synapses. The mossy fibre rosettes appear as larger black dots in the granular layer. A: control animal, Z(+) zone; B: 4‑AP at 1 h post‑injection, Z(‑) zone; C: 4‑AP at 3 h post‑injection. Z(+) and Z(‑) stripes are shown by the white arrows. Bar: 100 µm. D: Z(‑) granular layer displaying the mossy fibre rosettes outlined with yellow lines. Yellow arrows indicate Z(‑) PCs. E: Z(+) granular layer, the mossy fibre rosettes are outlined with yellow lines, Z(+) PCs are indicated using yellow arrows (bar: 50 µm; ml: molecular layer; PCl: Purkinje cell layer; gl: granular layer). The mossy fibre rosettes display significantly stronger staining in the Z(+) zones. F: in the Z(+) zones the relative size of the SYP IR area of the granular layer is significantly larger both in control and in convulsing animals (1 h and 3 h data of the anterior vermis; area measured: 0.005 mm2).
G‑J: Standard optical density measurements in the granular layer of the central zone (G), in the COP (H), in the nodulus (I), and in the Floc (J). The OD of the SYP IR areas is significantly higher in the Z(+) areas. Reduction of SYP OD at 1 h post‑injection was particularly evident in the vermal central zone, nodulus, and in the COP. In the Floc, no alteration was observed in SYP OD values. The vertical bars represent the standard error of the mean (n=12). The asterisks on the top of the columns denote significant differences (P<0.05). Black columns: Z(+) zones; white columns: Z(‑) zones of the granular layer.
The climbing fibres (CF) project to Z(+) compart‑
ments and carry cerebral, vestibular, tactile, and visual information, whereas the Z(‑) compartments receive somatosensory information from their corresponding CFs (Sugihara and Shinoda, 2004). Results of the pres‑
ent study extend the known targets of the different PC zones, showing that the expression pattern of zebrin II corresponds with the modular organization of the ol‑
ivo‑cortico‑nuclear connections (Voogd and Ruigrok, 2004a ; Sugihara and Quy, 2007). Through their connec‑
tions with the thalamus, these cerebellar nuclei project to various cerebral areas, including the motor cortex, frontal eye fields, premotor, and parietal cortical areas (Clower et al., 2001; Hoover and Strick, 1999; Lynch et al., 1994; Middleton and Strick, 1994; 2001). This pro‑
jection pattern indicates that Z(+) stripes participate in both motor‑ and non‑motor functions (Stoodley and Schmahmann, 2009). We hypothesize that the signifi‑
cant neuronal activation observed in the Z(+) domains can be explained, in part, by descending connections from the forebrain. In particular, 4‑AP convulsions have been shown to strongly activate the cerebral cor‑
tex (Szakács et al., 2003), and the descending corticoru‑
bral and corticoolivary tracts have been shown to exert a stimulatory effect on the cerebellar cortex through inferior olive CFs (Voogd and Ruigrok, 2004b).
4‑AP seizures strongly increased GLU release in the rat striatum, as demonstrated in our previous research (Kovács et al., 2003). Here, we predict that a similar in‑
crease occurred in the cerebellar cortex. In particular, during generalised seizures, the repetitive stimulation of the CFs by 4‑AP likely led to a spillover of GLU in the CF‑PC synapses. The diffusion of GLU in the molecular layer, in turn, excited the inhibitory interneurons, thus decreasing the possibility of PC activation (Szapiro and Barbour, 2007). Our results suggest that this mechanism is more pronounced in the Z(+) zones due to the recip‑
rocal forebrain connections, which elicit enhanced GLU release from the CFs (Paukert et al., 2010). Indeed, the present results demonstrate (1) a depression of c‑fos expression in the PCs during convulsions, and (2) that PCs are not significantly activated, despite a significant rise in c‑fos protein expression in the granule cells and interneurons of the molecular layer.
The properties of the CF system cannot explain the events observed in the granular layer during seizures.
The granule cells are stimulated by the MFs, which originate from different parts of the central nervous system and carry information from various (mainly sensory) modalities to the cerebellum (Voogd and Rui‑
grok, 2004b). Although the MF system is anatomically independent from the CF system, a close relationship exists in their inputs to certain areas of the cerebellar cortex (Apps and Hawkes, 2009). Indeed, prior data in‑
dicate that the cerebellar vermal zones and the lobules of the hemispheres are supplied by different combina‑
tions of MF inputs (Angaut and Sotelo, 1975; Ito 1984).
We predict that the observed different temporal c‑fos expression pattern in the vermal lobules following the 4‑AP injection resulted from a different composition of incoming MF inputs. The stronger activation of the pos‑
terior lobe can be explained by the presence of the mas‑
sive pontocerebellar projection, which is absent in the anterior and flocculonodular lobes (Azizi et al., 1981;
Mihailoff et al., 1981; Pijpers and Ruigrok, 2006). This pontocerebellar connection carries descending cere‑
brocortical activity and plays an important role in sei‑
zure related c‑fos expression in the cerebellar cortex, as demonstrated by our recent experiments. Indeed, tran‑
section of the middle cerebellar peduncle significantly reduced the expression of c‑fos protein, as demonstrat‑
ed by Western blots of the whole cerebellum and cere‑
bellar immunohistochemistry (Tóth et al., 2015).
It is important to note that the functional organi‑
zation of the granular layer also correlates with the zebrin II expression pattern. The distribution of MFs suggests a closed cortico‑ponto‑cerebellar loop in the Z(+) bands (Kelly and Strick, 2003). Granule cells inner‑
vate the PCs via the ascending part of their axons and via parallel fibres (Voogd and Glickstein, 1998). We hy‑
pothesize that, in generalised seizures, the ascending segments of the GC axons carry the major part of the excitation to PCs and to the inhibitory interneurons of the molecular layer. Therefore, the powerful exci‑
tation of the MFs causes the inhibition of PCs by in‑
hibitory interneurons, which are also stimulated by the GLU spillover from CF terminals (Szapiro and Barbour, 2007). Finally, the closed loop reinforces itself, result‑
ing in a more robust activation in the granular layer under the Z(+) PCs, as was observed in our experiments.
We did not observe significant differences in c‑fos con‑
tent between Z(+) and the Z(‑) PCs. This may be due to the potential influence of Bergmann glia (BG) cells on PCs, apart from the influence of interneurons (De Zeeuw and Hoogland, 2015). Indeed, previous research suggests that BG cells can be excited by GLU, as they express 17‑fold more AMPA receptors than PCs (Matsui et al., 2005). BG cells have also been shown to buffer ex‑
tracellular glutamate and potassium (Helleringer et al., 2017). These properties allow the BG cells to prevent overexcitation (and thus triggering of c‑fos expression) in PCs (De Zeeuw and Hoogland, 2015).
Our present results demonstrate that SYP expression in the granular layer is stronger in the Z(+) zones (Le‑
clerc et al., 1989). SYP is localized to the membrane of synaptic vesicles, interacts with synaptobrevin II, and is essential for the efficient retrieval of synaptobrevin II to synaptic vesicles during endocytosis (Wiedenmann
and Franke, 1985; Gordon et al., 2016). The existing lit‑
erature suggests that immunohistochemical alterations of SYP reflects true changes in the density and power of synapses (Masliah et al., 1990; Rocher et al., 2003; Li et al., 2017). Based on these data, we may conclude that the MFs convey stronger excitation to the Z(+) zones than to the Z(‑) zones during a seizure. This is fitting with reports of a reduction in SYP levels following high fre‑
quency stimulation (Balaji et al., 2008). Indeed, repeti‑
tive, strong stimulation leads to exocytosis, depletion of the reserve pool of synaptic vesicles, and a decrease in SYP in the presynaptic axon terminal (Hull et al., 2006;
Jackman et al., 2009; Gordon et al., 2016). Consequently, the rate of endocytosis slows down (Balaji et al., 2008), and finally short‑term synaptic depression develops (Hosoi et al., 2009; Kim and von Gersdorff, 2009). Our re‑
sults are in agreement with this conclusion, and corrob‑
orate a transient decrease in SYP concentration in MF rosettes during 4‑AP seizures, as measured by altered optical density of SYP immunoreactivity.
CONCLUSIONS
C‑fos protein expression in the granular layer of the vermal lobules exhibited different temporal acti‑
vation patterns following 4‑AP seizures. We observed stronger activation of the posterior lobe, which might be explained by the presence of a massive pontocer‑
ebellar MF projection to this region. The strong c‑fos protein expression lasted for several hours (1 ‑ 5 h) af‑
ter injection, in every cerebellar lobule.
In convulsing animals, c‑fos expression significant‑
ly differed between the Z(+) and Z(‑) stripes at every post‑injection time point, in both the hemispheres and vermis. The activation dominance of the Z(+) zones was likely due to seizure‑induced enhanced GLU release from the CFs and MFs.
The scattered and unaltered c‑fos expression of the PCs did not follow the zebrin II pattern. This null effect may be due to the inhibition of PCs by inter‑
neurons, or the metabolic control of PCs by BG cells during the seizure.
Density of SYP immunostaining was significantly higher in the MF terminals of the Z(+) zones at every time point in controls and after 4‑AP treatment. This result may indicate a higher rate of the MF synaptic transmission in the Z(+) microdomains.
ACKNOWLEDGEMENTS
The technical assistance of Mrs. Katica Lakatos is appreciated. During the writing of the article A.M. was
supported by the Hungarian Government and the Euro‑
pean Union (GINOP‑2.3.2‑15‑2016‑00034 grant).
REFERENCES
Ahn AH, Dziennis S, Hawkes R, Herrup K (1994) The cloning of zebrin II re‑
veals its identity with aldolase C. Development 120: 2081–2090.
Angaut P, Sotelo C (1975) Diversity of mossy fibres in the cerebellar cortex in relation to different afferent systems: an experimental electron mi‑
croscopic study in the cat. Brain Res 95: 179–189.
Apps R, Hawkes R (2009) Cerebellar cortical organization: a one‑map hy‑
pothesis. Nat Rev Neurosci 10: 670–681.
Azizi SA, Mihailoff GA, Burne RA, Woodward DJ (1981) The pontocerebellar system in the rat: an HRP study. I. Posterior vermis. J Comp Neurol 197:
543–548.
Balaji J, Armbruster M, Ryan TA (2008) Calcium control of endocytic capac‑
ity at a CNS synapse. J Neurosci 28: 6742–6749.
Boop S, Wheless J, Van Poppel K, McGregor A, Boop FA (2013) Cerebellar seizures. Report of 2 cases. J Neurosurg Pediatrics 12: 288–292.
Brochu G, Maler L, Hawkes R (1990) Zebrin II: a polypeptide antigen ex‑
pressed selectively by Purkinje cells reveals compartments in rat and fish cerebellum. J Comp Neurol 291: 538–552.
Cerminara NL, Lang EJ, Sillitoe RV, Apps R (2015) Re‑defining the cerebellar cortex as an assembly of non‑uniform Purkinje cell microcircuits. Nat Rev Neurosci 16: 79–93.
Clower DM, West RA, Lynch JC, Strick PL (2001) The inferior parietal lobule is the target of output from the superior colliculus, hippocampus, and cerebellum. J Neurosci 21: 6283–6291.
Dehnes Y, Chaudhry FA, Ullensvang K, Lehre KP, Storm‑Mathisen J, Danbolt NC (1998) The glutamate transporter EAAT4 in rat cerebellar Purkinje cells: a glutamate‑gated chloride channel concentrated near the synapse in parts of the dendritic membrane facing astroglia. J Neu‑
rosci 18: 3606–3619.
De Zeeuw CI, Hoogland TM (2015) Reappraisal of Bergmann glial cells as modulators of cerebellar circuit function. Front Cell Neurosci 9: 246.
Ebner TJ, Wang X, Gao W, Cramer SW, Chen G (2012) Parasagittal zones in the cerebellar cortex differ in excitability, information processing, and synaptic plasticity. Cerebellum 11: 418–419.
Gordon SL, Harper CB, Smillie KJ, Cousin MA (2016) A fine balance of syn‑
aptophysin levels underlies efficient retrieval of synaptobrevin II to syn‑
aptic vesicles. PLoS One 11: e0149457.
Hawkes R, Colonnier M, Leclerc N (1985) Monoclonal antibodies reveal sag‑
ittal banding in the rodent cerebellar cortex. Brain Res 333: 359–365.
Hawkes R, Herrup K (1995) Aldolase C/zebrin II and the regionalization of the cerebellum. J Mol Neurosci 6: 147–158.
Helleringer R, Chever O, Daniel H, Galante M (2017) Oxygen and glucose deprivation induces Bergmann glia membrane depolarization and Ca2+ rises mainly mediated by K+ and ATP increases in the extracellular space. Front Cell Neurosci 11: 349.
Herdegen T, Leah JD (1998) Inducible and constitutive transcription factors in the mammalian nervous system: control of gene expression by Jun, Fos and Krox, and CREB/ATF proteins. Brain Res Rev 28: 370–490.
Honavar M, Meldrum BS (2002) Epilepsy. In: Graham DI, Lantos P, editors.
Greenfield’s Neuropathology. Arnold, London, p. 899–941.
Hoover JE, Strick PL (1999) The organization of cerebellar and basal ganglia outputs to primary motor cortex as revealed by retrograde transneuro‑
nal transport of herpes simplex virus type 1. J Neurosci 19: 1446–1463.
Hosoi N, Holt M, Sakaba T (2009) Calcium dependence of exo‑ and endocy‑
totic coupling at a glutamatergic synapse. Neuron 63: 216–229.
Hull C, Studholme K, Yazulla S, von Gersdorff H (2006) Diurnal changes in exocytosis and the number of synaptic ribbons at active zones of an ON‑type bipolar cell terminal. J Neurophysiol 96: 2025–2033.
Ito M (1984) Cerebellum and Neuronal Control, Raven Press, New York.
Jackman SL, Choi SY, Thoreson WB, Rabl K, Bartoletti TM, Kramer RH (2009) Role of the synaptic ribbon in transmitting the cone light re‑
sponse. Nat Neurosci 12: 303–310.
Kelly RM, Strick PL (2003) Cerebellar loops with motor cortex and prefron‑
tal cortex of a nonhuman primate. J Neurosci 23: 8432–8444.
Kim JH, von Gersdorff H (2009) Traffic jams during vesicle cycling lead to synaptic depression. Neuron 63: 143–145.
Kovács A, Mihály A, Komáromi A, Gyengési E, Szente M, Weiczner R, Krisztin‑Péva B, Szabó G, Telegdy G (2003) Seizure, neurotransmitter re‑
lease, and gene expression are closely related in the striatum of 4‑ami‑
nopyridine‑treated rats. Epilepsy Res 55: 117–129.
Leclerc N, Beesley PW, Brown I, Colonier M, Gurd JW, Paladino T, Hawkes R (1989) Synaptophysin expression during synaptogenesis in the rat cere‑
bellar cortex. J Comp Neurol 280: 197–212.
Li R, Li Q, Chu XL, Tao T, Li L, He CQ, Gao FY (2017) Trace eyeblink con‑
ditioning is associated with changes in synaptophysin immunoreactiv‑
ity in the cerebellar interpositus nucleus in guinea pigs. Biosci Rep 38:
BSR20170335.
Lynch JC, Hoover JE, Strick PL (1994) Input to the primate frontal eye field from the substantia nigra, superior colliculus and dentate nucleus demonstrated by transneuronal transport. Exp Brain Res 100: 181–186.
Masliah E, Terry RD, Alford M, DeTeresa R (1990) Quantitative immuno‑
histochemistry of synaptophysin in human neocortex: an alternative method to estimate density of presynaptic terminals in paraffin sec‑
tions. J Histochem Cytochem 38: 837–844.
Mateos JM, Benítez R, Elezgarai I, Azkue JJ, Lázaro E, Osorio A, Bilbao A, Doñate F, Sarría R, Conquet F, Ferraguti F, Kuhn R, Knöpfel T, Grandes P (2001) Parasagittal compartmentalization of the metabotropic gluta‑
mate receptor mGluR1b in the cerebellar cortex. Eur J Anat 5: 15–21.
Matsui K, Jahr CE, Rubio ME (2005) High‑concentration rapid transients of glutamate‑mediated neural‑glial communication via ectopic release.
J Neurosci 25: 7538–7547.
Middleton FA, Strick PL (1994) Anatomical evidence for cerebellar and basal ganglia involvement in higher cognitive function. Science 266: 458–461.
Middleton FA, Strick PL (2001) Cerebellar projections to the prefrontal cor‑
tex of the primate. J Neurosci 21: 700–712.
Mihailoff GA, Burne RA, Azizi SA, Norell G, Woodward DJ (1981) The ponto‑
cerebellar system in the rat: an HRP study. II. Hemispheral components.
J Comp Neurol 197: 559–577.
Mihály A, Bencsik K, Solymosi T (1990) Naltrexone potentiates 4‑aminopyr‑
idine seizures in the rat. J Neural Transm Gen Sect 79: 59–67.
Mihály A, Szente M, Dubravcsik Zs, Boda, B, Király E, Nagy T, Domonkos A (1997) Parvalbumin and calbindin containing neurons express c‑fos protein in primary and secondary (mirror) epileptic focuses of the rat neocortex. Brain Res 761: 135–145.
Mihály A, Szakács R, Bohata C, Dobó E, Krisztin‑Péva B (2001) Time‑de‑
pendent distribution and neuronal localization of c‑fos protein in the rat hippocampus following 4‑aminopyridine seizures. Epilepsy Res 44:
97–108.
Mohamed IS, Otsudo H, Ferrari P, Ochi A, Carter Snead O, Cheyne D (2011) Neuromagnetic cerebellar activation during seizures arising from the motor cortex. Epilepsy Res 96: 283–287.
Paukert M, Huang YH, Tanaka K, Rothstein JD, Bergles DE (2010) Zones of enhanced glutamate release from climbing fibers in the mammalian cerebellum. J Neurosci 30: 7290–7299.
Pijpers A, Ruigrok TJ (2006) Organization of pontocerebellar projections to identified climbing fiber zones in the rat. J Comp Neurol 496: 513–528.
Racine RJ (1972) Modification of seizure activity by electrical stimulation: II.
Motor seizure. Electroenceph Clin Neurophysiol 32: 281–294.
Rocher AB, Chapon F, Blaizot X, Baron JC, Chavois C (2003) Resting‑state brain glucose utilization as measured by PET is directly related to regional synaptophysin levels: a study in baboons. NeuroImage 20:
1894–1898.
Russ JC (2011) The Image Processing Handbook, sixth ed. CRC Press, USA.
Sillitoe RV, Hawkes R (2002) Whole‑mount immunohistochemistry:
a high‑throughput screen for patterning defects in the mouse cerebel‑
lum. J Histochem Cytochem 50: 235–244.
Stoodley CJ, Schmahmann JD (2009) Functional topography in the human cerebellum: a metaanalysis of neuroimaging studies. Neuroimage 44:
489–501.
Sugihara I, Shinoda Y (2004) Molecular, topographic, and functional orga‑
nization of the cerebellar cortex: a study with combined aldolase C and olivocerebellar labeling. J Neurosci 24: 8771–8785.
Sugihara I, Quy PN (2007) Identification of aldolase C compartments in the mouse cerebellar cortex by olivocerebellar labeling. J Comp Neurol 500:
1076–1092.
Szakács R, Weiczner R, Mihály A, Krisztin‑Péva B, Zádor Z, Zádor E (2003) Non‑competitive NMDA receptor antagonists moderate seizure‑in‑
duced c‑fos expression in the rat cerebral cortex. Brain Res Bull 59:
485–493.
Szapiro G, Barbour B (2007) Multiple climbing fibers signal to molecular layer interneurons exclusively via glutamate spillover. Nature Neurosci 10: 735–742.
Thesleff S (1980) Aminopyridines and synaptic transmission. Neuroscience 5: 1413–1419.
Tóth Z, Molnár G, Mihály A, Krisztin‑Péva B, Morvai M, Kopniczky Z (2015) Immunohistochemistry of cerebellar seizures: mossy fiber afferents play an important role in seizure spread and initiation in the rat. Acta Histochem 117: 47–55.
Tóth Z, Mihály A, Mátyás A, Krisztin‑Péva B (2018) Non‑competitive antag‑
onists of NMDA and AMPA receptors decrease seizure‑induced c‑fos protein expression in the cerebellum and protect against seizure symp‑
toms in adult rats. Acta Histochem 120: 236–241.
Voogd J, Glickstein M (1998) The anatomy of the cerebellum. Trends Neu‑
rosci 21: 370–375.
Voogd J, Ruigrok TJ (2004a) The organization of the corticonuclear and olivocerebellar climbing fiber projections to the rat cerebellar vermis:
the congruence of projection zones and the zebrin pattern. J Neurocytol 233: 5–21.
Voogd J, Ruigrok TJ (2004b) Cerebellum and precerebellar nuclei. In: The Human Nervous System (Paxinos G, Mai JK, Eds). Elsevier, Amsterdam, The Netherlands, p. 321–392.
Wiedenmann B, Franke WW (1985) Identification and localization of synap‑
tophysin, an integral membrane glycoprotein of Mr 38,000 characteris‑
tic of presynaptic vesicles. Cell 41: 1017–1028.
Willoughby JO, Mackenzie L, Medvedev A, Hiscock JJ (1995) Distribution of Fos‑positive neurons in cortical and subcortical structures after pi‑
crotoxin‑induced convulsions varies with seizure type. Brain Res 683:
73–87.
Xiao J, Cerminara NL, Kotsurovsky Y, Aoki H, Burroughs A, Wise AK, Luo Y, Marshall SP, Sugihara I, Apps R, Lang EJ (2014) Systematic regional varia‑
tions in Purkinje cell spiking patterns. PLoS One 9: e105633.
Zhou H, Lin Z, Voges K, Ju C, Gao Z, Bosman LW, Ruigrok TJ, Hoebeek FE, De Zeeuw CI, Schonewille M (2014) Cerebellar modules operate at dif‑
ferent frequencies. Elife 3: e02536.