Atomic Force Microscopy and Nanomechanics of Bacteriophage T7
Ph.D. Thesis
Zsuzsanna Vörös
Basic Medicine Doctoral School Semmelweis University
Supervisor: Dr. Miklós Kellermayer MD, D.Sc Official reviewers: Dr. Csaba Dobó-Nagy MD, D.Sc.
Dr. Attila Gergely Végh, Ph.D.
Final Examination Committee: Dr. Emil Monos MD, D.Sc. (Chairman) Dr. Alán Alpár MD, Ph.D
Dr. Beáta Bugyi, Ph.D
Budapest
2018
TABLE OF CONTENTS
ABBREVIATIONS ... 3
1 INTRODUCTION... 4
1.1 Icosahedral Capsid Architecture ... 4
1.2 Bacteriophage T7 Structure ... 6
1.3 Bacteriophage T7 Maturation ... 7
1.4 Morphological and Mechanical Characterization of Single Virions by AFM ... 9
1.4.1 AFM Operating Principles ... 9
1.4.2 AFM Techniques ... 11
1.4.3 AFM Operating Modes ... 13
1.4.4 Atomic Force Microscopy in Virology ... 15
1.5 Bacteriophage T7 – Melting Experiments ... 16
2 OBJECTIVES OF THE THESIS ... 18
3 METHODS ... 19
3.1 Virus Preparation ... 19
3.2 Surface Treatment and Sample Preparation for AFM ... 19
3.3 AFM Imaging of Virus Particles ... 20
3.4 Image Analysis ... 21
3.5 Calculation of force exerted by the oscillating cantilever on the capsid ... 22
3.6 Indentation Experiments on Virus Particles... 23
3.7 Indentation Experiment Analysis... 24
3.8 Analysis of steps in force spectra ... 25
4 RESULTS ... 26
4.1 Temperature-Dependent Topography and Nanomechanics of Bacteriophage T7 26 4.1.1 Topographical Structure of Heat-Treated T7 Phages ... 26
4.1.2 Nanomechanics of Heat-Treated T7 Phages ... 31
4.2 Force-Induced Structural Changes of the Bacteriophage T7 ... 33
4.2.1 Discrete Stepwise Transitions ... 33
4.2.2 Rate Dependence of the Stepwise Transition ... 34
4.2.3 The Role of the Genomic DNA in the Force-Driven Transitions ... 35
4.3 Mechanically-Driven DNA Ejection of the Bacteriophage T7 ... 36
4.3.1 Mechanically-Triggered DNA Ejection ... 36
4.3.2 The Effect of Increased Mechanical Load on the DNA Ejection Triggering Rate ... 39
4.3.3 The Effect of Chemical Fixation on DNA Ejection ... 41
5 DISCUSSION ... 43
5.1 Thermally-Induced Structural Changes in Bacteriophage T7 ... 43
5.1.1 Analysis of the Heat-Induced Topographical Changes ... 43
5.1.2 Analysis of the Heat-Induced Nanomechanical Changes ... 45
5.1.3 The Model of Thermally-Induced Structural Changes in Bacteriophage T7 ... 48
5.2 Stepwise Reversible Buckling of Bacteriophage T7 ... 49
5.2.1 Nanomechanical Buckling of Bacteriophage T7... 49
5.2.2 Energetic Topology of the Mechanically-Driven Transitions... 50
5.2.3 The Role of the Genomic DNA in Force-Driven Transitions ... 52
5.2.4 Phenomenological Model of the Mechanically Induced Stepwise Buckling ... 53
5.2.5 Kinetics of Force-Driven Transitions ... 55
5.3 DNA Ejection Triggered by a Sensitive Mechanical Switch... 56
5.3.1 The Role of Mechanical Force in Triggering DNA Ejection ... 56
5.3.2 The Effect of Increased Mechanical Load on the DNA Ejection Triggering Rate ... 60
5.3.3 Switch-Like Triggering of the DNA Ejection ... 63
6 CONCLUSIONS ... 64
7 SUMMARY... 66
8 ÖSSZEFOGLALÁS ... 67
9 LIST OF PUBLICATIONS ... 68
9.1 Publications related to the dissertation ... 68
9.2 Publications unrelated to the dissertation... 68
10 BIBLIOGRAPHY ... 69
11 KÖSZÖNETNYILVÁNÍTÁS (ACKNOWLEDGMENT) ... 80
ABBREVIATIONS
AFM Atomic Force Microscope APTES (3-Aminopropyl)triethoxysilane AP-mica Mica functionalized with APTES ATP Adenosine triphosphate
CD Circular dichroism
Cryo-EM Cryo-electron microscopy DNA Deoxyribonucleic acid
dsDNA Double-stranded deoxyribonucleic acid EM Electron microscopy
GD-mica Mica functionalized with glutaraldehyde
gp Gene product
OD Optical density
PBS Phosphate-buffered saline
RT Room temperature
SD Standard deviation
SPM Scanning Probe Microscope Tris tris(hydroxymethyl)aminomethane
1 INTRODUCTION
Viruses are infectious obligate intracellular parasites that comprise a nanometer-sized protein shell (capsid) and an internal genome. The capsid protects the genome from exposure to harmful chemical and physical effects in the extracellular environment. In DNA viruses, it also harbors the machinery for the efficient packaging and infectious exposition of the genomic material. The beauty and elegance of the capsid structure and the intriguing processes of DNA packaging and unpacking provide inspiration for the design of artificial nanocapsules. In the present thesis, I summarize our efforts towards the understanding of the structure, nanomechanics and force-induced transitions of the T7 bacteriophage.
1.1 Icosahedral Capsid Architecture
In recent years, it has become increasingly recognized that the geometry of viral capsids plays an important role in their structural and mechanical stability. Virus capsids are broadly classified according to their shell structure. The majority of virus capsids have icosahedral structure1,2. The basic icosahedron has 30 edges, 20 triangular faces and 12 vertices. Thus, the underlying icosahedral lattice divides the capsid surface into 20 equal triangular parts.
The icosahedron is a remarkably symmetrical object: it has 15 ´ 2-fold symmetry axes at the edges (180˚ rotation), 10 ´ 3-fold at the faces (120˚ rotation) and 6 ´ 5-fold at the vertices (72˚ rotation) (Fig. 1.). The triangular components bind to each other equivalently, thereby making the icosahedron a minimal-energy structure.
Fig. 1. Rotational symmetry axes of the icosahedron. The icosahedron viewed along the two-, three- and fivefold symmetry axes (left to right). The twofold axis passes through the middle of each edge, the threefold axis through the center of each icosahedral face and the fivefold axis through the vertices. Around the two-, three- and fivefold symmetry axis, 180˚, 120˚ and 72˚ rotation brings the object to self-coincidence, respectively.
Each triangular face contains one protein subunit in its corners, but the number of protein subunits between them increases with the capsid size. The maximum number of components that can be joined in an equivalent manner is 60, therefore one of them gives the structural unit of a virus shell. The simplest virus has capsids constructed of just 60 proteins but most have many more. Upon increasing the number of protein subunits, the binding between them cannot remain identical. Thus, they form pentamers and hexamers by joining 5- or 6-protein subunits, respectively.
In 1962 Caspar and Klug proposed the concept of quasi-equivalence to account for the arrangement of proteins on the icosahedral capsid surface3,4. The concept is based on the assumption that identical capsid protein subunits interact with each other, create nearly identical (quasi-equivalent) bonds to form icosahedral capsids. The triangulation number is a formal descriptor for complex icosahedral capsids which unambiguously describes the geometrical arrangement of protein subunits. The T-number can be calculated on a triangular lattice according to the formula
𝑇 = ℎ%+ ℎ𝑘 + 𝑘%, (1.1) where h and k are the lattice coordinates spanned by two unit-length vectors at 60° angle.
The h and k numbers are the integer steps, made along the vectors separated by 60˚ on the triangular mesh, required to reach from a pentamer to an adjacent one (Fig. 2.).
Fig. 2. Calculation of the triangulation number on a triangular lattice. The h and k axes are crossing at 60° angle and form equilateral triangles. The two unit vectors h and k of the hexagonal net define the coordinates. Hexamers and pentamers are located at the lattice intersection joints. The triangular facet of an icosahedron is indicated with red triangles.
The T-number indicates the number of unit triangles contained in an icosahedral face. In general, each unit triangle is formed of three protein subunits, but in some capsids the
position of the triangles does not coincide with the underlying protein subunits. In spite of this, the icosahedral shell has 60 ´ 𝑇 protein subunits in total and 60 ´ +
% subunits per icosahedral face. As a pentamer is built up of 5 and a hexamer from 6 protein subunits, a capsomer shell contains at least 12 pentamers and 10 ´ (𝑇 − 1) hexamers.
The schematic capsid diagrams often show only the pentamers and hexamers, the building proteins of which may not coincide with the triangular lattice. In any case, the triangulation number can alternately be determined from the number of protein subunits of a single structural unit out of the 60 (Fig. 3.).
Fig. 3. Capsid structure according their triangulation number. (Source: ViralZone www.expasy.org/viralzone, SIB Swiss Institute of Bioinformatics)5
1.2 Bacteriophage T7 Structure
Our research group has had a long-time interest in the structure and stability of bacteriophage T76–10. Bacteriophage T7 belongs to the Podoviridae family and infects most strains of Escherichia coli (E. coli). The T7 bacteriophage is composed of a head with a
non-enveloped icosahedral capsid shell of T = 7 symmetry and a short non-contractile tail11–14 (Fig. 4.).
Fig. 4. Bacteriophage T7 structure. (a) Cross-sectional diagram and (b) schematic structural model of non-envelopped T7 bacteriophage. (Source: www.expasy.org/viralzone, SIB Swiss Institute of Bioinformatics)5 (c) Atomic surface models of the T7 capsid structure derived from cryo-EM reconstructions. (Source: rcsb.org15,16)
The head comprises an inner core and a shell. The inner core consists of gp14, gp15, gp16 and gp8 proteins, and the shell is an assembly of 415 pieces of gp10A structural proteins (note that "gp" stands for "gene product"). These structural proteins arrange into two types of capsomer subunits: 5-gp10A pentamers and 6-gp10A hexamers. The pentamers are located at 11 of the 12 icosahedral vertices, and the last vertex is occupied by the dodecameric connector protein gp8. The hexamers fill out the 60 topological locations around the pentamers. The mature capsid is filled with the 40 kbp-long genomic dsDNA.
1.3 Bacteriophage T7 Maturation
Virus maturation is a highly complex process which corresponds to a transition from a non- infectious immature particle to an infectious mature virion. In the first step, the assembly of the viral structural elements leads to the formation of immature DNA-free virus particles which are unable to initiate infection. The final stage of the assembly pathway of most viruses is followed by a set of structural transitions and biochemical modifications that transform the assembled particles into a mature infectious agent.
The maturation of dsDNA bacteriophages includes two major steps which share a surprising degree of similarity12,17,18. First, an icosahedral procapsid assembles from a limited set of structural proteins, followed by an ATP-driven DNA packaging and a drastic rearrangement of procapsid proteins that mature into an infectious phage.
The T7 procapsid assembles from certain number of main shell protein monomers (gp10), scaffolding proteins (gp9) and a dodecameric connector or portal (gp8) which attaches to a core complex (gp14, gp15 and gp16). These proteins must interact in a well-defined way to form a fully functional prohead with proper shape and size. The basic structure of these proteins is highly similar across different bacteriophages but the main protein fold may contain extra domains, which leads to a unique assembly mechanism.
The DNA packaging of T7 phage starts at procapsid state. The DNA packaging machinery is located at the same vertex as the portal and core complex, and is formed by ATPases (gp18 and gp19) which help the DNA pass through this entry tunnel. In this phase of the maturation, the scaffolding proteins also disappear and the drastic transformation of the shell begins.
By comparing the procapsid and the mature capsid the maturation process involves the increase of the shell diameter from 51 to 60 nm and the decrease in its thickness from 4.5 to 2.3 nm due to the rearrangement of the gp10 domains. The tertiary topology of gp10 monomer is divided into four regions: N-arm, E-loop, A-domain and P-domain. Maturation is the result of a series of changes between these structural elements (Fig. 5.17,18).
Fig. 5. Atomic models of major capsid protein gp10A. (a) gp10A subunit in procapsid (capsid I) and (b) in intermediate capsid (capsid II). The models are rainbow-colored from N (blue) to C (red) terminus. Arrangement of subunits in a pentamer (left) and a hexamer (right) of the (c) procapsid shell and (d) intermediate capsid shell. Subunits in (c) are indicated with lower case letters (a-g). The N-helix and N-arm regions are colored blue. All images are viewed from the capsid outer surface. Source:18
The A-domain bends in respect to the P-domain: its N-terminal region moves outwards, and the E-loop bends to further cover the monomer. The monomers perform translation, in-plane rotation and tilting which results in an expanded thinner shell with increased radius and capsomers with better symmetry. These changes reinforce the bonding lattice between the neighboring subunits, which is crucial to the formation of an infectious mature virion. The T7 has a different stabilization strategy than other bacteriophages. In general, bacteriophages have covalent cross-linkages (HK97) or bridging auxiliary proteins on the capsid surface (T4, λ) for the stabilization of the capsid shell. However, T7 phages use an intrasubunit salt bridge as an intracapsomeric topological linkage through the E-loop of neighboring subunits, and an intercapsomer joint-like interaction between a maturation- generated protein hairpin and a maturation-generated protein pocket18. For further stabilization of the capsid shell, mature bacteriophages also incorporate accessory proteins that can reinforce the contact between capsomers. T7 phage is distinct in this respect too, because it has no accessory proteins. The common step across phages, following the DNA packaging and capsid stabilization, is the tail attachment, which completes the maturation process.
1.4 Morphological and Mechanical Characterization of Single Virions by AFM
1.4.1 AFM Operating Principles
Atomic force microscopy (AFM) is a material characterization technique which allows to measure the topology and local material properties of surfaces and surface adsorbed samples with sizes that range from that of molecules to cells. In recent years, AFM has become an important tool in the investigation of viral structure and mechanics. Because of the central importance of AFM in my experimental approach, the method is detailed in the following.
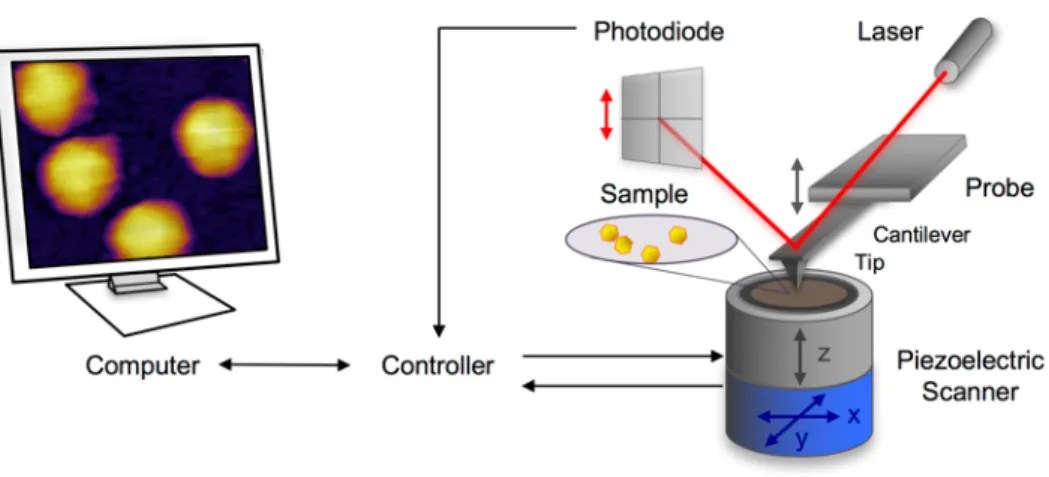
The operating principle of the AFM was first described by Binnig et al19,20. AFM operates with a sharp tip which is mounted at the end of a cantilever spring and is brought in close proximity with the surface area to be scanned (Fig. 6.). During scanning the interaction between the sample and the tip causes the cantilever to bend. This bending is detected by a laser beam which is focused on the back part of the cantilever and reflected to a quadrant photodiode.
Fig. 6. Schematic diagram of a typical AFM measurement setup.
The nanometer-scale movement of the sample is provided by polycrystalline piezoelectric ceramics (piezo). These materials undergo a reversible deformation when an external bias voltage is applied across their two opposite faces. In order to construct real topological images of the samples, the AFM is equipped with two individual piezos. One generates the samples movement in the x-y direction, and the other one generates the z-direction displacement. The location of the z - piezos is dependent on the actual AFM design and may be attached either to the cantilever or the sample holder stage.
AFMs are generally designed with a distance between the cantilever and the photodiode detector that is orders of magnitudes larger than the length of the cantilever. This acts as an optical lever, which greatly magnifies motions of the tip, increasing the sensitivity and consequently the z-axis resolution.
The mechanical properties of the cantilever also determine the limit of the image resolution.
Biological samples are soft, therefore cantilevers with low stiffness are preferable for imaging purposes as they exert lower forces on the sample. Typical commercially available cantilevers are made of silicon nitride and have a sharp tip at the end. The cantilever is either rectangular or V-shaped with a length of 100 - 200 µm, curvature radius of 8 - 20 nm and stiffness of 0.01 to 0.5 N/m. The typical cantilever resonance frequency (f) is between 15 and 500 kHz and depends on the stiffness (k) and mass (m) according to
𝑓 = 1 2𝜋3𝑘
𝑚 (1.2)
In liquids the cantilever resonance frequency becomes reduced. In order to nevertheless obtain high resonance frequencies and low stiffness (which are important for non- destructive imaging), strategies for decreasing the cantilever mass (hence, size) are being utilized. As a result, very small cantilevers are increasingly used for fast, high-resolution AFM imaging.
1.4.2 AFM Techniques 1.4.2.1 AFM Imaging
The most widely used application of AFM is the imaging of surface-adsorbed samples where the x-y piezo provides the movement along the horizontal plane for scanning a selected area.
In order to achieve high-resolution images, the tip-sample force (or the oscillation amplitude described below in the "AFM operating modes" section) has to be maintained at a predefined constant low value (set point) independently of the topological variations of the surface.
Therefore, when the sample height significantly changes during the lateral movement of the tip, its vertical position needs to be adjusted accordingly using the z-piezo. This is generally achieved with a tightly-controlled feedback loop which monitors the tip-sample interaction and lowers or elevates the tip to maintain the predefined set-point value. Such feedback system allows to follow the topography of the sample accurately and thereby increase the resolution of the imaging.
1.4.2.2 Force Spectroscopy
Another major application of AFM is force “spectroscopy” where the cantilever is used as a piconewton-sensitive force probe by moving the tip along the vertical z-axis without scanning in the x-y plane. Although there is no true matter-radiation interaction, the name force “spectroscopy” is widely used. Force spectroscopy measurements can be further categorized as stretching or indentation experiments, depending on whether the force exerted on the tip is measured by pulling a tip-attached molecule or by pressing a surface- attached sample.
In stretching experiments, the tip approaches the surface until it reaches and attaches to a molecule. Then the tip retracts from the surface, thereby pulling the molecule while registering a force-distance curve. Such force-distance curves provide information about the
structural transitions of the molecule such as protein unfolding, molecular interactions or binding properties. For certain special experiments the tip may be further chemically functionalized or mounted with special ligands to bind selectively.
In indentation experiments, the tip approaches the surface and exerts a predefined force on the sample while registering a force-distance curve. The generated force-distance curves provide information about the elastic properties of the sample.
The value of force (F) at any location is generally calculated using Hook’s law:
𝐹 = 𝑘𝑑, (1.3)
which requires precise knowledge of the stiffness of the cantilever (k) and its deflection (d).
There are several different methods for precisely determining the cantilever stiffness (spring constant) which fall into three main classes. The first is called loading method21 which is based on exerting force on object with known stiffness by the unknown cantilever with unknown stiffness. From the recorded force-distance curve the cantilever's stiffness is calculated.
The second is the geometry method22,23, which calculates the stiffness by measuring the cantilever dimensions and resonance frequency. The third and increasingly used method is called thermal calibration or thermal tuning, which is based on the thermal spectrum analysis of the cantilever24.
In an acoustically isolated system, in which the cantilever vibrates only due its thermal energy and the cantilever moves only in z-direction, the thermal energy is equal to the elastic potential energy of the cantilever. Thus, according to the equipartition theorem:
1
2𝑘7𝑇 =1
2𝑘〈𝑑%〉, (1.4)
where kB is Boltzmann’s constant and T is the temperature, k is the stiffness of the cantilever and d is its deflection. For thermal tuning the deflection is recorded for a time interval with the cantilever in thermal equilibrium and constrained on only one end, oscillating at a distance away from any surface. Then the recorded time series is Fourier transformed and analyzed in the frequency domain to find the resonance frequency (frequency of the fundamental peak) and the power associated with the resonance. To accurately calculate the stiffness of the cantilever the laser displacement on the detector also needs to be calibrated
against the position- detector sensitivity. For this, static load is exerted at the end of the cantilever constraining it at both ends rather than only one end when the thermal energy was measured. The advantages of the thermal method are that it is independent of the material and shape of the cantilever, and it can be carried out relatively easy and fast.
1.4.3 AFM Operating Modes
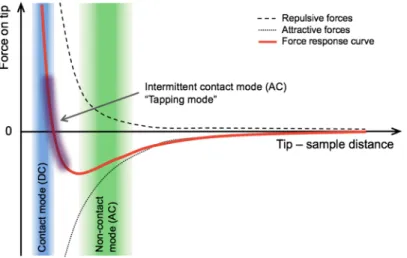
Modern AFM devices provide several operating modes for imaging. The imaging modes are accordingly divided into two major types depending on which tip–sample interaction is detected (Fig. 7.). The first mode is called static or DC mode, in which the tip is brought into contact with the surface and the static deflection of the cantilever is recorded. The second mode is called resonant or AC mode, in which the tip is forced to oscillate using a piezoelectric element, and the changes in its oscillation amplitude due to the tip-sample interaction forces are recorded. By partitioning an idealized curve of force between the tip and sample, different areas can be highlighted where the typical imaging modes operate25.
Fig. 7. Schematic plot of the forces between tip and sample, highlighting the typical zones for the different operating modes.
Static or DC mode can be further classified into contact, deflection and lateral force microscopy modes.
• Contact mode is the most commonly used DC mode, where the tip is in direct contact with the sample. During scanning the deflection is kept constant by a feedback loop.
Because the tip is continuously in contact with the sample, shear forces are generated which may damage the sample. To preserve the integrity of soft biological samples
in this method as best as possible, soft cantilevers should be applied. Liquid environment can further reduce the stress on the sample by eliminating the capillary forces between the tip and the sample.
• Deflection or error mode is used for scanning rough or relatively rigid samples because the cantilever presses harder on asperities and less on depressions generating images with high-frequency information.
• Lateral force microscopy mode is applied when the samples have uniform, constant height but contains distinct areas with different frictional properties due to variation in chemical characteristics. In this case, the image is generated by detecting the torsion of the cantilever on the quadrant photodiode.
Resonant or AC modes can be further classified into non-contact, intermittent contact, phase imaging and force modulation mode.
• In non-contact mode, the oscillating tip is brought close to the sample surface without touching it, yet sensing the van der Waals attractive forces. The attractive forces induce a shift in the resonance frequency of the cantilever. During imaging the frequency shift is kept at a constant level trough continuously adjusting the surface-tip distance with a feedback loop by monitoring the amplitude at a particular frequency. This mode can be applied only to dry samples.
• Intermittent contact or tapping mode is similar to non-contact mode but approaching the sample and getting in contact with it, the repulsive force causes dampening in the oscillation amplitude (driving amplitude). In this method, the image is generated by keeping the decreased amplitude (setpoint amplitude) constant at the sample surface using a feedback loop. This mode of operation is widely used to study soft biological samples, because the vertical and lateral resolution are both high, and the interaction with the sample is weaker than with contact mode.
• Phase imaging can be performed during scanning with intermittent contact mode, by acquiring the phase difference between the driving signal and cantilever oscillation.
The phase images provide information about local mechanical properties of the sample such as viscosity and adhesion.
• Force modulation mode works with low-frequency oscillation of the tip while keeping it permanently in contact with the surface. The varying stiffness of surface
features induces dampening of the cantilever oscillation, meanwhile the corresponding cantilever deflection is recorded. Thus, the recorded images give information about the local relative viscoelastic properties of the sample.
Force “spectroscopy” can be performed with either static or dynamic modes. The most preferred method is contact mode, where the deflection of the cantilever is registered as a function of its displacement as the tip approaches the surface, gets in contact with it and then retracts. In dynamic modes, information about the cantilever vibration is registered in addition to the static deflection and several parameters can be measured as a function of distance such as static deflection, amplitude, phase, higher harmonics or frequency. These data represent valuable information about the material properties such as short- and long- range forces, friction, plasticity and chemical composition.
1.4.4 Atomic Force Microscopy in Virology
One of the primary goals in virology is to reveal the mechanisms behind the intricate relationship between the structure and function of viruses. Atomic force microscopy is an effective technique that has been applied in this field fairly recently in order to understand the underlying details of such mechanisms. It allows not only to explore the structure of viruses but also to investigate their mechanical properties, which have been shown to be related to infectivity26.
The structural exploration of viruses by AFM imaging started in the mid 1990s 27 and was followed by increasingly detailed description of numerous virus particles as the technique improved28–47. AFM imaging allows for the precise characterization of the capsid structure, such as the general dimensions, the arrangement of the capsomers and even the identification of underlying motifs. Two alternative techniques commonly used for examining virus structures are X-ray crystallography and electron microscopy (EM). These techniques are capable of giving information about the interior structure, but they also require specific sample preparation, such as aligning the virus particles into highly ordered formation for X-ray crystallography, or heavy metal staining, shadowing and vacuum drying for EM. By contrast, AFM imaging techniques require minimal preparation and can be applied under physiological conditions without any drying, fixing or staining. Recent advancements in cryo-EM, a special variant of EM, enabled detailed analysis of virus particles in close-to-native state. However, AFM imaging is still more universally suitable
for studying maturation44, assembly40,45,47, cell infection29,35,41 and the effect of different environmental conditions36. Furthermore, force spectroscopy methods make AFM a uniquely attractive approach to investigate the mechanical properties of viral structures.
Although, the first investigation of the elastic properties of viruses was performed in the late 1990s48, their exploration by indentation experiments became widely employed only in the mid-2000s26,49–79. The AFM indentation experiments with varied parameters, such as applied force, loading rate or the number of cycles, provided increasingly detailed information about the
• mechanical properties of local structural differences of the capsid59,60
• role of internal DNA and protein-DNA interactions49,51,52,55,72,76
• mechanisms of maturation, assembly and DNA delivery44,50,54,65,74
• effect of different environmental conditions (pH, salt, host molecules, chemical stress)44,69,71,73.
Recent AFM studies focus on manipulating the mechanical behavior of virus capsids through protein engineering26,56,57,61,62,78,79 in order to reveal the role of the different structural motifs that may contribute to the development of virus-based nanoparticles80–85 with improved mechanical properties. Notably, although the T7 bacteriophage has been investigated by a variety of methods, its exploration with AFM has so far been limited44.
1.5 Bacteriophage T7 – Melting Experiments
Our research group has in the past investigated the structure and stability of the T7 bacteriophage, primarily with absorption spectroscopic methods6–10. It has been found, in optical melting experiments, that the T7 phage passes through two major temperature- dependent transitions (Fig. 8.). In these experiments, optical density (OD) of the sample at 260 nm (A260) is measured while heating the sample from room temperature to 95 ˚C.
Because it is DNA that absorbs at this wavelength, one may obtain insights about the overall structural changes of T7 through the changes in DNA. The first transition, which occurs at around 50-55 ˚C, is thought to correspond to the loosening of capsid structure so that the strain in DNA, due to the tight packing in the capsid is decreased, hence the A260 is likewise decreased. The second transition, which occurs at around 80-85 ˚C, is thought to be
associated with strand separation of the dsDNA. Finally, the third transition appears at around 90-95 ˚C, and is related to the disruption of the alpha-helical protein structure.
Fig. 8. Optical melting of the T7 bacteriophage. First derivative of the melting curve A260(T) is shown at 260 nm as a function of temperature for the range 25-95 ˚C.
The optical melting experiments clearly demonstrate that there is a change in the nucleoprotein structure upon increasing the temperature. However, due to the indirect nature of the method (i.e., changes in the optical properties of DNA, rather than the entire nucleocapsid, are recorded) and the fact that it is an ensemble technique (i.e., measurement values represent averages across the entire sample), the microscopic mechanisms of the induced changes remain hidden. We anticipated that by exploring the structure of individual T7 bacteriophage particles by using a high-resolution method such as the AFM, the mechanisms of the structural changes could be revealed.
2 OBJECTIVES OF THE THESIS
Although viruses are known to become inactivated by heat treatment, the mechanisms of the accompanying thermally-induced structural changes within the particles are not known.
Furthermore, the dynamics of the capsid behavior and the mechanism of the DNA ejection process are still largely unresolved. Because AFM is an effective technique in our hands to explore the detailed structure of these nanometer-sized particles in various environmental conditions and also allows to investigate their mechanical properties, we endeavored to answer the following questions by using this technique:
• What kind of changes occur in the capsid structure due to heat-treatment?
• How do these structural changes influence the mechanical properties of the particles?
• How does the internal DNA contribute to the mechanical stability of the virus capsid?
• How do the mechanical properties of T7 phages relate to the topology and dynamics of capsomeric proteins and intercapsomeric interactions?
• What is the role of mechanical force in triggering DNA ejection of the T7 phage?
3 METHODS
3.1 Virus Preparation
T7 bacteriophage (ATCC 11303-B7) was grown in Escherichia coli (ATCC 11303) host cells and purified according to the established methods86. The phage suspension was concentrated on a CsCl gradient and dialyzed against buffer (20 mM Tris-HCl, 50 mM NaCl, pH 7.4)7. The T7 bacteriophage concentration was determined from optical density by using an extinction coefficient of ε260 = 7.3×10³ L/(mol×cm).
3.2 Surface Treatment and Sample Preparation for AFM
T7 bacteriophage stock solution was further diluted 100 times in PBS (137 mM NaCl, 2.7 mM KCl, 10 mM Na2HPO4, 1.8 mM KH2PO4, pH 7.4) prior to deposition. Due to the icosahedral shape of the virus particles the contact area between the capsids and the mica surface is small. Thus, we functionalized the mica in two steps to cross-link the capsid proteins to the surface87. This treatment improved the stability and reliability of the AFM imaging in liquids. The first part of the two-step surface modification was to place positively charged amino groups onto the mica by covalent attachment of silanizing agents or poly-L-lysine (Fig. 9.). These two different agents led to similar results, but required a slightly different treatment process. For silanization, a glass exsiccator was used in fume hood to ensure a separated and closed container for evaporation.
First, the exsiccator was purged with nitrogen gas for 2 minutes, then 150 µl of APTES ((3-Aminopropyl) triethoxysilane, (99%, Sigma-Aldrich, St. Louis, MO) and 50 µl of N,N-diisopropylethylamine (99%, distilled, Sigma-Aldrich) was placed into two small separate containers. Next, the exsiccator was purged again with nitrogen for an additional 2 min and freshly cleaved mica was placed near to the containers. Following another 2 min purging with nitrogen, the exsiccator was sealed off while leaving the mica exposed to APTES vapor overnight. The mica (AP-mica) was stored in sealed exssicator until the next treatment step. The alternative poly-L-lysine (PLL, Sigma-Aldrich, St. Louis, MO) treatment started with the deposition of the undiluted solution onto freshly-cleaved mica, and after 15 min incubation it continued with rinsing 3 to 5 times with 100 µl of milliQ water and finished with drying the surface by gentle stream of nitrogen or air from aerosol duster.
Fig. 9. Steps of glutaraldehyde cross-linking to the lysine residues of virus capsid. Mica reaction with APTES (I.), APTES amino group reaction with glutaraldehyde (II.), aldehyde group reaction with lysine (III.), crosslinked lysine residue (IV.).
The second part of the two-step surface modification process was the binding of zero-length cross-linker glutaraldehyde onto the modified AP-mica. This reagent forms stable binding with lysine residues of the sample. In this procedure 100 µl of 5% w/v glutaraldehyde (grade I, Sigma-Aldrich) solution was pipetted onto the previously modified mica immediately after the removal from the exsiccator. After 30 min incubation it was rinsed 3 to 5 times with 100 µl milliQ water and dried with a gentle stream of air from aerosol duster or nitrogen. Fig. 9. shows the steps of surface modification and the binding with the sample.
The glutaraldehyde-treated mica (GD-mica) was always prepared freshly before the incubation of the virus solution.
3.3 AFM Imaging of Virus Particles
Non-contact mode AFM imaging and nanoindentation experiments were performed with an Asylum Research Cypher instrument (Asylum Research, Santa Barbara, CA). The diluted T7 bacteriophage sample was applied to functionalized GD-mica. Unbound viruses were removed by gentle washing with PBS after 30-60 min incubation. The surface-attached particles were scanned in PBS buffer using non-contact mode. In order to preserve the
integrity of the particles and keep them bound stable to the surface, a force well below 100 pN was used by setting the free amplitude and setpoint of the cantilever low.
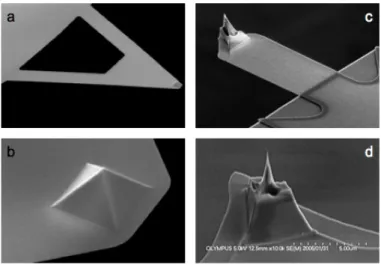
For high-quality imaging, we used silicon cantilever (Olympus BL-AC40TS-C2) with an 8 nm radius tetrahedral tip (Fig. 10.). The 512 × 512-pixel images were collected at a typical scanning frequency of 0.6–1.5 Hz. For temperature-dependent measurements we used the BioHeater module of the AFM instrument to heat up the surface attached particles to either 65 or 80 ˚C for 15 min. The temperature was kept constant with a precision of 0.1 ˚C. The heat-treated samples were cooled back to room temperature prior to imaging and nanomanipulation.
Fig. 10. SEM images of triangular (a,b) and conical (c,d) AFM cantilevers. For force measurement pyrex-nitride Nanoworld cantilever (PNP-TR) was used with pyramidal tip (b) with radius of <10 nm. For imaging silicon Olympus BL-AC40TS-C2 cantilever was used with an 8 nm radius tetrahedral tip (d). (Source: http://www.afmprobeshop.com) 3.4 Image Analysis
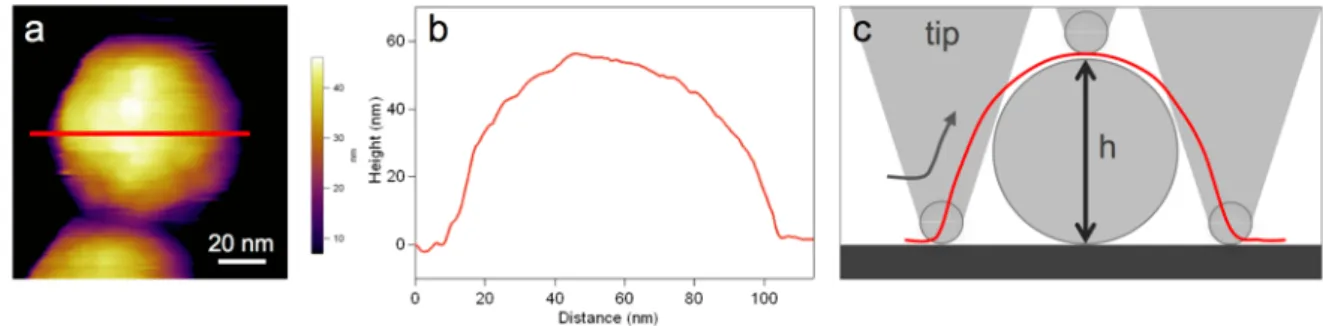
The images acquired by AFM scanning provide rich topological information of the surface- attached samples. Subsequent image analyses allow to measure the different features of the samples and to compensate for measurement artifacts. The generally conical or pyramidal shape of the tip causes lateral expansion of the features on the image. This tip-sample geometrical dilation is non-negligible when the dimension of the surface asperities or the sample size are comparable with the tip radius. Fig. 11. shows the geometric parameters associated with the dilation process. This effect is significant when scanning viruses because the tip radius (8 mm) and the particle diameter (50-60 nm) are of the similar order of
magnitude. The effect of such dilation can be corrected with post-processing. On the other hand, the height of the samples relative to the mica surface can be determined with subnanometer precision. Since the T7 bacteriophage is a spherical particle, its diameter can be precisely determined based on height measurements only. The height profile of an arbitrarily chosen region of the image can be evaluated using the AFM controller and analysis software (IgorPro v6.34A, Wavemetrics, Lake Oswego, OR). The height of the particles was always measured individually relative to the mica surface level directly surrounding it.
Fig. 11. Sample dilation due to tip convolution. Height-contrast AFM image of a virus particle attached to mica (a). Red line shows the chosen area on the image along which the height profile was plotted (b). Geometric parameters associated with the dilation process (c). The red line depicts the dilated profile/image section/line scanned by a triangular AFM tip.
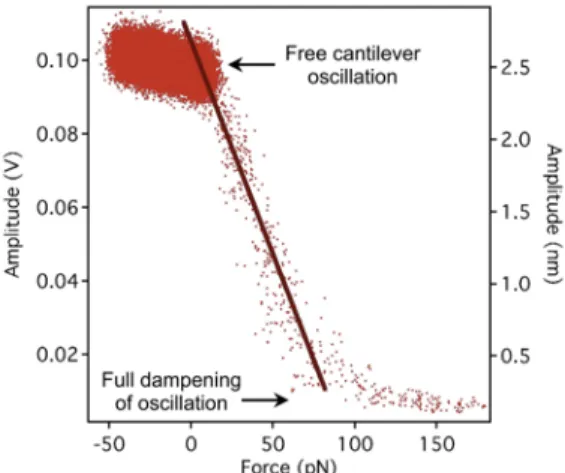
3.5 Calculation of force exerted by the oscillating cantilever on the capsid
In order to calculate the average force on the capsid exerted by the oscillating cantilever, we carried out an empirical calibration procedure for each cantilever used. In this procedure the oscillating cantilever was pressed against a rigid control (mica) surface. Then the force was measured as a function of the detected cantilever oscillation amplitude. The stiffness- calibrated cantilever (Olympus BL-AC40TS-C2) was oscillated at its resonance frequency (20-27 kHz) by using photothermal excitation (BlueDriveTM) with a free amplitude of 100 mV, which corresponded to an amplitude of 2.5-3.5 nm depending on cantilever parameters. Stiffness calibration of the cantilever was carried out by using the thermal method24. The cantilever was moved with a constant rate (50 nm/s) towards the surface and both the average force and the oscillation amplitude (in terms of both position-sensor voltage and absolute distance) were measured. A calibration curve so obtained is shown in Fig. 12. By selecting an amplitude set- point for the feedback of the AFM imaging, we
adjusted the average force, exerted by the cantilever on the capsid, between approximately 10 pN and 40 pN.
Fig. 12. Calibration curve of the average cantilever force as a function of oscillation amplitude expressed either as position-sensor voltage (left axis) or absolute distance (right axis).
3.6 Indentation Experiments on Virus Particles
Prior to starting the indentation experiment the virus particles were scanned to verify their intactness, locate single particles and position the tip above the center of the selected particle. First, the viruses were manipulated by pressing the cantilever tip against the apex of the particles until reaching a predefined maximal force, then pulling it back with a constant pre-adjusted rate. The typical velocity of the cantilever was 1 µm/s. The indentation experiments were also carried out in PBS buffer using a pyrex-nitride cantilever (Nanoworld PNP-TR, pyramidal tip, radius <10 nm, Fig. 10.). This tip was suitable to these experiments because it was both sharp and its nominal stiffness was stiff enough (0.3 N/m) to indent the relatively hard virus particles. As the output of the indentation experiment force-distance curves (FZC) were recorded. FZC involves the bending of two spring in series, that of the cantilever and of the virus particle. To remove the unwanted effect of cantilever bending in the FZC curve, a calibration curve was recorded on the solid mica surface. The force- deformation curve (FDC), which shows the force as a function of only the indentation of the particle, was obtained by subtracting this calibration curve from the original FZC. The stiffness was determined for each cantilever using the thermal method.
3.7 Indentation Experiment Analysis
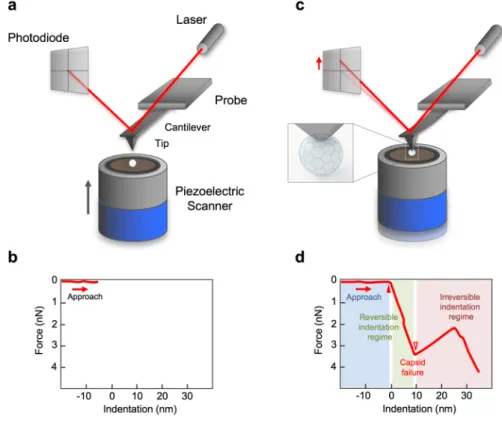
Analysis of the FDC curves gained by indentation experiment provides information about the mechanical properties of the capsid 58. Fig. 13. shows the experimental setup of an indentation, demonstrating the movement of the AFM probe and the corresponding curves.
Fig. 13. Schematic diagram of AFM nanoindentation of a virus. (a) The piezo is extending but the AFM tip has not yet reached the virus surface and (b) therefore the exerted force is zero. (c) The AFM tip indents the virus particle while the cantilever bends; the exerted force on the tip is measured by the changes of laser signal detected on the quadrant photodiode.
(d) The indentation force is plotted as the function of indentation depth.
Fig. 13.d shows a schematic FDC curve as a result. The curve has three main regions. When the tip is approaching the surface by extending the z-piezo, the force is zero because the tip is not in contact with the sample, hence the cantilever does not bend. From the point when the tip reached the capsid (Fig. 13.d filled/solid triangle), force begins to rise. Initially the force curve displays a linear regime with positive slope which corresponds to the deformation of the virus as a Hookean particle. The slope of this linear section yields the stiffness of the particle. When the capsid is unable to withstand further loading, the force abruptly drops, which corresponds to the capsid fracture (Fig. 13.d open triangle). The regime immediately following capsid breakage corresponds to the unloaded swinging of the
cantilever towards its equilibrium position. Accordingly, the slope of this region is equal to cantilever stiffness. Subsequently the force may begin to rise again. In this final region the mechanical properties of the broken capsid are manifested. In addition to the determination of the stiffness, the indentation depth (the distance between the contact point and the capsid failure, Fig. 13.d width of the green area) and the corresponding breaking force give further information about the capsid mechanical characteristics.
3.8 Analysis of steps in force spectra
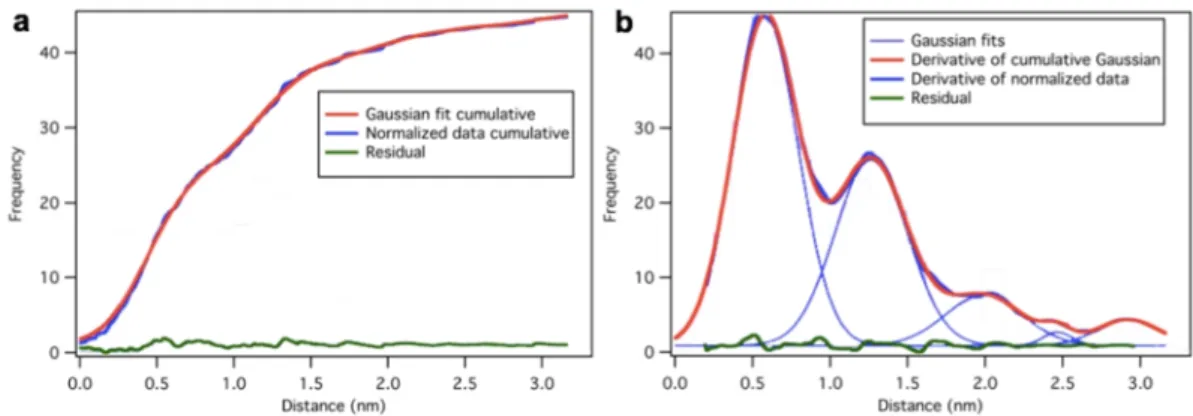
In the force spectra we often observe stepwise transitions. These transitions cause discrete indentations of different magnitude. To obtain the distribution of the steps with minimal bias, we applied the following procedure of data analysis. First, the raw step-size data were sorted in increasing order. Second, a monotonously increasing sequential number versus distance curve was generated. Third, from this curve, after normalization by dividing each sequential number with the maximal sequential number, the cumulative distribution function of the dataset was computed (Fig. 14.a). Finally, the smoothed derivative of the cumulative distribution function was computed, which yielded the density function of the distribution. This distribution was fitted by multiple Gaussians without any preconception (Fig. 14.b). Following numerical integration of all the fitted Gaussians we obtained the calculated cumulative distribution function (Fig. 14.a). Subtracting the cumulative distribution function of the dataset from the calculated one, we computed the residue which slightly fluctuated around zero, proving the goodness of fit.
Fig. 14. Analysis of step data in the force spectra. (a) The integrated Gaussian-fit data (red) overlaid on the normalized cumulative step-size dataset (blue). Residual (green) curve shows the difference of the two curves. Histogram data is highlighted in the background for reference. (b) Gaussian fits (thin blue lines) and their sum (red) overlaid on the derivative of the normalized cumulative dataset (blue).
4 RESULTS
4.1 Temperature-Dependent Topography and Nanomechanics of Bacteriophage T7
4.1.1 Topographical Structure of Heat-Treated T7 Phages
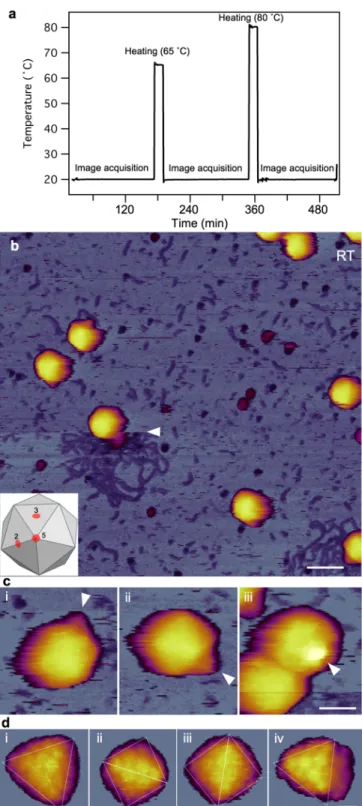
To explore the heat-induced topographical changes in T7 bacteriophages, we exposed them to two-stage thermal treatment (65 ˚C, 80 ˚C) and studied the temperature-induced effects on the capsid using AFM. Previous UV absorption and CD spectroscopic melting experiments showed that the T7 bacteriophage releases most of its DNA in a transition occurring between 50 and 60 ˚C 6–9. A second transition occurs at a temperature above 80 ˚C and it is related to DNA denaturation. Recent atomic-force and electron microscopy and calorimetric measurements have also revealed thermally induced DNA release in other viruses88–94. Since the absorption melting experiments gave us information about the virus particles only through the structural changes of their DNA, we decided to explore the thermally-induced changes in the capsid proteins using AFM. During the temperature- dependent experiments the sample was incubated for 15 minutes at either 65 or 80 ˚C, then cooled back to room temperature for AFM imaging (Fig. 15.a).
First, mature T7 phage particles containing 40 kbp-long genomic DNA cross-linked to GD-mica were imaged with AFM to obtain information about their morphological properties. Imaging was carried out in buffer using tapping-mode to allow accurate control of the maximal tip-sample force. Applying low force to the sample during scanning helps to keep the particles intact and attached to the surface. At room temperature, the virus particles exhibited an intact, sphere-like structure in the AFM images (Fig. 15.a).
Furthermore, using a sharp tip allowed us to resolve the cogwheel shape and the central pore of the capsomers and, thereby, to identify the adsorbing symmetry of the capsids (Fig.
15.d)44. Around some virus particles, DNA clusters were showing on the surface due to occasional mechanically-induced DNA ejection. The conical tail complexes also became visible at different locations on most phage particles, depending on their binding orientation (Fig. 15.b). In the background, there were a few globular particles apparent, which may correspond to the core T7 phage proteins that got ejected simultaneously with DNA.
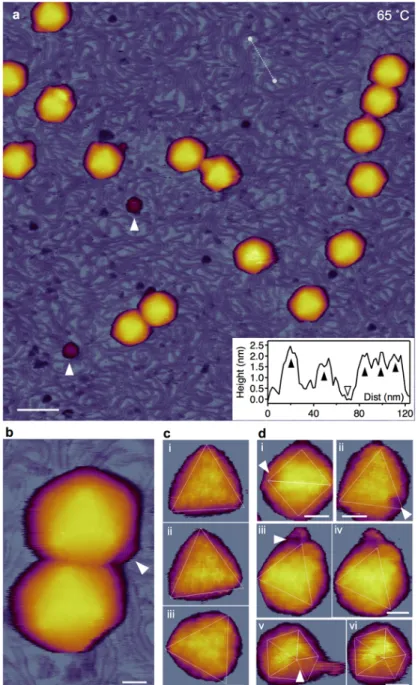
Fig. 15. AFM imaging of surface-immobilized untreated T7 bacteriophages at room temperature (20 ˚C). (a) Thermal profile of sample treatment protocol. (b) Overview of a 1 µm x 1 µm sample area. Slow AFM raster scan direction is from top to bottom of the image. White arrowhead points at the nearly instantaneous event of mechanically induced DNA ejection. Scale bar 100 nm. (c) AFM images of T7 phage particles displaying their conical tail in different orientations. White arrowheads point at the tail apices. Scale bar 30 nm. (d) High-resolution AFM images of the T7 phage surfaces with resolvable capsomers. Views along the two-fold (ii, iii) and three-fold symmetry axes (i, iv) are shown.
Scale bar 10 nm.
Following the topographical exploration of the capsid structure at room temperature, we heated the same sample to 65 ˚C for 15 min then cooled it back to 20 ˚C for image acquisition (Fig. 15.a). Upon 65 ˚C treatment, the topography of the sample has changed significantly (Fig. 16) The most apparent change is that the substrate surface became covered with a meshwork of DNA. The cross-sectional height profile of the background showed that the height of an individual strand is around 2 nm (Fig. 16.a inset), which closely matches the diameter of DNA. This shows that the DNA was indeed released from the capsid due to the heat treatment, as suggested earlier8. The second remarkable change in the images is that the conical tail complex of most capsids disappeared. Even where the tail was visible, its shape was stubby and lost its conical nature (Fig. 16.b). Thus, we speculate that the DNA has been released from the particles because of a separation of the tail complex from the capsid. Considering that the gp8 protein plays an important role in connecting the tail complex to the capsid, we hypothesize that it might be a thermally sensitive component of T7 phage. We also found large (>10 nm) globular particles in the background which may correspond to the residues of the tail complexes that broke off. The third change compared to the non-treated particles, is that the capsid surface became more faceted as the icosahedral edges and faces got more pronounced, which could be explained by a slight shrinkage of the capsid due to the DNA release (Fig. 16.d-e). Despite all these changes, the cogwheel shape of the individual capsomers remained intact (Fig. 16.c). In a few capsids, we noticed gaps in the position of the pentamers, which we identify as the exit holes through which DNA escaped (Fig. 16.d)
Fig. 16. AFM imaging of T7 phages treated at 65 ˚C. (a) Overview of a 1 µm x 1 µm sample area. White arrowheads point at large (>10 nm) globular particles. Scale bar 100 nm. Inset, topographical height map along an arbitrarily chosen line in the background (white dashed line). Black arrowheads point at DNA cross-sections, whereas the empty arrowhead at the substrate (mica) surface. (b) AFM image of two T7 particles. White arrowhead points at the short, stubby tail complex visible on one of the particles whereas there is no visible tail on the other one. Scale bar 20 nm. (c) T7 phage particles with resolvable capsomers on their surfaces. Views are along the three-fold symmetry axes. Because of contrast enhancement, only the top facets are visible and the rest of the capsid is hidden. Scale bar 10 nm.
(d) T7 particles with resolvable DNA exit holes (white arrowheads). The exit hole appears as a gap at the location of a missing pentagonal capsomer at one of the icosahedron vertices.
Images viewed along the two-fold (i), three-fold (ii, iii, iv) and five-fold symmetry axes (v, vi) are shown. Images (iii) and (v) are reconstructed from the rightward fast AFM scanlines, whereas images (iv) and (vi) are from leftward (reverse) scan lines from the same sample area. Scale bars, 20 nm.
Following the topographical exploration of the capsid structure treated at 65 ˚C, we exposed the samples to 80 ˚C temperature and imaged them after cooling back to room temperature (Fig. 15.a). In this case, the background was even more densely populated with DNA strands (Fig. 17.a). In addition, we observed a large number of globular particles, as well as large aggregates scattered in the background (Fig. 17.b). Given that the size of these aggregates far exceeds that of the tail complex and they consist of globular particles, we hypothesize that they originate from the capsid wall. Furthermore, in high-resolution AFM images the capsomers appear swollen with less distinct cogwheel structure (Fig. 17.c).
Fig. 17. AFM imaging of T7 phages treated at 80 ˚C. (a) Overview of a 1 µm x 1 µm sample area. Scale bar 100 nm. (b) White arrowheads point at large (>10 nm) globular particles.
(c) High-resolution AFM images of 80 ˚C -treated particles with resolvable capsomers on their surface. Views along the three-fold (i, iv) and two-fold symmetry axes (ii, iii). Scale bar 10 nm.
4.1.2 Nanomechanics of Heat-Treated T7 Phages
Following the topographical exploration of the heat-treated particles, we manipulated them with AFM to reveal the thermally-induced changes in their nanomechanical properties. We performed indentation experiments by pressing the surface-immobilized particles with a sharp tip at their center along the z-axis (see details in Materials and methods). The maximal force was pre-adjusted to 10 nN, sufficiently high to achieve the total rupture of the particles in order to register their overall mechanical response. The results obtained on phages at room temperature (RT) are shown below (Fig. 18.).
Fig. 18. Nanomechanics of T7 phages. (a) Schematic diagrams of mechanical manipulation (b) Representative force versus indentation curve obtained at room temperature. Red and blue traces are indentation and retraction half cycles, respectively. Notable stages of the nanomechanics experiments are marked with small Roman numerals (i-iv). Variables extracted from the data (breaking force F, maximal indentation distance x, capsid height h) are shown with italic letters. (c) Overlay of 80 similar force versus indentation curves collected in independent experiments on different phage particles at room temperature. (d) Overlay of 55 similar force versus indentation curves (indentation half cycle only) collected at room temperature in independent experiments that are similar to each other but are distinctively different from the dataset in (c).
The initial contact of the AFM tip with the capsid corresponds to an “elbow” in the FDC curves at around 60 nm (Fig. 18 i), followed by a linear section associated with the reversible regime of the capsid deformation (Fig. 18 ii). Increasing the load to around 8nN, the force
abruptly dropped, which marks the failure and collapse of the capsid (Fig. 18 iii). Further pressing the tip, the force fluctuated below 2 nN, then it began to rise sharply as it reached the substrate surface. The retraction force trace was essentially featureless (Fig. 18 iv), indicating that the conformational change of the capsid was irreversible. Although for the majority of the capsids similar force traces were recorded (Fig. 18.c), a fraction of them were significantly different and had reproducible appearance (Fig. 18.d). In the latter traces the initial linear regime ended at around 2 nN, we refer to these as putative empty capsids.
The force traces of capsids treated at 65 ˚C (Fig. 19.a-b) were similar to those of empty capsids, as the capsid breakage occurred at around 2 nN and then the force fluctuated before abruptly increasing as it reached the substrate surface. For the force traces of capsids treated at 80 ˚C (Fig. 19.c-d) the overall appearance was similar to that seen for the 65 ˚C -samples, but the capsid breakage and the following force fluctuation occurred at greater force levels.
Fig. 19. Nanomechanics of heat-treated T7 phages. (a) Representative force versus indentation curve measured on a T7 phage particle that has been exposed to 65 ˚C temperature for 15 minutes. Red and blue indicate indentation and retraction half-cycles, respectively, throughout all figures. (b) Overlay of 45 similar force versus indentation curves collected in independent experiments on different phage particles heat-treated at 65 ˚C. (c) Representative force versus indentation curve measured on a T7 phage particle that has been exposed to 80 ˚C temperature for 15 minutes. (d) Overlay of 41 similar force versus indentation curves collected in independent experiments on different phage particles heat-treated at 80 ˚C.
4.2 Force-Induced Structural Changes of the Bacteriophage T7
4.2.1 Discrete Stepwise Transitions
To study the mechanical stability of the phage particles, we performed fatigue experiments by repeatedly applying load with a maximal 1.5 nN force, lower than the average breaking force (7 nN). This loading force created an approximately 10 nm maximal indentation and is low enough to prevent capsid failure during the first load, but sufficiently high to induce it after multiple cycles.
The repeatability of indentation cycles before the capsid failure corresponds to the fatigue of the capsid.
In an approximately one-fifth of the indented phage particles the force traces contained multiple discrete, step-like transitions (Fig. 20.). Although previous nanoindentation experiments of viruses made note of transient breakage points and transitions along the reversible indentation regime, they have not been analyzed systematically and in details.
Transitions typically appeared as a sequence of sawtooth-like features, peaks followed by a sudden transient drop in force. After a sawtooth-like feature the force continued to rise linearly again until the next peak or the breaking point. The slope of the linear sections between the peaks was unaltered indicating that in spite of the transitions, the global elastic properties of the capsid remained.
The number of the subsequent curves often reached up to one hundred before it resulted in capsid failure and the curves systematically contained these saw-tooth like steps (Fig. 20.b).
The repeatability of the indentation force traces and the recurrence of the transitions indicate that the capsid recovered from the force-induced structural changes on the time-scale of the experiment (10 ms).
The distribution analysis of the transition step-sizes (see in Materials and methods) showed peaks at integer multiples of approximately 0.6 nm (0.58 nm ± 0.21, S.D). This suggests that a single transition corresponds to a ∼0.6 nm shift of the capsid structure, which might correspond to a slight, discrete structural change closely related to the capsomers.
Fig. 20. Stepwise transitions and mechanical fatigue of T7 bacteriophage capsid. (a) Representative force versus distance curve obtained by indenting the capsid. Step size was measured as the distance change at the force of the sawtooth peak. (b) 97 consecutive FDCs collected on the same capsid at room temperature. The consecutive curves were shifted along the distance axis by 2 nm for better display. (c) Distribution of the transition step size with the fitted Gaussian curves. The peaks are centered at 0.58 (±0.21), 1.26 (±0.24), 1.99 (±0.25), 2.47 (±0.09) and 2.92 (±0.19) nm.
4.2.2 Rate Dependence of the Stepwise Transition
To gain further insight into this structural consolidation process we examined the retraction force traces corresponding to the previously analyzed indentation traces (Fig. 21.a). The trace and retrace curves showed similar discrete step-like transitions that aligned with some hysteresis, although the direction of their pathway was reversed. The time duration of the transition steps in the retraction traces was less than 10 ms, which indicates that the structural consolidation was rapid and proceeded against force.
To estimate the energetic topology of the mechanically-driven transitions, we performed dynamic force spectroscopy experiments using different loading rates in the range of 0.1 to 5 µm/s (Fig. 21.b). Towards the higher loading rates the hysteresis area increased (Fig.
21.b) due to the simultaneous increase of the indentation-step forces and the slight decrease of the retraction-step forces.
Fig. 21. Reversibility and rate-dependence of the stepwise transitions. (a) Representative indentation (blue) – retraction (gray) force versus distance curves obtained in consecutive trials on a T7 bacteriophage. The curves were shifted progressively along the distance axis for clarity. The red trace corresponds to the indentation force curve of capsid breakage.
(b) Indentation – retraction force traces collected using different cantilever velocities (values indicated in the figure in µm s−1).
4.2.3 The Role of the Genomic DNA in the Force-Driven Transitions
To explore the importance of the genomic DNA in the stepwise transitions we carried out fatigue experiments on emptied particles.
First, we treated the particles at 65 ˚C for 15 minutes to release their DNA and then indented them with 1.5 nN maximal force in repeated cycles similarly as in the measurement at room temperature. Here we also observed repeatable indentation force traces, however the number of the indentation prior to the capsid failure was significantly lower than at room temperature. Fig. 22.a shows that the capsid collapsed after only 15 indentations compared with 96 at room temperature, which indicates that the DNA indeed contributes to the mechanical stability of the phage particles and increases the resilience against the mechanical fatigue of the capsids. However, the indentation curves similarly contained discrete step-like transitions which show remarkably similar appearance to those observed in the room-temperature phage particles (Fig. 22.a). We performed the same distance step size analysis as previously and found that the distribution is also multimodal (Fig. 22.b).
The peaks at 0.59 nm (± 0.37 nm) and 1.24 nm (± 0.26 nm) correspond well to the first and second peaks of the room temperature control, at integer multiples of the ~0.6 nm unit step
size. However, an additional peak appeared at 0.29 nm (±0.19 nm), which is one-half of the unit step size.
Fig. 22. Discrete nanoindentation steps in heat-treated (65 ˚C) T7 bacteriophage capsids.
(a) Force versus distance curves collected in 16 consecutive nanoindentation experiments on the same capsid. The curves were shifted along the distance axis with 1 nm to better display changes in transition positions. The maximal indentation force was limited to 1.5 nN throughout the experiment. (b) Distribution of the transition step size. Gaussian were fitted on the cumulative step-size dataset. The peaks are centered at 0.29 (±0.09), 0.59 (±0.19) and 1.24 (±0.13) nm.
4.3 Mechanically-Driven DNA Ejection of the Bacteriophage T7
4.3.1 Mechanically-Triggered DNA Ejection
We previously observed in our measurements that the DNA can occasionally release from the capsid during the AFM scanning (Fig. 15.b). Therefore, we decided to explore the role of the mechanical force exerted by the tip on the capsid in triggering DNA ejection. To visualize the topographical structure and mechanically-induced changes of the phage particles, we covalently attached them to the surface as previously (see in Materials and methods) and scanned them with low exerted force (Fig. 23.). In these images, we were able to resolve the tail of the phages, which appeared as a cone with a mean length of 22.8 nm (±3.0 nm SD, n=149). The tail lengths were determined by analyzing the height cross-sectional profile of the capsids (Fig. 23.b) and the measured mean length compared well with previously reported data (23nm95).
Fig. 23. Measurement of the T7 phage tail length. (a) Height-contrast AFM image of a T7 phage. The dotted line marks the linear section along which topographical height data were collected. (b) Topographical height as a function of distance along the linear section. (c) The calculated tail-length projected onto the AFM image. (d) Distribution of the calculated tail lengths.
During the scanning, the DNA suddenly became visible as the tip passed through the capsids (Fig. 24.). The DNA strands appeared as random threads bound to GD-mica and emerged abruptly from one scan line to the next. This suggests that the DNA may be released by the mechanical tapping of the capsid by the cantilever tip. The ejected DNA was particularly well resolvable in phase-contrast AFM images due to the differences in the viscoelastic properties of DNA and the mica substrate (Fig. 24.c. and d.).
Fig. 24. In situ AFM of DNA ejection from the T7 bacteriophage. (a-b) Sequential height- contrast AFM images collected during (a) and following (b) DNA ejection. Collection of the two images was separated by 7 minutes. White arrows indicate AFM line-scanning direction. Red arrow points at the scan line in which DNA suddenly appeared, while the red arrowhead points at the tail complex, the surface of which became fuzzy after DNA ejection.
(c-d) Sequential phase-contrast AFM images collected during (c) and following (d) DNA ejection. Images are separated by 8 minutes. Black arrows indicate AFM line-scanning direction. Green arrow points at the scan line in which DNA suddenly appeared in the image.
To explore the details of DNA ejection further, we performed additional in situ AFM measurements by scanning the same capsids continuously as a function of time (Fig. 25.).
Fig. 25. In situ AFM of mechanically-triggered DNA ejection. Height-contrast AFM images are with gray background and annotation indicating the collection time of the frame in minutes. Phase-contrast AFM images of the same T7 particle are with orange background.
Frame size is 450 nm x 450 nm.