The Iso2k database: a global compilation of paleo- 1 8O and 2 H records to aid δ δ
understanding of common era climate
Article
Published Version
Creative Commons: Attribution 4.0 (CC-BY) Open Access
Konecky, B. L., McKay, N. P., Churakova (Sidorova), O. V., Comas-Bru, L. ORCID: https://orcid.org/0000-0002-7882-4996, Dassié, E. P., DeLong, K. L., Falster, G. M., Fischer, M. J., Jones, M. D., Jonkers, L., Kaufman, D. S., Leduc, G.,
Managave, S. R., Martrat, B., Opel, T., Orsi, A. J., Partin, J.
W., Sayani, H. R., Thomas, E. K., Thompson, D. M., Tyler, J.
J., Abram, N. J., Atwood, A. R., Conroy, J. L., Kern, Z., Porter, T. J., Stevenson, S. L., von Gunten, L. and Iso2k Project
Members, (2020) The Iso2k database: a global compilation of paleo- 1 8 O and 2 H records to aid understanding of common δ δ era climate. Earth System Science Data, 12 (3). pp. 2261-
2288. ISSN 1866-3516 doi: https://doi.org/10.5194/essd-12- 2261-2020 Available at http://centaur.reading.ac.uk/91937/
It is advisable to refer to the publisher’s version if you intend to cite from the
Publisher: Copernicus Publications
All outputs in CentAUR are protected by Intellectual Property Rights law, including copyright law. Copyright and IPR is retained by the creators or other copyright holders. Terms and conditions for use of this material are defined in the End User Agreement .
www.reading.ac.uk/centaur
CentAUR
Central Archive at the University of Reading
Reading’s research outputs online
https://doi.org/10.5194/essd-12-2261-2020
© Author(s) 2020. This work is distributed under the Creative Commons Attribution 4.0 License.
The Iso2k database: a global compilation of paleo- δ 18 O and δ 2 H records to aid understanding of Common Era climate
Bronwen L. Konecky1, Nicholas P. McKay2, Olga V. Churakova (Sidorova)3,4, Laia Comas-Bru5, Emilie P. Dassié6, Kristine L. DeLong7, Georgina M. Falster1, Matt J. Fischer8, Matthew D. Jones9, Lukas Jonkers10, Darrell S. Kaufman2, Guillaume Leduc11, Shreyas R. Managave12, Belen Martrat13,
Thomas Opel14, Anais J. Orsi15, Judson W. Partin16, Hussein R. Sayani17, Elizabeth K. Thomas18, Diane M. Thompson19, Jonathan J. Tyler20, Nerilie J. Abram21, Alyssa R. Atwood22, Olivier Cartapanis23, Jessica L. Conroy24, Mark A. Curran25, Sylvia G. Dee26, Michael Deininger27, Dmitry V. Divine28, Zoltán Kern29, Trevor J. Porter30, Samantha L. Stevenson31, Lucien von Gunten32,
and Iso2k Project Members+
1Department of Earth and Planetary Sciences, Washington University, Saint Louis, Missouri 63108, USA
2School of Earth and Sustainability, Northern Arizona University, Flagstaff, Arizona 86011, USA
3Institute of Ecology and Geography, Siberian Federal University, Krasnoyarsk, 660041, Russian Federation
4Department of Forest Dynamics, Swiss Federal Institute for Forest, Snow and Landscape Research WSL, Birmensdorf, 8903, Switzerland
5School of Archaeology, Geography & Environmental Sciences, Russell Building, University of Reading, Whiteknights, Reading, Berkshire, RG6 6DR, United Kingdom
6EPOC Laboratory, University of Bordeaux, Bordeaux, 33615, France
7Department of Geography and Anthropology, Coastal Studies Institute, Louisiana State University, Baton Rouge, Louisiana 70803, USA
8NSTLI Environment, ANSTO, Sydney, NSW 2234, Australia
9School of Geography, University of Nottingham, Nottingham, NG7 2RD, UK
10MARUM Center for Marine Environmental Sciences, Bremen University, 28359 Bremen, Germany
11Aix Marseille University, CNRS, IRD, INRAE, Coll France, CEREGE, Aix-en-Provence, 13545, France
12Earth and Climate Science, Indian Institute of Science Education and Research, Pune, Maharashtra, 411008, India
13Department of Environmental Chemistry, Spanish Council for Scientific Research (CSIC), Institute of Environmental Assessment and Water Research (IDAEA), Barcelona, 08034, Spain
14Polar Terrestrial Environmental Systems and PALICE Helmholtz Young Investigator Group, Alfred Wegener Institute Helmholtz Centre for Polar and Marine Research, 14473 Potsdam, Germany
15L-IPSL, CEA-CNRS-UVSQ-Université Paris Saclay, Laboratoire des Sciences du Climat et de L’Environnement, Gif-sur-Yvette, 91191, France
16Institute for Geophysics, University of Texas at Austin, Austin, Texas 78758, USA
17School of Earth and Atmospheric Science, Georgia Institute of Technology, Atlanta, Georgia 30332, USA
18Department of Geology, University at Buffalo, Buffalo, New York 14260, USA
19Department of Geosciences, University of Arizona, Tucson, Arizona 85719, USA
20Department of Earth Sciences, The University of Adelaide, Adelaide, SA 5005, Australia
21Research School of Earth Sciences and Centre of Excellence for Climate Extremes, Australian National University, Canberra, ACT 2601, Australia
22Department of Earth, Ocean, and Atmospheric Sciences, Florida State University, Tallahassee, Florida 32306, USA
23Institute of Geological Sciences & Oeschger Centre for Climate Change Research, University of Bern, Bern, 3012, Switzerland
24Department of Geology, University of Illinois at Urbana-Champaign, Urbana, Illinois 61822, USA
25Australian Antarctic Division, Kingston, TAS 7050, Australia
26Department of Earth, Environmental, and Planetary Sciences, Rice University, Houston, Texas 77005, USA
27Institute of Geosciences, Johannes Gutenberg University Mainz, 55128 Mainz, Germany
28Norwegian Polar Institute, Tromsø, 9296, Norway
29Institute for Geological and Geochemical Research, Research Centre for Astronomy and Earth Sciences, MTA Centre for Excellence, Budapest, 1112, Hungary
30Department of Geography, University of Toronto – Mississauga, Mississauga, Ontario, L5L1C6, Canada
31Bren School of Environmental Science & Management, University of California, Santa Barbara, Santa Barbara, California 93106, USA
32PAGES International Project Office, Bern, 3012, Switzerland
+A full list of authors appears at the end of the paper.
Correspondence:Bronwen L. Konecky (bkonecky@wustl.edu) Received: 8 January 2020 – Discussion started: 5 February 2020 Revised: 11 June 2020 – Accepted: 29 June 2020 – Published: 23 September 2020
Abstract. Reconstructions of global hydroclimate during the Common Era (CE; the past∼2000 years) are important for providing context for current and future global environmental change. Stable isotope ratios in water are quantitative indicators of hydroclimate on regional to global scales, and these signals are encoded in a wide range of natural geologic archives. Here we present the Iso2k database, a global compilation of previously published datasets from a variety of natural archives that record the stable oxygen (δ18O) or hy- drogen (δ2H) isotopic compositions of environmental waters, which reflect hydroclimate changes over the CE.
The Iso2k database contains 759 isotope records from the terrestrial and marine realms, including glacier and ground ice (210); speleothems (68); corals, sclerosponges, and mollusks (143); wood (81); lake sediments and other terrestrial sediments (e.g., loess) (158); and marine sediments (99). Individual datasets have tem- poral resolutions ranging from sub-annual to centennial and include chronological data where available. A fundamental feature of the database is its comprehensive metadata, which will assist both experts and nonex- perts in the interpretation of each record and in data synthesis. Key metadata fields have standardized vocab- ularies to facilitate comparisons across diverse archives and with climate-model-simulated fields. This is the first global-scale collection of water isotope proxy records from multiple types of geological and biological archives. It is suitable for evaluating hydroclimate processes through time and space using large-scale synthe- sis, model–data intercomparison and (paleo)data assimilation. The Iso2k database is available for download at https://doi.org/10.25921/57j8-vs18 (Konecky and McKay, 2020) and is also accessible via the NOAA/WDS Paleo Data landing page: https://www.ncdc.noaa.gov/paleo/study/29593 (last access: 30 July 2020).
1 Introduction
1.1 Progress and challenges in the synthesis of Common Era hydroclimate
The past ∼2000 years, otherwise known as the Common Era (CE), are an important research target for contextual- izing modern climate change. Decades of paleoclimate re- search have yielded numerous records spanning all or part of this time period, making it sufficiently data-rich to assess the range of natural (internal and forced) climate variability prior to the Industrial Revolution. These records are also used in conjunction with climate model simulations to detect and attribute anthropogenic climate change. Over the past sev-
eral years, large-scale data synthesis efforts within the in- ternational paleoclimate community have produced impor- tant constraints on regional to global surface air and ocean temperature patterns during the CE (McGregor et al., 2015;
McKay and Kaufman, 2014; PAGES 2k Consortium, 2013, 2017, 2019; Tierney et al., 2015). However, progress on the synthesis of hydroclimate patterns has been limited (PAGES Hydro2k Consortium, 2017), despite the societal relevance of the changing water cycle (e.g., Kelley et al., 2015). The water cycle is a far more complex target than surface air and ocean temperature, and different proxy systems track differ- ent aspects of the water cycle in different ways (PAGES Hy- dro2k Consortium, 2017). For example, annual precipitation amount at any given location on the Earth’s surface is gov-
erned not just by atmospheric processes that deliver moisture to the region but also by topography, varying characteristics of storms and associated clouds, dynamics of the seasonal cycle, and variations in the contribution of extreme precipi- tation events to the water budget (Bowen et al., 2019).
Individual paleoclimatic proxy types are often sensitive to multiple aspects of the water cycle that can be difficult to dis- entangle, making it challenging to directly compare among proxy types. For example, precipitation amount in the Arctic could be inferred from two common precipitation proxies:
grain size from lake sediments and accumulation rates from ice cores. Grain size fluctuations in lake sediments can track extreme precipitation and runoff events, but inter-lake com- parison requires knowledge of lake morphometry and com- peting moisture source regions (Conroy et al., 2008; Kiefer and Karamperidou, 2019; Rodysill et al., 2019). Comparison of sedimentary grain size to snow accumulation rates would be uninformative without understanding how annual precip- itation and dry season ablation, which both affect accumu- lation rates, are related to moisture delivery from extreme precipitation events (Hurley et al., 2016; Thompson et al., 1986). Snow accumulation rates can be strongly affected by air temperature, whereas grain size is generally not. Thus, although comparison of such heterogeneous hydroclimatic proxies is certainly possible, the lack of a common environ- mental signal to serve as a reconstruction target has been a major hindrance to the global reconstruction of hydrocli- matic variables. These challenges have been further exacer- bated by archive- and record-specific standards for data for- matting, sampling resolution, metadata availability, and pub- lic archiving. These limitations may be addressed by creating a metadata-rich, multi-proxy, and multi-archive database of hydrological proxies united through standardized formatting and a common environmental signal: water isotopes.
1.2 The potential for a network of paleo-water isotope records to track past hydroclimate variations In order to address these challenges, we focus here on the stable oxygen (δ18O) and hydrogen (δ2H) isotopic composi- tions of environmental waters such as precipitation, seawater, lake water, and soil and groundwater (Fig. 1). The stable iso- topic compositions of such waters (here collectively referred to as “water isotopes”) have long been used as integrative tracers of the modern water cycle (e.g., Bowen et al., 2019;
Galewsky et al., 2016; Gat, 2010; Rozanski et al., 1993). The rare heavy isotopologues of water (e.g., 1H182 O,1H2H16O) fractionate from their lighter, more common counterpart (1H162 O) during evaporation, condensation, and other phase changes, capturing an integrative history of parcels of water as they move through and among oceans, atmosphere, and land (Fig. 1). Global databases of isotopic measurements of modern precipitation (IAEA/WMO, 2019), rivers (Halder et al., 2015), seawater (LeGrande and Schmidt, 2006), and wa- ter vapor (Galewsky et al., 2016) have contributed consider-
Figure 1.Schematic illustration of the global water cycle and key metadata fields in the Iso2k database. In the Iso2k database, the histories, including phase changes and transport (“Isotope Interpre- tation”; red text and arrows), of different pools of environmental waters (“Inferred Material”; bold text) can be inferred by interpreta- tion of proxy records from different archives (“Archive”; italic text).
Base illustration by Helen Xiu, Washington University.
ably to our understanding of the contemporary water cycle on scales from microscales (e.g., cloud microphysics) (Kurita et al., 2011), to mesoscales (e.g., hurricane dynamics) (Good et al., 2014; Kurita et al., 2011), and to global scales (e.g., resi- dence time of atmospheric moisture) (Aggarwal et al., 2012).
More recently, spaceborne measurements of1H2HO/1H2O in multiple levels in the atmosphere have identified the criti- cal role of poorly observed processes such as tropical rain re- evaporation (Aggarwal et al., 2012; Worden et al., 2007) and forest–atmosphere feedbacks (Wright et al., 2017). Together with climate and Earth system model simulations, which increasingly incorporate sophisticated water isotope tracers into their hydrologic schemes (Brady et al., 2019; Haese et al., 2013), water isotopes offer observational constraints on processes that are otherwise difficult to identify or constrain (Brady et al., 2019; Nusbaumer et al., 2017).
In the paleoclimate realm, hydroclimate proxy records us- ing water isotopes are commonly obtained from a variety of natural archives, including glaciers, ground ice, cave forma- tions, corals, sclerosponges, mollusk shells, tree wood, lake sediments, and marine sediments. Of all of the proxy types that are used to reconstruct past hydroclimate changes, wa- ter isotopes are arguably the most common and certainly the most widely distributed geographically. A global, spatially distributed network of water isotope proxy records therefore has the potential to capture features of large-scale circula- tion patterns while minimizing site-specific influences from individual locations (Evans et al., 2013). Paired with an un- derstanding of water cycle processes from modern obser- vations and isotope-enabled model simulations, reconstruc- tions of paleo-δ18O andδ2H from these archives can provide
critical information about water vapor source and air mass transport history, precipitation amount and other character- istics, glacial ice volume changes, and temperature, prior to the beginning of instrumental climate observations (Bowen et al., 2019; Dayem et al., 2010; Galewsky et al., 2016; Ko- necky et al., 2019b). Further, proxy system models (Evans et al., 2013) are available for most water isotope proxies, fa- cilitating direct comparison with paleoclimate model output and thus an improved understanding of the climate dynam- ics responsible for observed (spatial and temporal) water iso- tope variability (Dee et al., 2015, 2018; Dolman and Laepple, 2018; Jones and Dee, 2018; Konecky et al., 2019a; Thomp- son et al., 2011).
One of the obstacles to synthesizing hydroclimate- sensitive paleoclimate records has been a lack of standard- ized metadata at the proxy system level that systematically encodes the important variables that are necessary for inte- grating records into a multi-proxy synthesis and interpret- ing the results. Although the paleoclimate community is in the process of defining and adopting metadata conventions (Khider et al., 2019), the “bare minimum” current standards (e.g., ISO 19115 for geographic metadata) used by World Data System (WDS) repositories (e.g., NOAA Paleoclima- tology, PANGAEA) are insufficient for characterizing water isotope proxy systems in a way that can be reliably applied to large-scale paleo-hydroclimate syntheses. One key example of this challenge is the temperature dependence of O- and H- isotopic fractionation, which has frequently been exploited to reconstruct past temperature changes in locations where air or water temperature exerts first-order influence on iso- tope ratios in precipitation and/or seawater (Kilbourne et al., 2008; Meyer et al., 2015; Porter et al., 2014). Yet in most places, the influence of temperature on isotopic fractionation is only one of many factors that influence theδ18O andδ2H of precipitation (Liu et al., 2012; Thomas et al., 2018) and seawater (Conroy et al., 2017; Partin et al., 2012; Russon et al., 2013). A network of water isotope records will inevitably contain information about air and water temperature but also other key hydroclimatic variables such as atmospheric mois- ture source changes and surface water evaporation. In order to tap the full potential of water isotope proxy records in a large-scale synthesis, the metadata associated with such records must be sufficient to capture at least a bare mini- mum of the complexity of the environmental signals that the records contain.
Additional metadata challenges have hindered progress in paleo-water isotope synthesis thus far. Most published datasets shared outside WDS repositories follow nonuniform metadata standards or contain minimal metadata. Datasets are often catalogued using different conventions (often at the authors’ discretion), stored in varying formats (e.g., text, CSV, PDF), and uploaded to different public or private (i.e., behind journal paywalls) repositories. Furthermore, datasets are frequently archived without the raw chronological infor- mation that would be required to propagate age uncertainties
if desired. These challenges are common to any paleoclimate synthesis effort and are not unique to water isotopes (At- sawawaranunt et al., 2018; Emile-Geay and Eshleman, 2013;
PAGES 2k Consortium, 2017), but they exacerbate the chal- lenge of hydroclimate-specific metadata needs.
1.3 The PAGES Iso2k database
Here we introduce the Past Global Changes (PAGES) Iso2k database, a collection of 759 water isotope proxy records (i.e., individual time series) from 506 sites (geographic loca- tions) covering all or part of the CE. The database has been assembled by the PAGES Iso2k Project (hereafter “Iso2k”).
The Iso2k database containsδ18O andδ2H-based paleocli- mate records from 10 different archives: glacier and ground ice (210 records); speleothems (68 records); corals, scle- rosponges, and mollusks (143 records); wood (81 records);
terrestrial and lake sediments (158 records); and marine sed- iments (99 records). Of these, 606 records are considered to be the primary time series for each site (Fig. 2) (see Sect. 2.4 and Table S1 in the Supplement). To address the complexity of environmental signals preserved in these proxy records, the database contains detailed metadata about each record’s isotope systematics and proxy system context, as well as details about the original authors’ climatic interpretation, chronological and analytical uncertainties, and other infor- mation required for robust data synthesis and interpretation.
Iso2k has developed a uniform framework suitable for all proxy archives in the database. The architecture of the Iso2k database therefore provides a scalable foundation on which future multi-proxy hydroclimatic databases can be built, for example, by incorporating non-isotopic proxy records, such as the grain size and ice accumulation example in Sect. 1.1.
The Iso2k database is the latest in a series of community- led paleoclimate data synthesis efforts endorsed by PAGES (Atsawawaranunt et al., 2018; Kaufman et al., 2020; Mc- Gregor et al., 2015; McKay and Kaufman, 2014; PAGES 2k Consortium, 2013, 2017; Tierney et al., 2015). The main dis- tinguishing feature of the Iso2k database is that it is not or- ganized around one archive type, climate variable, or region;
rather, it contains a systematic representation of the suite of environmental signals preserved in the water isotopic com- position of diverse paleoclimatic archives, with no a priori assumptions about the underlying climatic interpretation of those signals. This novel approach yields a database that is flexible enough to evaluate many different environmental pa- rameters and processes during the CE, depending on inves- tigator interest. The Iso2k database also contains even more comprehensive metadata descriptions than previous PAGES compilations (e.g., PAGES 2k Consortium, 2017). Database users can therefore filter for and process only the records re- quired for their research question of interest.
This data descriptor presents version 1.0.0 of the PAGES Iso2k database. We describe the collaborative process of as- sembling the database (including quality control and valida-
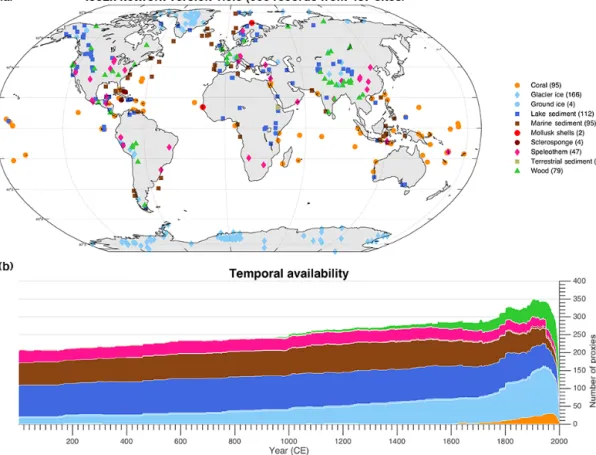
Figure 2.The Iso2k database version 1.0.0.(a)Spatial distribution of “primary time series” records in the Iso2k database. Symbols represent records from different archives.(b)Availability of records in the Iso2k database over time during the past 2000 years.
tion) and outline the structure and contents of the database (including data selection criteria, metadata, and chronolog- ical information). All data are provided in the Linked Pa- leo Data (LiPD) format (McKay and Emile-Geay, 2016) and are machine readable across different platforms and operat- ing systems. We provide files with sample code to quickly explore the database using various programming languages and platforms (R, MATLAB, Python). The Iso2k database is available for download at https://doi.org/10.25921/57j8-vs18 (Konecky and McKay, 2020). The database can also be ac- cessed via the NOAA NCEI World Data Service for Paleo- climatology (WDS-NOAA) landing page: https://www.ncdc.
noaa.gov/paleo/study/29593 (last access: 30 July 2020). The WDS-NOAA landing page contains links to download the serializations for R, MATLAB, and Python, as well as infor- mation on submission of new or revised datasets and other instructions. More information on versioning, submission of new datasets, and other database updates can be found in Sect. 6.3.
2 Methods
2.1 Collaborative model
Iso2k is a contribution to Phase 3 of the PAGES 2k Network (PAGES 2k Network Coordinators, 2017). Calls for partic- ipation in Iso2k were widely distributed, ensuring a repre- sentative cross section of scientists from various disciplines (Konecky et al., 2017, 2018, 2015; Partin et al., 2015). Iso2k built on the successes and challenges of previous PAGES 2k projects (Anchukaitis and McKay, 2014; Kaufman, 2014;
PAGES 2k Consortium, 2017; PAGES Hydro2k Consortium, 2017) when deciding on the selection criteria (i.e., require- ments for inclusion of records) and metadata fields neces- sary to make the database suitable for a wide range of appli- cations. Most work was done remotely via teleconferences, with one in-person meeting at the 2017 PAGES Open Sci- ence Meeting in Zaragoza, Spain.
The workload for assembling the data and metadata was subdivided among working groups, representing one of the following archive types: marine sediment, marine carbonates (corals, mollusks, sclerosponges), glacier ice, ground ice, lake sediments, speleothems, and wood. This archive-based approach ensured that data were collated by researchers with
an in-depth, process-based understanding of each proxy sys- tem.
2.2 Data aggregation and formatting
The database comprises publicly available water isotope proxy records that span all or part of the CE and meet the criteria outlined in Sect. 2.3. The database was compiled in two main stages. During the first stage, the archive teams obtained records, entered data, and compiled the extensive metadata outlined in Sect. 4. During the second stage, the data and metadata were extensively quality-controlled fol- lowing the procedure outlined in Sect. 2.4.
We used a variety of sources to identify records for inclu- sion in the database. We first extracted records that met our selection criteria (described in Sect. 2.3.1) from existing data compilations, including the PAGES 2k temperature database (PAGES 2k Consortium, 2017), the Arctic Holocene Tran- sitions database (Sundqvist et al., 2014), and the SISAL database (Atsawawaranunt et al., 2018). Archive teams then searched the literature and online data repositories (WDS- NOAA and PANGAEA) for additional suitable datasets. For records that had been published but that had not previously been made available in an online public repository (referred to as “dark data”), datasets were digitized from publication tables, appendices, and supplementary materials. Datasets that were not available in their original publications were requested from the authors by email. If two or more email requests went unanswered, the dataset was deemed not pub- licly available and therefore did not meet that criterion for inclusion in this database. Of the 606 primary time series in the database, more than 20 % (128 records) are dark datasets that were added by Iso2k members and are now available in a public, online, machine-readable format for the first time.
The vast majority of those datasets were from wood or from lake and terrestrial sediments (58 and 52, respectively), with an additional 14 from glacier and ground ice, 2 from marine sediments, and 2 from corals.
In addition to isotopic datasets, raw age control data (e.g.,
14C ages) were obtained for records where age–depth mod- eling is required (i.e., non-annually resolved records). Many isotopic datasets that were available through data repositories did not contain raw age control data, in which case we fol- lowed the dark data procedure described previously to obtain appropriate chronological data from the authors. For dark age control data, authors were emailed with a request for the data and a spreadsheet template in which chronological information could be added. Age control data from authors who did not respond to these requests could not be added to the database. Again, the majority of “dark” age control data added to the Iso2k database was from the lake sediments archive (over 40 age control datasets are now publicly avail- able for the first time).
Metadata (Sect. 4) were obtained from the data source, ex- tracted from the original publication, or requested from the
original data generators (again following the dark data pro- cedure above). We note that even for datasets that were pre- viously publicly available, the Iso2k database has expanded on these data by adding chronological data and compiling an extended suite of metadata not previously available in a consolidated format.
2.3 Record selection criteria
Records were screened by their respective archive teams to ensure that criteria for inclusion in the database were met.
Criteria for inclusion in the database were formulated to op- timize spatiotemporal coverage of the data, with the goal of building a comprehensive database of water isotope records that can be subsampled as needed to address diverse scien- tific questions. The selection criteria for data records to be included in the Iso2k database are as follows.
2.3.1 Record resolution and duration
The duration and temporal resolution of records included in the Iso2k database varies by archive type. For∼annually or ∼sub-annually banded archives (corals, shells, scle- rosponges, tree wood, varved lake and marine sediments, and glacier ice), the minimum record duration for inclusion in the database is 30 years. For all other archives (speleothems, non-varved lake and marine sediments), records must have a minimum duration of 200 years and contain at least five data points during the CE.
2.3.2 Chronological constraints
The PAGES 2k temperature database (PAGES 2k Consor- tium, 2017) was used as a guide for minimum chronologi- cal control criteria. Records from annually banded archives must be either cross-dated or layer-counted; records from non-annually banded archives must have at least one age con- trol point near both the oldest and youngest portions of the record, with one additional age control point somewhere near the middle required for records longer than 1000 years.
2.3.3 Peer review and public availability
To qualify for inclusion in the database, isotope records must be published in a peer-reviewed journal (i.e., not university- published theses and dissertations). Records included in ver- sion 1.0 of the database had to be published and publicly available (see definition in Sect. 2.2) before 4 May 2018.
2.3.4 Ancillary data
In some cases, paired geochemical measurements are also included in the Iso2k database to complement interpretation of the isotopic data, such as paired trace elemental measure- ments (e.g., Sr/Ca or Mg/Ca) that accompany some carbon- ateδ18O records from corals, sclerosponges, and planktonic
foraminifera, or δ13C data that accompany some carbon- ate records. Derived isotopic data for deuterium excess (d- excess) are also included for glacier and ground ice, where paired measurements of δ18O or δ2H allowed the original authors to calculate this additional hydroclimatic indicator.
Similarly, derived values for theδ18O of seawater are avail- able for coral and marine sediment records in cases where an independent temperature reconstruction was available for the same archive (e.g., Sr/Ca for corals and Mg/Ca for plank- tonic foraminifera). Where the paired carbonate δ18O and Sr/Ca or Mg/Ca records can be used to infer theδ18O of sea- water (Cahyarini et al., 2008; Elderfield and Ganssen, 2000;
Gagan et al., 1998), both time series (δ18O measured di- rectly on carbonate andδ18O seawater calculated from paired records) and ancillary, non-isotopic geochemical records are included in the database (Sect. 4).
2.4 Quality control procedure
Records considered to be a primary time series for their re- spective sites (Sect. 4; Table 6) were quality-controlled to the highest degree possible, as described below. Primary time se- ries were judged to be the one or two time series upon which the original authors based their main climatic interpretations.
For archives such as corals and speleothems, the primary time series are typically a composite of multiple records from a site or the latest of a series of modified records from a site, whereas for other archives the primary time series is one deemed to have the most robust climatic signal (e.g., for lake sediments, a biomarker of terrestrial vs. mixed terrestrial and aquatic origin). Non-primary time series were quality- controlled as much as possible and are included because they may contain valuable information for database users. Both data and required metadata fields were screened for accuracy and completeness by one or more project members, with the initials of the project member performing the final quality control (QC) check included in the Iso2k_QC_certification metadata field. Metadata fields that required standardized or controlled vocabularies were double-checked to ensure those terms were adhered to (Sect. 4). During the quality control certification process, project members used a web-based data viewer (lipdverse.org) and other visualization tools to display the raw data and metadata.
Each metadata field in the database (Tables 1–7) has a quality control certification “Level” from 1 to 3, defined as follows.
– Level 1fields are required metadata for inclusion in the Iso2k database. These fields are generalizable enough to be suitable for all archive types, and they are rec- ommended as primary fields for filtering, sorting, and querying records in the database. Level 1 required fields were subject to the highest QC standard. They fol- low standardized Iso2k vocabularies, where appropri- ate (Table 7); geographical data were checked against
maps, and interpretation fields were checked against the original publication. Examples of Level 1 metadata include geographical (ISO 19115) and publication in- formation (DOI), and the minimum required subset of isotope and proxy system interpretation metadata fields (see Sect. 4).
– Level 2fields are highly useful (but not required) meta- data fields in the Iso2k database. They may be used as secondary fields for further filtering, sorting, and query- ing records in the database; these fields may be par- ticularly useful for certain archives or to refine inter- pretations after an analysis has been performed. Exam- ples of Level 2 fields include species name (marine and lake sediments and corals) and compound chain length for compound-specificδ2H measurements (lake sedi- ments). Terminology was standardized only where nec- essary and appropriate. In other cases, these fields con- tain freeform text with direct quotes from the original publications. During the QC certification process these fields were checked against the original publication for clarity and consistency.
– Level 3fields may be useful to some users of the Iso2k database but are not generally recommended as fields for filtering and sorting records in the database. Level 3 fields are not entered as standardized vocabularies and the information is sometimes not available in the orig- inal publications (thus, these fields are blank for many records). Examples of Level 3 fields include informa- tion pertaining to the integration time of a proxy sensor.
– Automatic fieldsare the automatically generated fields that were computed directly from the data records fol- lowing QC certification. Fields use standardized vocab- ularies and units. Examples include binary fields for whether the dataset contains raw chronological control data.
Ancillary data are not quality-controlled but are included in LiPD format for reference.
3 Contents of the Iso2k database
3.1 Archive types within the Iso2k database
The Iso2k database contains data from a variety of geological and biological archives. Following proxy system terminol- ogy (Evans et al., 2013), each archive has one or more sen- sors that directly sense and incorporate environmental sig- nals, i.e., the δ18O and δ2H of environmental waters, into their structures. Over time these sensors then form, are de- posited into, or are otherwise imprinted upon an archive that is then subsampled and subjected to isotopic measurements or observations. In this section, we describe the key charac- teristics of the archives and sensors that are important for the
interpretation of the paleohydrological signals that they pre- serve.
3.1.1 Corals, sclerosponges, and mollusks
Corals, sclerosponges, and mollusks (predominantly bivalves and gastropods) form hard body parts of calcium carbon- ate (aragonite or calcite) that record the conditions of the aquatic environment in which they live (see Black et al., 2019; Corrège, 2006; Druffel, 1997; Evans et al., 2013;
Lough, 2010; Sadler et al., 2014; Surge and Schöne, 2005).
Further, except for sclerosponges (which are dated using U/Th geochronology), these aquatic carbonates contain an- nual banding structures, enabling precise chronology devel- opment. Reef-building corals represent the bulk of annu- ally resolved marine archives included in the Iso2k database.
These corals are distributed in warm shallow waters through- out the tropical oceans, whereas sclerosponges (i.e., coralline sponges or Demospongiae) and mollusks are found world- wide, the latter in both estuarine and freshwater environ- ments. Micro-sampling and laser ablation technologies allow for sub-annual to annual sampling resolution in corals, mol- lusks, and sclerosponges for elemental (e.g., Sr/Ca, Mg/Ca) and isotopic analysis (δ18O and δ13C). When living sam- ples are collected in modern waters, they contain environ- mental archives of the recent past (decades to several cen- turies), whereas dead, fossil, and archeological material can be radiometrically dated to provide windows of past iso- topic variability, some of which have been cross-dated with modern records (Black et al., 2019, and references therein).
The δ18O signal in these archives represents a combination of linear, temperature-dependent isotopic fractionation, as well as changes in the isotopic composition of the surround- ing water (δ18Ow) (Grottoli and Eakin, 2007; Rosenheim et al., 2005). In some regions, the temperature component dominates the δ18O signal, whereas in other regionsδ18Ow variability is the primary driver of the δ18O variability and reflects hydrological and/or oceanographic processes such as vertical and horizontal advection or the freshwater end- member (Conroy et al., 2017; Russon et al., 2013; Stevenson et al., 2018). In some ocean settings, the close coupling be- tween ocean and atmosphere variability leads to co-occurring cool and dry (or warm and wet) anomalies that produce com- plementary isotopic anomalies (Carilli et al., 2014; Russon et al., 2013; Stevenson et al., 2015, 2018) (e.g., ENSO vari- ability; Cobb et al., 2003). In estuarine or freshwater set- tings, mollusk δ18O values are closely linked to the local precipitation–evaporation budget (Azzoug et al., 2012; Carré et al., 2019). Coralδ18O andδ13C contain a vital effect and coralδ18O is offset fromδ18Ow, whereas mollusk and scle- rospongeδ18O is generally precipitated in equilibrium with environmental water. Some coral δ18O records in the Iso2k database have had their mean δ18O removed by the origi- nal authors for comparison and cross-dating with other coral records, and this is noted in the metadata.
3.1.2 Glacier ice
Climate records from glacier ice are found primarily at high latitudes (Antarctica, Arctic) and high elevations (e.g., An- des, Himalayas) (Eichler et al., 2009; Meese et al., 1994).
Glacier ice is formed from the accumulation of snow, which over time compacts into a section of chronologically con- tinuous layered ice. Cores drilled through layers of glacier ice preserve sub-annually to centennially resolved climate information, with resolution varying among records due to snow accumulation rates and laboratory sampling and anal- ysis methods (Rasmussen et al., 2014). Ice cores are dated through a variety of methods; annual layer counting and alignment to volcanic horizons are the most common ap- proaches for records spanning the CE (Sigl et al., 2014). This database contains records ofδ18O,δ2H, and/or d-excess of glacier ice. These proxies reflect the isotopic composition of precipitation (snowfall and ice), which is highly corre- lated to local temperature but additionally reflects changes in moisture source and condensation processes (Goursaud et al., 2019). Physical processes such as isotopic diffusion in the firn, melt and infiltration, and compaction of ice layers generally smooths the seasonal to interannual signal of cli- mate variability in glacier ice, and the potential influence of these processes is site specific.
3.1.3 Ground ice (wedge ice and syngenetic pore ice) Ground ice includes all types of ice found in permafrost;
wedge ice and syngenetic pore ice hold the largest potential for paleoclimate reconstructions (Opel et al., 2018; Porter et al., 2016; Porter and Opel, 2020). Ice wedges in permafrost landscapes form via repetitive thermal contraction cracking in winter and infilling of frost cracks mostly by snowmelt in spring (with potential minor contribution of snow and/or depth hoar). The integrated isotopic composition of the pre- vious winter’s snow pack is transferred into a single ice vein without additional isotopic fractionation due to rapid freez- ing in the permafrost. Thus, ice wedges preserve precipita- tion of the meteorological winter and spring, withδ18O and δ2H commonly interpreted as proxies for local air tempera- ture (Meyer et al., 2015). Ice-wedge records are temporally constrained by radiocarbon dating of macrofossils or dis- solved organic carbon in the ice. Conversely, pore ice in syn- genetic permafrost integrates precipitation that reaches the maximum thaw depth in late summer. The pore ice season- ality is a function of the local precipitation climatology and residence time of active-layer pore waters, and pore ice is enriched in heavy isotopes relative to the initial pore wa- ters due to equilibrium fractionation during freezing (O’Neil, 1968). Because syngenetic pore ice formed within accumu- lating surface sediments, its age can be modeled based on a radiometrically constrained sediment age–depth profile. Syn- genetic pore ice can be cored and subsampled in the same way as glacier ice (Porter et al., 2019).
3.1.4 Lake sediments
Lake sediments may provide long and continuous records of past environmental change (Dee et al., 2018; Mills et al., 2017) and preserve a number of sensors for oxygen and hydrogen isotopes (e.g., Leng and Marshall, 2004). Car- bonate minerals – precipitated inorganically from lake wa- ters or in the shells of aquatic invertebrates – have been used as sensors for the isotopic composition of lake wa- ter (e.g., Hodell et al., 2001; Morrill, 2004; Von Grafen- stein et al., 1998). Additional proxies analyzed with in- creasing frequency include biogenic silica, mostly from di- atoms; (e.g., Chapligin et al., 2016; Swann et al., 2018), cel- lulose (Heyng et al., 2014), chitinous invertebrate remains (Van Hardenbroek et al., 2018), and lipids (Konecky et al., 2019a; Sachse et al., 2012). Of these proxies, the oxygen isotope composition of carbonates and silicates is subject to temperature-dependent isotope fractionation during mineral- ization, whereas the isotopic composition of organic materi- als is generally not influenced by temperature (Rozanski et al., 2010). The compound-specific hydrogen isotopic com- position of a lipid reflects the environment in which the or- ganism producing the lipid grew. Lipids produced by aquatic macrophytes or algae reflect the isotopic composition of the lake water, whereas lipids produced by terrestrial plants re- flect the isotopic composition of soil or leaf water (which is, in many cases, highly influenced by the isotopic composition of precipitation). Both types of lipids are preserved in lake sediments (Castañeda and Schouten, 2011; Rach et al., 2017;
Thomas et al., 2016).
For sensors that record theδ18O orδ2H of lake water, the climatic or hydrological change recorded inδ18O orδ2H de- pends primarily on the degree to which evaporation influ- ences the lake’s hydrological balance relative to other fac- tors (Gibson et al., 2016; Morrill, 2004). In turn, the effect of evaporation on lake water isotopes largely depends on the residence time of water within the lake system, and the de- gree of hydrological “closure” of the lake. In open lake sys- tems – which often have surface water inflows and outflows, with a resulting short water residence time – lake waters of- ten reflect the isotopic values of the inflowing waters, which itself generally approximates a (sometimes) lagged signal of the weighted mean of the isotopic composition of local pre- cipitation (Jones et al., 2016; Tyler et al., 2007). In hydrologi- cally closed lakes – often without surface outflows and where more water leaves the system through evaporation – the ini- tial isotopic composition of inflowing waters is altered due to this evaporation, with theδ18O or δ2H of water increas- ing with increasing evaporation (Dean et al., 2015; Leng and Marshall, 2004).
3.1.5 Wood
The wood in tree rings (tree-ring cellulose) is one of the few terrestrial proxy archives that can be directly constrained to
calendar years (McCarroll and Loader, 2004; Schweingru- ber, 2012). Information about climatic and environmental changes on seasonal-to-annual timescales is recorded in tree- ring celluloseδ18O. Theδ18O of tree-ring cellulose is influ- enced by (i) theδ18O of source waters, (ii) factors influencing δ18O of the leaf water, and (iii) a fractionation factor related to the isotopic exchange of carbonyl oxygen of cellulose in- termediates with cellular waters. This fractionation is derived from enriched leaf water and unaltered xylem or source wa- ters and results in an overall∼27 ‰ enrichment of cellu- loseδ18O relative to cellular waters (Barbour et al., 2004;
Gessler et al., 2014; Roden et al., 2000). This fractionation is regarded as a constant in mechanistic models (e.g., Cernusak et al., 2005; Roden et al., 2000), such that celluloseδ18O variability mainly reflects theδ18O of source water and leaf waters. Theδ18O of the source water is closely related to the δ18O of precipitation-derived soil water (Bowen et al., 2019).
As such, the primary climatic signal that controlsδ18O of tree-ring cellulose varies by location, depending on the cli- matic signals controlling precipitationδ18O (Sect. 1.2). For example, tree celluloseδ18O records have been interpreted to reflect temperature at midlatitude to high-latitude sites (e.g., Churakova (Sidorova) et al., 2019; Porter et al., 2014; Saurer et al., 2002; Sidorova et al., 2012) and precipitation amount in tropical or monsoonal sites (Brienen et al., 2013; Mana- gave et al., 2011). As theδ18O of the soil water is also af- fected by evaporation of the soil water, precipitation minus evaporation (P−E) influencesδ18O tree cellulose (Sano et al., 2012; Xu et al., 2018). The extent of evaporative enrich- ment of the source water in18O in the leaf (and henceδ18O of the leaf water and tree cellulose) is controlled by the wa- ter vapor pressure deficit between the leaf intercellular space and the ambient atmosphere, as well as leaf physiological traits (Kahmen et al., 2011; Szejner et al., 2016).
3.1.6 Speleothems
Speleothems are secondary cave deposits that form when wa- ter percolates through carbonate bedrock. Both atmospheric CO2 and CO2 generated by plant root respiration and or- ganic matter decomposition are dissolved into rainwater as it percolates through the soil, producing carbonic acid that rapidly dissociates to produce weakly acidic water. As this acidic water percolates through the bedrock, it dissolves car- bonate until the water becomes supersaturated with respect to calcium and bicarbonate (Fairchild and Baker, 2012). When the percolating waters emerge in a cave, CO2degassing from the drip water to the cave atmosphere induces CaCO3 pre- cipitation, resulting in the formation of stalagmites and sta- lactites (Atkinson et al., 1978) that preserve theδ18O sig- nal of the waters that have percolated through from the sur- face (Lachniet, 2009). Theδ18O of the deposited carbonate therefore reflects the δ18O of soil and groundwater that it infiltrates, which is strongly influenced by theδ18O of pre- cipitation but with additional influences of aquifer mixing
times, seasonality of infiltration, and in some cases extreme events (Moerman et al., 2014; Taylor et al., 2013). Processes within the karst and cave, such as calcite precipitation prior to speleothem deposition and/or kinetic isotope effects, can alter theδ18O of the deposited carbonate.
Although there are hydroclimatic limits on speleothem growth, speleothem distribution is largely constrained by the presence of carbonate bedrock (Fairchild and Baker, 2012).
Speleothems form in a wide range of hydroclimate condi- tions, from extremely cold climates in Siberia to arid regions in the Middle East and Australia. The temporal resolution of speleothem paleoclimate series ranges from sub-annual to centennial, and primarily depends on the karst and cave envi- ronment. Due to the high precision of uranium series dating, speleothems provide opportunities to determine the timing of regional hydrological response to global events and links to external forcing mechanisms (e.g., insolation changes) (Fis- cher, 2016). The different types of measurements made on speleothems – includingδ18O,δ13C, and various trace ele- ments – and their fluid inclusions can be used to reconstruct past changes in the hydrological cycle.
3.1.7 Marine sediments
Marine sediments contain two types of sensors that have widely been used for measuring water isotope variabil- ity: planktonic foraminifera and biomarkers. Planktonic foraminifera are unicellular zooplankton living in the upper hundreds of meters of the ocean. They build a calcite skele- ton, which is preserved in the sediment. Theδ18O of plank- tonic foraminifera calcite reflects a spatially (and tempo- rally) variable combination of temperature andδ18Osw(Urey, 1948) and to a lesser degree the seawater carbonate ion con- centration as well (Spero et al., 1997), although changes in the latter parameter are likely negligible during the CE.
The temperature effect on the δ18O of foraminifera calcite is systematic, i.e., the δ18Osw can be reconstructed using (species-specific) paleotemperature equations in conjunction with an independent estimate of calcification temperature based on Mg/Ca (Elderfield and Ganssen, 2000). Plank- tonic foraminifera have a short life cycle (about a month) and species-specific seasonal and depth habitat preferences (Jonkers and Kuˇcera, 2015; Meilland et al., 2019), such that any planktonic foraminifera record bears an imprint of the ecology of the sensor (Jonkers and Kuˇcera, 2017).
Biomarkers in marine sediments are lipids synthesized ei- ther by marine photoautotrophs, which track past changes in surface seawater isotopic values, or from vascular plants, which track soil water isotopic values on an adjacent land mass (Sachse et al., 2012). Biomarkers are strongly affected by isotopic fractionation during lipid biosynthesis, and that fractionation is often assumed to be constant (Sachse et al., 2012). However, as for planktonic foraminifera, biomarker δ2H values are also affected by a combination of environ- mental parameters. Theδ2H values of C37 alkenones (syn-
thesized by coccolithophorids) are impacted by fractionation that changes with salinity and growth rates (Schouten et al., 2006), which can mask changes in theδ2H of seawater. The sources of leaf waxes are terrestrial plants, and the processes affecting leaf waxes in marine sediments are the same as in lake sediments but generally have longer associated time lags between the sensor recording theδ2H of soil water and ulti- mate deposition in the marine sediment archive.
4 Description of Iso2k metadata fields
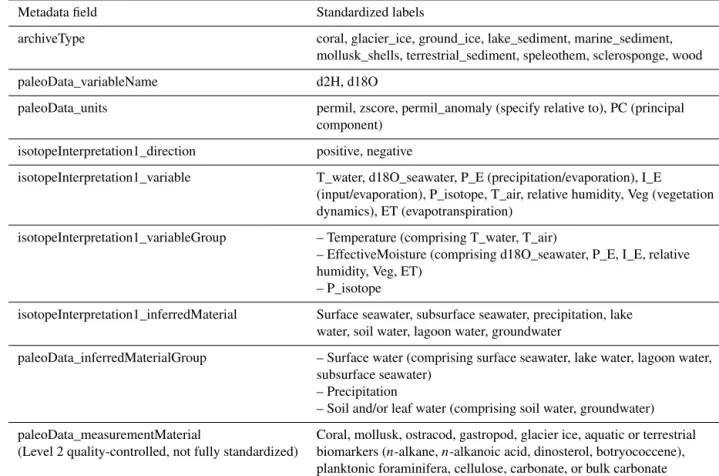
The Iso2k database contains over 180 metadata fields. The 55 main fields are described in Tables 1–6; 23 of these were strictly quality-controlled following the Level 1 definition in Sect. 2.4. Entries for some required metadata fields were standardized with controlled vocabulary to allow users to easily query the database for records based on archive type, isotope ratio (O or H), waters from which the isotope ratios are derived, materials on which the isotope ratios were mea- sured, or the environmental parameter that controls isotopic variability (Fig. 1). Metadata fields describe the primary iso- topic variable being inferred, i.e., the “isotope interpretation”
(e.g., theδ2H of precipitation); the water from which it was inferred, i.e., “inferred material” (e.g., soil water); the ma- terial that was actually measured, i.e., “measured material”
(e.g., long-chainn-alkane components of leaf waxes); and information about the original climate interpretation. Dis- tinctions between the archive type (Fig. 2), inferred mate- rial (Fig. 3), and the isotope interpretation (Fig. 4) allow for advanced analyses and straightforward data–model com- parisons using the database. These metadata interpretation fields were derived from interpretations reported in the orig- inal publications. Below and in Tables 1–6, we describe key metadata fields in the database, including all Level 1 and Level 2 fields (see Sect. 2.4 for a description of levels). Ta- ble 7 provides standardized vocabularies and common ter- minologies. Table 8 provides selected chronological control metadata. Table S1 gives key metadata for each primary time series (Sect. 2.4), including all Level 1 fields and selected ad- ditional Level 2 fields, and references to original publications (citations also listed in Tables S2 and S3).
4.1 Entity metadata
The entity metadata fields provide basic information for each record, including the isotope measured, the archive type, location (longitude, latitude, and elevation), start and end dates of each record, and both the DOI and citation for the original publication. Entries for the archiveType,pale- oData_variableName, and paleoData_unitsmetadata fields are standardized (Table 7) across all archive types to facilitate easy querying and analyses. Each record is assigned a unique LiPD identifier, and all isotope records are assigned a unique Iso2k identifier. The alphanumeric Iso2k identifiers contain 11 characters and digits as follows: archive type (2 char-
Figure 3.Map of records in the Iso2k database with colors representing the “inferred material” metadata field (Sect. 4.2) for each record (primary time series only; see Sect. 2.4). Symbols correspond to the inferred material super-groups.
Figure 4.(a)Map of records in the Iso2k database with colors representing the first-order “isotope interpretation” metadata field for each record (primary time series only; see Sect. 2.4). Symbols correspond to the three isotope interpretation “super-groupings” (see Sects. 4.3 and 5.1).(b)Bar chart showing the latitudinal distribution of records in the Iso2k database. Each bar represents 10◦of latitude.
acters), year published (2 digits), first author’s last name (2 characters), site name (2 characters), sample number (e.g., 00, 01, 02, 03 . . . ) for different cores or core composites from the same site, and letter (A, B, C . . . ) for multiple time series derived from the same core. The paleoData_variableName indicates the variable measured for each archiveType, usu- ally δ18O orδ2H. In some cases other paired geochemical measurements are included in the database to complement interpretation of the isotopic data (Sect. 2.3.4). A list and de- tailed description of key entity metadata fields is provided in Table 1.
4.2 Paleodata metadata
The paleodata metadata fields provide information for each proxy record; a detailed description of key paleodata meta- data fields is provided in Table 2. Measured and derived water isotope time series are identified using the paleo- Data_variableType and paleoData_description fields and should not be confused with the isotope interpretation meta- data fields (Sect. 4.3), which more broadly refer to the way each proxy record is interpreted (e.g., speleothem carbon- ate interpreted as a proxy for theδ18O of precipitation). The variable description (paleoData_description) is the general category of material that was measured for its isotopic ra- tio (e.g., carbonate or terrestrial biomarker). Further details
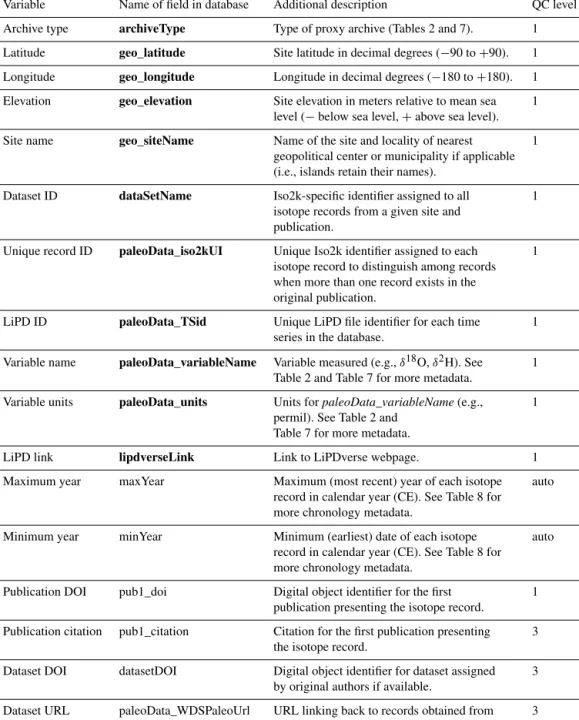
Table 1. Key entity metadata. Bold text indicates Level 1 or required fields in the database; italics are references to other metadata or variables.
Variable Name of field in database Additional description QC level
Archive type archiveType Type of proxy archive (Tables 2 and 7). 1
Latitude geo_latitude Site latitude in decimal degrees (−90 to+90). 1 Longitude geo_longitude Longitude in decimal degrees (−180 to+180). 1 Elevation geo_elevation Site elevation in meters relative to mean sea 1
level (−below sea level,+above sea level).
Site name geo_siteName Name of the site and locality of nearest 1
geopolitical center or municipality if applicable (i.e., islands retain their names).
Dataset ID dataSetName Iso2k-specific identifier assigned to all 1
isotope records from a given site and publication.
Unique record ID paleoData_iso2kUI Unique Iso2k identifier assigned to each 1 isotope record to distinguish among records when more than one record exists in the original publication.
LiPD ID paleoData_TSid Unique LiPD file identifier for each time 1
series in the database.
Variable name paleoData_variableName Variable measured (e.g.,δ18O,δ2H). See 1 Table 2 and Table 7 for more metadata.
Variable units paleoData_units Units forpaleoData_variableName(e.g., 1 permil). See Table 2 and
Table 7 for more metadata.
LiPD link lipdverseLink Link to LiPDverse webpage. 1
Maximum year maxYear Maximum (most recent) year of each isotope auto
record in calendar year (CE). See Table 8 for more chronology metadata.
Minimum year minYear Minimum (earliest) date of each isotope auto
record in calendar year (CE). See Table 8 for more chronology metadata.
Publication DOI pub1_doi Digital object identifier for the first 1
publication presenting the isotope record.
Publication citation pub1_citation Citation for the first publication presenting 3 the isotope record.
Dataset DOI datasetDOI Digital object identifier for dataset assigned 3 by original authors if available.
Dataset URL paleoData_WDSPaleoUrl URL linking back to records obtained from 3 the NOAA NCEI data repository
are given bymeasurementMaterial, which is a more specific description of what was measured (e.g., coral, glacier ice, lake sediment), andmeasurementMaterialDetail, which pro- vides further specificity of themeasurementMaterial, such as mineral, species, or compound. In contrast, theinferredMa- terialfield indicates the environmental source waters whose isotope variability is inferred (e.g., precipitation, lake water, groundwater) (Fig. 1). The environmental source waters in theinferredMaterialfield are not meant to be highly specific
(e.g., intracellular leaf water) but are instead broad pools of environmental waters that have direct analogs or counterparts in climate models.
4.3 Isotope interpretation metadata
The isotope interpretation metadata fields compile critical in- formation about environmental variables that influence iso- topic variability within each record (Table 3). These fields in- dicate the environmental variable thought to exert dominant
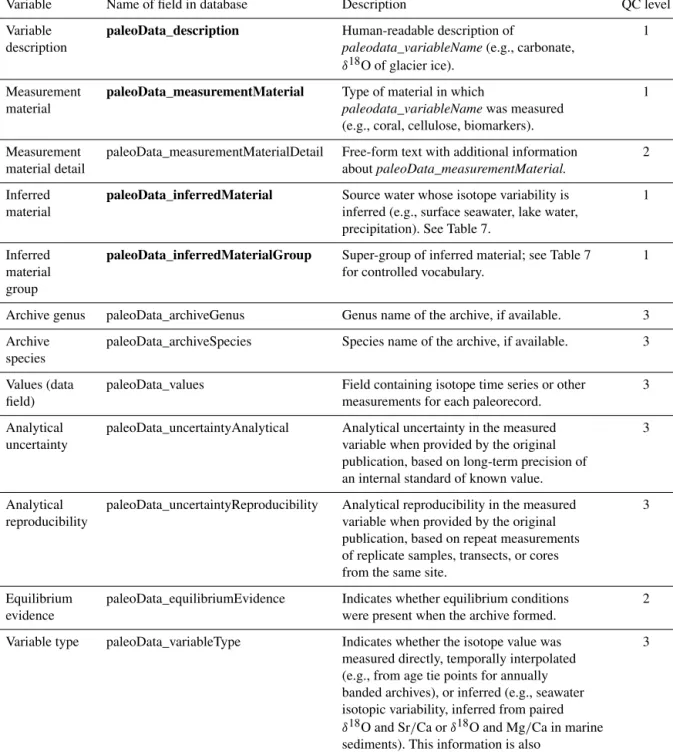
Table 2.Key paleodata metadata. Bold text indicates Level 1 or required fields in the database. italics are references to other metadata or variable; italics are references to other metadata or variables.
Variable Name of field in database Description QC level
Variable paleoData_description Human-readable description of 1
description paleodata_variableName(e.g., carbonate,
δ18O of glacier ice).
Measurement paleoData_measurementMaterial Type of material in which 1
material paleodata_variableNamewas measured
(e.g., coral, cellulose, biomarkers).
Measurement paleoData_measurementMaterialDetail Free-form text with additional information 2
material detail aboutpaleoData_measurementMaterial.
Inferred paleoData_inferredMaterial Source water whose isotope variability is 1
material inferred (e.g., surface seawater, lake water,
precipitation). See Table 7.
Inferred paleoData_inferredMaterialGroup Super-group of inferred material; see Table 7 1
material for controlled vocabulary.
group
Archive genus paleoData_archiveGenus Genus name of the archive, if available. 3 Archive paleoData_archiveSpecies Species name of the archive, if available. 3 species
Values (data paleoData_values Field containing isotope time series or other 3
field) measurements for each paleorecord.
Analytical paleoData_uncertaintyAnalytical Analytical uncertainty in the measured 3
uncertainty variable when provided by the original
publication, based on long-term precision of an internal standard of known value.
Analytical paleoData_uncertaintyReproducibility Analytical reproducibility in the measured 3
reproducibility variable when provided by the original
publication, based on repeat measurements of replicate samples, transects, or cores from the same site.
Equilibrium paleoData_equilibriumEvidence Indicates whether equilibrium conditions 2
evidence were present when the archive formed.
Variable type paleoData_variableType Indicates whether the isotope value was 3 measured directly, temporally interpolated
(e.g., from age tie points for annually banded archives), or inferred (e.g., seawater isotopic variability, inferred from paired δ18O and Sr/Ca orδ18O and Mg/Ca in marine sediments). This information is also
incorporated into paleoData_description.
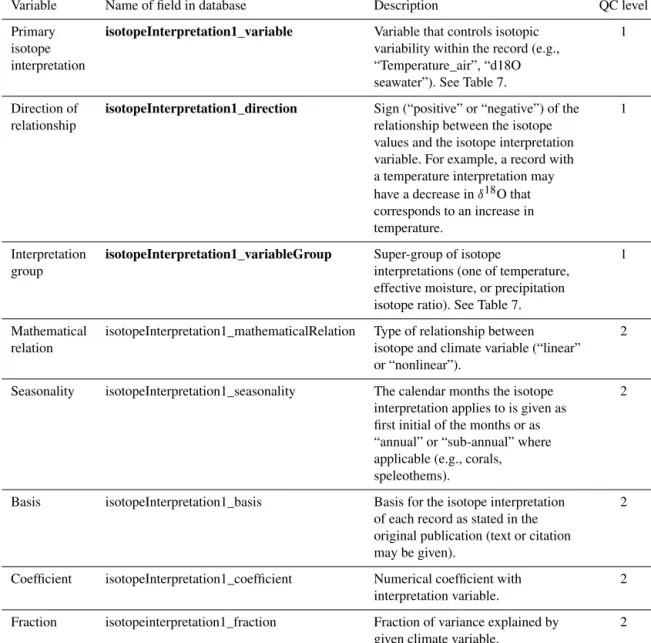
control on isotopic variability of the inferred environmental source waters (inferredMaterial) of each record, the mathe- matical relationship between the isotope interpretation vari- able and the isotope record, and the season(s) during which this interpretation applies. All isotope interpretation fields in the database are prefaced byisotopeInterpretation. Theiso- topeInterpretation1_variablefield lists the primary driver of
isotopic variability in the environmental source waters ac- cording to the original publications, for example air temper- ature or relative humidity (Table 7). For records where mul- tiple variables can explain some fraction of the variability, theisotopeInterpretation2 andisotopeInterpretation3 fields are also populated. TheisotopeInterpretation1_directionis a field that gives the sign (positive or negative) of the relation-
ship between the isotope measurements and the environmen- tal variable.
TheisotopeInterpretation1_variableGroupfield is a sim- plified super-grouping of terms in the isotopeInterpreta- tion1_variablefield in order to facilitate comparisons across different archives and realms, with three options (tempera- ture; isotopic composition of precipitation, i.e., “P_isotope”;
or effective moisture). Controlled vocabulary for metadata fields isotopeInterpretation1_variable and isotopeInterpre- tation1_variableGroup are standardized across all archive types (Table 7).
The isotope interpretation metadata fields reflect the iso- tope systematics of the environmental source waters and as such are distinct from the climatic inferences that one can make from a proxy record (Sect. 4.4). In some publications, this distinction is explicitly spelled out. For example, the cave drip water that becomes incorporated into the δ18O of speleothem carbonate in Borneo reflects the δ18O of wa- ter mixed throughout an aquifer system over many months, which ultimately reflects a smoothed version of precipita- tionδ18O (Moerman et al., 2014). In that case, theinferred- Materialis soil and groundwater and theisotopeInterpreta- tion1_variable is δ18Oprecipitation (“P_isotope”). Separately, δ18Oprecipitation at that same study site reflects multiple hy- droclimatic processes, such as moisture transport and precip- itation amount, that lend it a regional imprint of the El Niño–
Southern Oscillation (ENSO) (Moerman et al., 2013), and so the climate interpretation of speleothem δ18O is related to ENSO, which would be described separately in the climate interpretation fields (Sect. 4.4). In many publications, the iso- tope systematics of the environmental source waters and the climate interpretation are stated implicitly rather than explic- itly (e.g., by stating that the δ18O of speleothem carbonate reflects monsoon intensity or by stating that it reflects lo- cal precipitation amount via the amount effect; Dansgaard, 1964). In these cases, the isotopeInterpretation1_variable is still “P_isotope” and information about the climatic in- terpretation is included in the climate interpretation fields.
These distinctions are critical for facilitating comparisons with isotope-enabled climate models, where complex and nonstationary climate–isotope relationships can be examined directly.
For isotopeInterpretation1_seasonality, some proxy sen- sors and/or archives are interpreted to record a seasonally bi- ased signal, whereas others may record climate at an annual or sub-annual resolution (e.g., corals, some speleothems, sclerosponges, mollusks, wood). If the record is interpreted to be biased towards a specific season, the calendar months corresponding to that season – generally given as the first letter of each month, unless clarification is necessary – are recorded in the metadata field (e.g., MAM, DJFM, Jan). If the record represents an approximately mean annual sig- nal, “annual” is recorded in the seasonality field. For coral records, if the record has sub-annual resolution (e.g., sampled at monthly or bimonthly intervals), but the overall record is
not biased to any particular season, “sub-annual” is recorded in the metadata field.
4.4 Climate interpretation metadata
In contrast to the isotope interpretation (Table 3), climate interpretation metadata (Table 4) represent the original au- thors’ expert judgment about the primary climatic controls on the isotope ratios at their study site. Climate interpre- tation metadata specify either climatic variables (e.g., tem- perature, precipitation amount) or processes (e.g., the Pa- cific Decadal Oscillation, Asian monsoon intensity) that the authors interpreted to influence the isotopic composition of the proxy record, and as such they are neither standardized nor quality-controlled. These metadata are included as useful background information but should not serve as a primary fil- ter for users of the Iso2k database. A user might filter records based on the isotope interpretation field, then check the cli- mate interpretation field for a qualitative understanding of which climatic processes may be important for the filtered set of records. For records where theisotopeInterpretation2 andisotopeInterpretation3metadata are populated (Table 3), the correspondingclimateInterpretation2 andclimateInter- pretation3metadata may also be provided.
4.5 Queryable and standardized metadata
To make the database more user-friendly and queryable, some metadata fields contain logical flags (e.g., 0 or 1, true or false), cross-links (e.g., to a corresponding record ID in an- other PAGES 2k database), or geographic labels (e.g., con- tinent or ocean basin) that allow for easy sorting (Table 6).
For example, if a record was included in the PAGES 2k tem- perature database and reconstructions (Abram et al., 2016;
Kaufman, 2014; PAGES 2k Consortium, 2017; Stenni et al., 2017; Tierney et al., 2015), that record is cross-linked to its associated PAGES 2k ID wherever possible, permit- ting easy database query and analysis of records in only one database and those common to both databases. Approx- imately 15 % of the records in the Iso2k database were also incorporated into other PAGES 2k compilations, with the most overlap occurring in coral records and high-latitude ice cores. For these records, the extensive metadata can be used to facilitate deeper analyses of the hydroclimatic sig- nals contained in these mainly temperature-dominated iso- topic records. For example, with coralδ18O records, many of which are included in both the PAGES 2k temperature and Iso2k databases, the isotope interpretation fields denote the relative influence ofδ18Oswvs. temperature on the isotopic variability of the coral carbonate skeleton.
4.6 Chronological control data
Chronological or depth–age metadata provide essential infor- mation for isotope records across all archive types, including