I
György Kocziszky – Mariann Veresné Somosi
Assessment of the Sustainability of Community-owned
(non-financial)
Business Associations
Summary: The community-owned non-financial business associations are playing an important role in the economy of Hungary and in shaping the social and political mood of our country. The main reason for this is that companies (e.g. health, transport, energy supply, district heating, water utilities, etc.) are in state or local governmental property, which have strategic importance, and can fundamentally influence the public mood by the quality, reliability and pricing of their services. Therefore, the efficiency of their operation, their financial position, their employability, their productivity, and the short and long term sustainability of their capital ratio have an impact on the social well-being. This social sensibility imposes an increased responsibility on the one hand on the maintainers of community-owned companies, and on the other hand on the management of organizations.
Therefore, it does matter how and under what conditions these organizations can be maintained. In their study, the authors (after justifying the choice of topic) seek the answer for the following questions: How can be defined the sustainable community company? What are the indicators and how can be measured the sustainability of community companies? What conclusions can be drawn from the indicators, sub-indices and of the index change?
KeywordS: corporate life cycle, community-owned company, composite index, early warning system.
JeL codeS: L32, Q01
doI: https://doi.org/10.35551/PFQ_2020_s_1_3
Is state-ownership justified? Can the state be a good owner? Is a private market operator more competitive and sustainable than a state- owned enterprise?
These are all questions that were raised directly and indirectly by neoclassical economists in the second half of the 19th century.
Over the past decades, economic policy has attempted the practical implementation of both models (‘dirigism’ and ‘night-watchman state’), but neither has managed to fulfil the expectations. Neither the solely market-based approach, nor centralised state ownership (and the regulations serving them) have proved to be sustainable in the long run.
In looking for the causes (without being exhaustive), the literature primarily suggests that in a ‘stateless’, purely private market E-mail address: regkagye@uni-miskolc.hu
economy, on the one hand, there is a prejudice to national and community interests (e.g.
justice, spatial balance, etc.) (Hanka, 1982;
Stor, 2001); on the other hand, there is a risk of moral hazard (e.g. the state is forced to save strategically important companies from bankruptcy even if they were irresponsibly managed, because they are ‘too big to go bankrupt’, etc.) (Maggison, 2005). Exclusive state-ownership also entails many risks. For example, on the one hand, productivity, efficiency and cost sensitivity may be reduced due to the lack of sense of ownership or the monopoly position of the organisation;
and, on the other hand, due to the ‘suction- based’ economy, required developments and investments may not be realised, products and technologies may become obsolete (Maggison, Jeffry, 2003; 1987).1
It is no coincidence that today the literature addresses the issue of optimal (or near) dual ownership structure rather than whether or not such a structure is justified, with particular regard to its role in equalising the economy in periods of macroeconomic turbulence and its impact on social well-being.2
MacroeconoMIc IMPorTance oF coMMunITy-oWned coMPanIes
In Hungarian practice, community-owned companies are economic organisations controlled by the central government (State) and local governments, as well as their subsidiaries. Hungarian statistics have been examining these entities separately since 2010 (within the corporate sector) (Hungarian Central Bank, 2019).
Directly state and municipality-owned companies are identified annually on the basis of the breakdown of their share capital in the corporate tax return (information disclosed in the companies’ financial statements is
used to identify their subsidiaries). Financial accounts are prepared on the basis of corporate tax returns and annual financial statements.
Additional data provision helps to compile the data on stocks and the components of the annual changes in stocks in sufficient detail and with sufficient precision.3
In recent years (2010–2017), there has been no material change in the number of community-owned companies, which fluctuated between 2,200 and 2,300 (the number of organisations entering and leaving the group of community-owned companies was approximately identical). A larger decrease in the number of community-owned companies occurred in 2017, mainly due to the winding up of a higher number of municipality-owned enterprises and the decline in the number of start-ups. At the end of 2017, about a quarter of community-owned companies were owned by the state, which showed a modest increase in the period under review (Hungarian Central Bank, 2019).
State and municipality-owned companies represent merely over 10 percent of all Hungarian companies; in contrast, the European Union average is close to 20 percent.
Consequently, the allegations referring to the State’s excessive re-privatisation efforts are groundless (Dietrich, 2012, p. 6; Schöneich, 2001, p. 7).
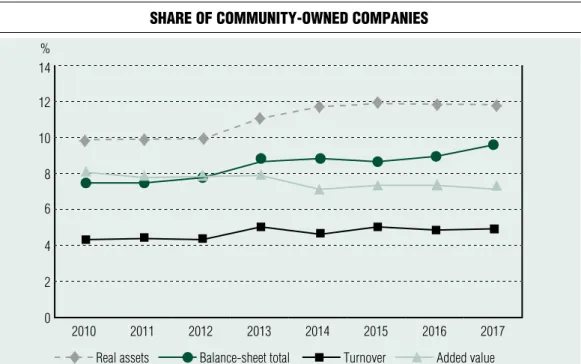
The proportion of value added, sales revenues, real assets and balance sheet totals are appropriate for the size of the examined group of enterprises (Figure 1).4
However, the value added of community- owned companies (with the exception of the energy sector) is much lower than that of their privately-owned counterparts (see Figure 2).
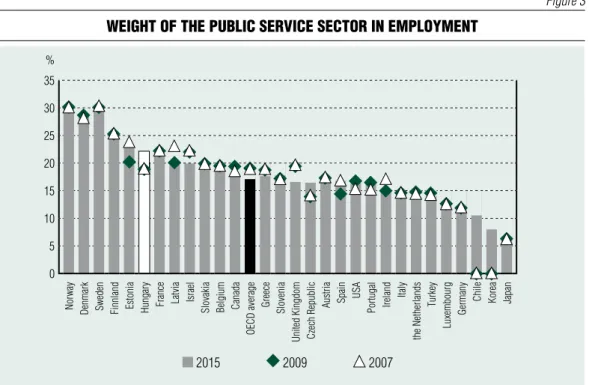
However, community-owned companies (in accordance with their profiles) are significant employers in all OECD countries, including Hungary (see Figure 3).
In summary, it is hardly disputable that the
Figure 1 Share of community-owned companieS
% 14 12 10 8 6 4 2
0 2010 2011 2012 2013 2014 2015 2016 2017
real assets Balance-sheet total Turnover added value
Source: Hungarian central Bank, financial accounts, edited by the authors based on the financial accounts of community-owned companies Figure 2 Breakdown of the value added By hungarian companieS
in each Sector By final owner
% 100 90 80 70 60
50 40 30 20 10
0 a Bc de F G H I J L Ms
Foreign ownership community ownership domestic private property
Legend: A: Agriculture; BC: Industry; DE: Energy; F: Construction; G: Trade; H: Transportation; I: Accommodation; J: Information; L: Real Estate; MS: Other.
Source: Hungarian central Bank, corporate database for statistical purposes, edited by the authors based on 2017 data
examined group of companies require special attention both from a macroeconomic and a microeconomic point of view and both with regard to employment rates and sales revenues.
deFInITIon and cHaracTerIsTIcs oF susTaInaBLe coMMunITy-oWned enTerPrIses
The concept of sustainability is far from novel (Carson, 1962; Meadows et al., 1972;
Brown, 1981). The authors of the first studies addressed sustainability separately, more than once adopting a mutually exclusive (growth vs.
sustainability) and a fundamentally ecological approach.5
Over the past decade, the two different approaches to the issue (benefit vs. ecology- based) have converged, as confirmed by reports from the United Nations (United
Nations, 2011; 2012; UNEP, 2011) and by the individual Member States. On the other hand, since the 1990s, the concept of sustainability has been extended to the meso level (e.g. Bajmócy et al., 2012; Dirk, 2003).
Compared to the research of macro (Rio, 1993; Kerekes, Jámbor, 2012; Slavik, 2013) and meso-level sustainability (Hungarian Technical Regulatory Commission for Construction / ÉMSZB/, 2018; DU, 2004;
Birkmann et al., 1999), corporate sustainability has a much shorter history. The fact that, since the 1950s, mainstream literature has focused primarily on corporate growth (Penrose, 1959), which is not the same as corporate sustainability (the latter being a more complex concept), has contributed to this situation.
A paradigm shift has taken place over the years: now it is believed that sustainable companies meet social, ecological and economic expectations at the same time;
Figure 3 weight of the puBlic Service Sector in employment
% 35 30 25 20 15 10 5 0
norway denmark sweden Finnland estonia Hungary France Latvia Israel slovakia Belgium canada oecd average Greece slovenia united Kingdom czech republic austria spain usa Portugal Ireland Italy the netherlands Turkey Luxembourg Germany chile Korea Japan
2015 2009 2007 Source: Government at a Glance 2017 – © oecd 2017
sustainability is defined as a balanced and stable interaction of these three factors.6 In other words, economic expectations that are in line with the owners’ expectations (e.g.
expansion of core business, technological change, etc.) may not have negative natural or environmental impacts (because natural capital can only be partly replaced by physical capital) or contradict social expectations (e.g.
quality of service etc.).7
An examination of the interdependence between ecological, economic and social expectations is also relevant because the traditional – partial – view makes it difficult to promote the ecological and social aspects.
Sustainability is not independent of the classic life cycle curve theory for companies (Adizes, 1990; Kocziszky, 1994), and, in an optimal case, an early warning system could draw attention to the fact that the critical (inflectional) point of the curve (where performance indicators tumble sharply) is approaching.
It is worth distinguishing between sustainability (a static state) and sustainable development (process). In our research, we attached importance to the latter (in terms of corporate life cycle curves).8 That is, the life cycle of a company fulfils the criterion of sustainable development if the value of the composite index of the indicators of sustainability (after the foundation, start-up and profitability phases vs. aging and crisis phases) does not decrease monotonically.
Preconditions for sustainable corporate development in the long term:
• value-oriented strategic thinking,
• increase of assets,9
• environmentally conscious behaviour,
• technological and organisational renewal,
• value-oriented competencies development.
The so-called fourth industrial revolution makes this issue particularly relevant to corporate sustainability research, which
poses new challenges for companies and management. It is not difficult to predict that digitalisation will seriously affect sustainability.
Only companies face meet this challenge successfully that are capable of meeting the requirements of smart factoring themselves (i.e. high productivity, collaboration as a network, digitalisation, flexibility; Aier, Dogen, 2005, p. 610).
InTerPreTaTIon
oF THe susTaInaBILITy Index
Against this backdrop, research and analysis of the sustainable operation and development of community-owned companies is a legitimate need of the owners and society. This is what our indicator model to be presented is designed to help with.
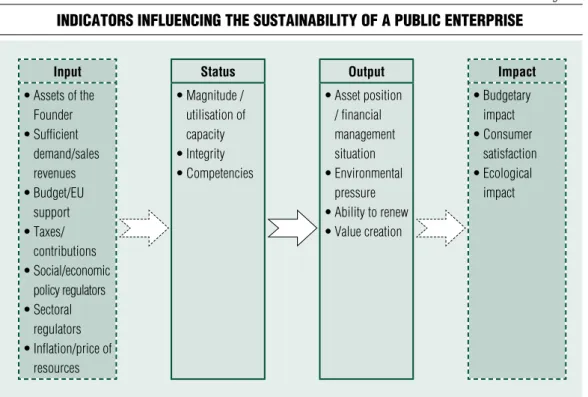
Input indicators provide information on the input conditions; status indicators on operational characteristics, while output indicators on the performance of the business (Figure 4).10
The setting of input indicators was influenced both by economic and social policy considerations and by the proprietor’s (owner’s) vision and strategy for the sector (Figure 5).
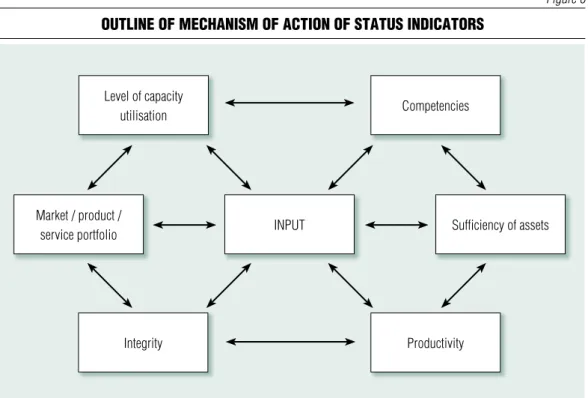
Besides the quantitative and qualitative characteristics of the inputs, status indicators are influenced by the corporate management (Figure 6).
Output indicators describe the company’s ability to renew, create value, its asset and financial position, and its impact on the environment (Figure 7).
When defining the indicator groups, their interpretability in terms of business economics, their easy and quick quantifiability (i.e. their definition entails minimal extra burden) and their comparability within the sector were considered.
Figure 4 indicatorS influencing the SuStainaBility of a puBlic enterpriSe
Input Status Output Impact
• Assets of the Founder
• Sufficient demand/sales revenues
• Budget/EU support
• Taxes/
contributions
• Social/economic policy regulators
• Sectoral regulators
• Inflation/price of resources
• Magnitude / utilisation of capacity
• Integrity
• Competencies
• Asset position / financial management situation
• Environmental pressure
• Ability to renew
• Value creation
• Budgetary impact
• Consumer satisfaction
• Ecological impact
Source: edited by the authors
Figure 5 an outline of the mechaniSm of action of input indicatorS
Source: edited by the authors
Budget deficit/public
debt Taxes/contributions
Macroeconomic growth
economic/
social policy Inflation/interest
sectoral policy Price of resources
Figure 6 outline of mechaniSm of action of StatuS indicatorS
Source: edited by the authors
Level of capacity
utilisation competencies
Market / product /
service portfolio InPuT sufficiency of assets
Integrity Productivity
Figure 7 outline of mechaniSm of action of output indicatorS
Source: edited by the authors
ability to renew Value creation capacity
sTaTus
asset position / financial
management situation environmental pressure
Regular (annual) quantification of the examined indicators and the examination of their relationships support the development of the corporate vision and strategy and the monitoring of the results by setting the desirable (target) value of each indicator (Figure 8).
In accordance with the corporate management’s margin for manoeuvre regarding corporate sustainability, three status indicators (integrity, competencies, capacity/
productivity) and four output indicators (ability to renew, value creation, increase of assets/financial management, environmental sustainability) were examined.11
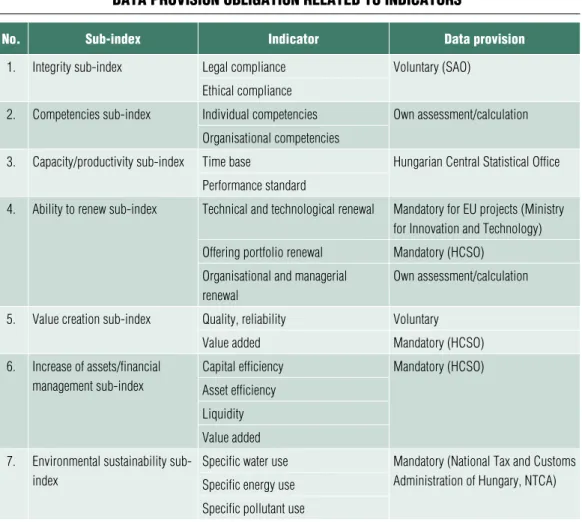
The development of a significant part (almost 75 percent) of the indicators does not represent an additional burden for those concerned, as data can be looked up in the reports to be submitted to the Central
Statistical Office, the National Tax and Customs Administration of Hungary and the Ministry of Innovation and Technology (Table 1).
The sustainability index (I) is a composite index composed of two sub-indices as follows:
I(t1–t2) = f [II(t1–t0),KI(t1–t0),TI(t1–t0),MK(t1– t0), ÉI(t1–t0),VI(t1–t0),KF(t1–t0)]
sTaTus IndIcaTors
Within this framework, three sub-indices describing three status (integrity, competencies, performance) were defined, which include six indices. The following is a summary of preliminary experiences gained in quantifying these indicators and the associated risks.
Figure 8 relationShip of indicatorS included in the model to the corporate viSion/Strategy
Source: edited by the authors
Integrity
Purpose Fact
environmental sustainability
Purpose Fact
Value creation
Purpose Fact
Increase of assets/financial management
Purpose Fact
competencies
Purpose Fact
capacity
Purpose Fact
ability to renew
Purpose Fact
Vision/
strategy
Integrity sub-index
The Integrity Index is a composite index, which measures the legal, transparent, and ethical operation of a company.
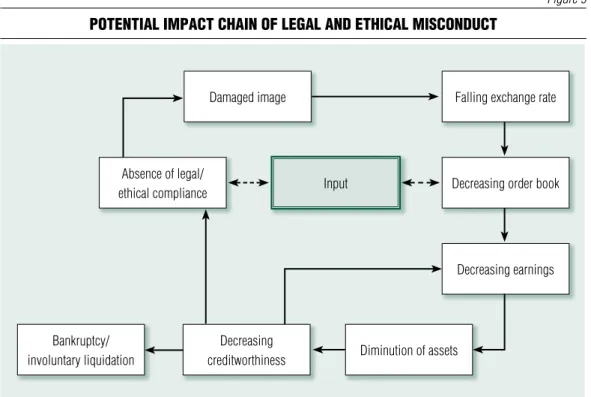
Creating value is an essential precondition for corporate sustainability, a necessary but not sufficient condition of which is the existence regular and ethical values that serve the common good. Amoral corporate behaviour that violates legal regulations and the interests of the community, ‘manoeuvring’
and corruption, will eventually have a negative
impact on a company’s earnings, assets and creditworthiness (see Figure 9).
Legal compliance
The requirement of legal and regulatory compliance is not unknown, due to the SAO’s audit and advisory activities and ‘good practice’ conferences related to its audits.12
We recommend defining the indicator using a questionnaire consisting of 15 questions (which is simpler than the practice of the SAO) (see Table 2). Question can be answered by giving binary (yes or no) answers,
Table 1 data proviSion oBligation related to indicatorS
no. Sub-index indicator data provision
1. Integrity sub-index Legal compliance Voluntary (SAO)
ethical compliance
2. competencies sub-index Individual competencies own assessment/calculation organisational competencies
3. capacity/productivity sub-index Time base Hungarian central statistical office Performance standard
4. ability to renew sub-index Technical and technological renewal Mandatory for eu projects (Ministry for Innovation and Technology) offering portfolio renewal Mandatory (Hcso)
organisational and managerial renewal
own assessment/calculation
5. Value creation sub-index Quality, reliability Voluntary
Value added Mandatory (Hcso)
6. Increase of assets/financial management sub-index
capital efficiency Mandatory (Hcso)
asset efficiency Liquidity Value added 7. environmental sustainability sub-
index
specific water use Mandatory (national Tax and customs administration of Hungary, nTca) specific energy use
specific pollutant use Source: edited by the authors
Figure 9 potential impact chain of legal and ethical miSconduct
Source: edited by the authors Bankruptcy/
involuntary liquidation
decreasing order book Input
damaged image
decreasing earnings Falling exchange rate
diminution of assets absence of legal/
ethical compliance
decreasing creditworthiness
Table 2 QueStionnaire for inveStigating the regularity
no. Question rating
Basis of rating
0 5
1. are they aware of the requirements of the eu market surveillance framework for the products produced / services rendered?
The legal regulations specified in the annex to the operational and organisational rules 2. do they fulfil the requirements of the eu market surveillance
framework for the products produced / services rendered?
Transposition of the eu regulation
3. does the company have a Privacy Policy? Privacy Policy
4. does the company fully compliant with the rules applicable to data processing (GdPr)?
communication Policy 5. are the operational and organisational rules regularly updated? operational and
organisational rules 6. Is the company’s risk Management Policy regularly updated? risk Management Policy 7. does the company have a Public Procurement Policy? Public Procurement
Policy
which can be evaluated on a two-point scale (0 and 5). The person responsible for completing the questionnaire should be nominated by the senior manager of the company. For this indicator, it is advisable to determine the expected score (‘ding value’).
When examining legal and regulatory compliance, it may be a risk that the entity concerned wants to paint a better picture of itself than the actual one, and/or the person who completed the questionnaire was not fully aware of the current legal requirements;
thus, their answers are inaccurate.
Ethical compliance
Assessments of ethical and integrity risks for the range of potential companies – thanks to audits by the Hungarian State Audit Office of Hungary – have been carried out several years. Thus, the concept of integrity and the importance of internal controls are not new
to the managers of the companies concerned (Domokos, 2015).
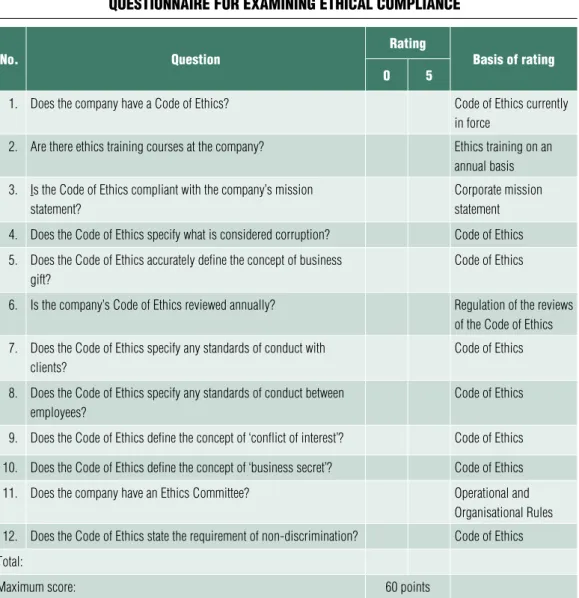
There is questionnaire consisting of twelve questions and related instructions designed to check ethical compliance. The questions are Yes/No questions (Table 3). The person responsible for completing the questionnaire (similarly to the foregoing) is the person designated by the company’s senior manager (e.g. the head of the Ethics Committee).
Risks associated with the definition and evaluation of the index:
• the survey is subjective; there is a risk that the reporting organisation may wish to paint a more positive picture of its functioning of its internal control system than the actual one;
• this risk probably cannot be eliminated completely, but it can be reduced through random checks, audits by the Hungarian State Audit Office of Hungary and, if
no. Question
rating
Basis of rating
0 5
8. does the company have an external communication Policy? communication Policy
9. does the company have a Policy for the disposal of unused assets?
disposal Policy
10. does the company have a data security Policy? data security Policy
11. Is the use of corporate assets fully regulated? asset use Policy
12. are the principles for delegating decisions regulated? operational and organisational rules 13. are the remuneration principles fully regulated? collective Bargaining
agreement 14. are policies accessible to those concerned on the Internet? Manual verification 15. does the company have a compliance officer / organisation? operational and
organisational rules Total:
Maximum score 75 points
Source: edited by the authors
necessary, holding certain individuals personally liable.
Competencies sub-index
Knowledge, knowledge capital and competencies – which are a prerequisite for the foregoing – are playing an increasingly important role in the operation and sustainability of companies.
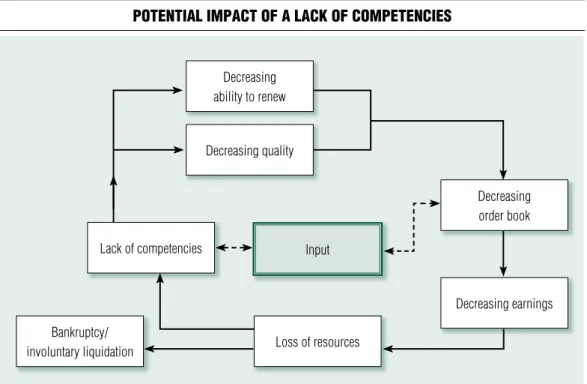
Competencies, which are defined as a set of skills, abilities and inborn personality characteristics and which the index is intended to quantify, can be measured both at the individual and organisational level.13 Renewal, the realisation of which is related to personal and organisational competencies, is a condition for corporate sustainability (Figure 10).
Table 3 QueStionnaire for examining ethical compliance
no. Question rating
Basis of rating
0 5
1. does the company have a code of ethics? code of ethics currently
in force
2. are there ethics training courses at the company? ethics training on an annual basis 3. Is the code of ethics compliant with the company’s mission
statement?
corporate mission statement 4. does the code of ethics specify what is considered corruption? code of ethics 5. does the code of ethics accurately define the concept of business
gift?
code of ethics
6. Is the company’s code of ethics reviewed annually? regulation of the reviews of the code of ethics 7. does the code of ethics specify any standards of conduct with
clients?
code of ethics
8. does the code of ethics specify any standards of conduct between employees?
code of ethics
9. does the code of ethics define the concept of ‘conflict of interest’? code of ethics 10. does the code of ethics define the concept of ‘business secret’? code of ethics
11. does the company have an ethics committee? operational and
organisational rules 12. does the code of ethics state the requirement of non-discrimination? code of ethics Total:
Maximum score: 60 points
Source: edited by the authors
It is in interest of companies to identify and close the competency gap resulting from technical and technological changes.14
Individual competencies
Individual competencies are a set of abilities and skills that express the knowledge and experience of a specific person, and make them suitable for a specific job.15 In other words, they include knowledge, experience and inborn personality characteristics.16
There is some domestic experience with individual competency assessment, but such assessments are mostly used in primary and secondary education to assess students’
knowledge.
In Hungary, as opposed to the practice of the developed countries, competency assessments of the employees of economic entities are ad-hoc; there are no uniform practices or methodology. However, there is an increasing
needed for measurements in connection with individual performance appraisals.
Three ratings (1, 3, 5) can be assigned based on the questionnaire developed to measure individual competencies, which contains 15 questions (Table 4).
A required minimum score can also be determined individually for each person (based on, for example, their age, educational qualifications, etc.).
Individual competency assessments are primarily serve the best interests of the people concerned (employee, line manager, human resource manager), and the related information should, therefore, be treated as confidential.
Its purpose is to identify strengths and deficiencies, and to develop individual and organised training plans/programs to eliminate the latter. Questionnaires must be completed by both the employees concerned and their respective line managers. Based
Figure 10 potential impact of a lack of competencieS
Source: edited by the authors Bankruptcy/
involuntary liquidation
Input
decreasing earnings Lack of competencies
Loss of resources
decreasing order book decreasing
ability to renew
decreasing quality
on the comparison of the two, a personal competency development plan can be drawn up (Veresné, 2005).
There are multiple risks associated with measuring individual competences, such as:
• the appraisal of individual competencies is subjective,
• for self-interest, the individual wants to show a more favourable picture of themselves and their competencies than the reality,
• no competency development proposal tailored to the employee is made after the
assessment of competencies, or even if it is made, the employer does not support its implementation,
• the employee lacks the ambition to develop their competences,
• for self-interest, the manager wants to show a less favourable picture of the employee than the reality.
Indicator of organisational competencies
The suitability of a given organisational unit of a company to perform a specific set of tasks:
a set of expected knowledge, skills, abilities, Table 4 an example of the meaSurement of individual competencieS
no. rating criterion rating
1 3 5
1. conflict management skills 2. continuous learning
3. ability to comply with the standards of conduct 4. Problem-solving skills
5. Proficiency (practical expertise)
6. ability to work independently and to make decisions 7. sense of responsibility, reliability
8. Work discipline 9. sense of initiative 10. Performance
11. client and partner focus 12. resilience
13. cost sensitivity 14. digital competencies 15. Methodological competencies Total score:
Maximum score*: 75 points
Comment: * answers are rated as follows: 1 – insufficient, 3 – medium, 5 – good.
Source: edited by the authors
standards of conduct in order to perform the tasks of the organisational units in good quality (OECD, 2013).
Hungarian experience in measuring competencies at the organisational level is relatively scarce (if any, it is treated as a business secret), despite the fact that several consultancy firms are offering this type of service.
In contrast, relevant international practice has become a rich and integral part of the human resource and performance management system.17
Due to the scarce domestic experience, the survey requires careful preparation and further caution. Organisational competencies (those of a group, department, etc.) must be measured based on criteria defined in accordance with the roles, powers and responsibilities of given unit, on the one hand, and of direct manager of the unit, on the other hand.
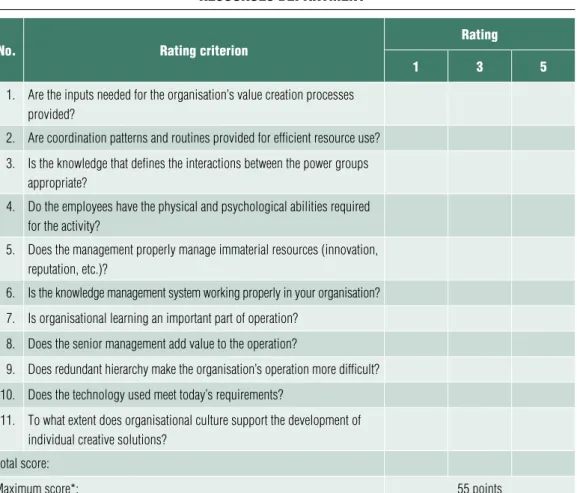
The applicability of our method was examined in relation to the Human Resources Department. The survey questionnaire consists of 11 questions (Table 5).
Table 5 an example of the reSult of organiSational competencieS in the human
reSourceS department
no. rating criterion rating
1 3 5
1. are the inputs needed for the organisation’s value creation processes provided?
2. are coordination patterns and routines provided for efficient resource use?
3. Is the knowledge that defines the interactions between the power groups appropriate?
4. do the employees have the physical and psychological abilities required for the activity?
5. does the management properly manage immaterial resources (innovation, reputation, etc.)?
6. Is the knowledge management system working properly in your organisation?
7. Is organisational learning an important part of operation?
8. does the senior management add value to the operation?
9. does redundant hierarchy make the organisation’s operation more difficult?
10. does the technology used meet today’s requirements?
11. To what extent does organisational culture support the development of individual creative solutions?
Total score:
Maximum score*: 55 points
Comment: * 1 – insufficient, 3 – medium, 5 – good Source: edited by the authors
An expected score can be recorded separately for each organisational unit, and the results of the organisational units can be compared on the basis of percentage results (Table 6).
Competency-based organisational structure, according to our experience, is a relatively new concept in Hungarian corporate practice.
Therefore, there is scarce practical experience in this area, which may also affect the risk involved in this type of surveys. The following should be considered:
• resistance of the organisation concerned or of the head of the organisation and
‘window-dressing’,
• no competency development plan is prepared in relation to the survey, or even if one is prepared, it is considered to be a mere formality by those concerned.
Capacity/productivity sub-index
A company’s ‘performance’ is the quantity of a product/service, expressed in a given unit of measurement, which can be produced with the given set of assets, during the given time (days, shifts), under the given technical and organisational conditions and considering the given product mix. Capacity is calculated using the most favourable data (optimal time without downtime and emergency situations).18
Throughput is the actual capacity in a period of time, which can be determined by taking into account the greater downtime.
The determination of capacity and bottlenecks is a basic business economics knowledge; therefore, people are (should be)
Table 6 an example of the compariSon of competencieS
within organiSational unitS
no. name of organisational unit level of competencies (%)
10 20 30 40 50 60 70 80 90 100
1. Human resources
*
2. Finance
*
3. accounting
*
4. Technology
*
5. Quality assurance
*
6. Production
*
7. Transport/Logistics
*
8. controlling
*
9. Legal
*
10. environmental Protection
*
Source: edited by the authors
Table 7 componentS of capacity utiliSation
no. description Quantification Source of data
1. actual throughput (actual time base less emergency situation/standard plus losses)
Technical/technological data
2. Productivity net sales revenues/head count Profit and loss account/financial statements
Source: edited by the authors
expected to have the knowledge and data required for its determination. In addition, the company is obliged to provide the Hungarian Central Statistical Office with capacity data on a regular basis.
The level of utilisation of the company’s production equipment can be determined as the ratio of planned and actual throughput (Table 7).
Planned throughput = [(time base according to the work schedule (hours/year) × number of working days × number of actual shifts × number of homogeneous machines) – required hours of planned preventive capacity].
When calculating capacity utilisation, the following risks should be considered:
• the throughput standard is approximate as the calculation is made using a selected so- called ‘lead product’,
• when defining the time base, they take into account more downtime than actual one in order to distort production information.
An aggregate index based on the weighted arithmetic mean of the three factors, as follows:
Aggregate status Index = 0.3 × [(legal comp- liance + ethical compliance + organisational competencies)] / 3 + (0.7 × capacity utilisation).
Giving a greater weight to capacity utilisation is justified by its greater impact on output.
ouTPuT IndIcaTors
Four indicators (ability to renew, value creation, increase of assets/financial management, environmental pressure) have been included in the analysis of the output side of community- owned (non-financial) companies.
Ability to renew sub-index
Renewal is a key element of corporate sustainability. It is no coincidence that the literature discusses the companies’ ability to renew themselves as a priority (OECD, 2013a;
OECD, 2013b). The ability to renew depends on several factors (technology, competencies, product/service portfolio, value added, quality, financial management, demand).
The lack of ability to renew leads to market loss, decreasing ability to create value, rescheduling or lack of investments, increasing environmental pressure, diminution of assets, loss of creditworthiness, which may result in the instigation of bankruptcy and involuntary liquidation proceedings (Figure 11).19
Indicators of technical and technological renewal
Technical and technological renewal means any conscious change aimed at modernising existing devices, equipment, systems, techniques,
procedures, improving productivity, increasing efficiency or reducing risk factors.
The concept is easy to interpret, and even nowadays technical and technological renewal is a common topic in Hungarian literature (not least thanks to EU and TÁMOP grant programs etc.), it is rarely quantified (mostly as indicators used in grant applications).20
Maintaining the ability of regular technical and technological renewal is expenditure- (investment-) intensive; therefore, its costs have to be taken into account when measuring it (Table 8).
The aggregate indicator is the arithmetic mean of the two sub-indicators. The following may distort the value of this indicator:
• method used to account for amortisation/
depreciation,21
• determination and capitalisation of self- developed assets.
Indicator of the renewal of the product and/or service portfolio
Product and service renewal is any conscious change (modification) that is in line with the company’s strategy and ensures better (more efficient) reach or service of consumers (users) and/or an expansion of the service offering.
Companies are required by the Central Statistical Office to report on product statistics annually, using Form No. 1039. When compiling those statistics, they need to provide the name and code number (according to the annual product inventory) of the products/
services concerned, the quantities sold and the resulting net sales revenues.
This statement (taking into account similar data from the previous year) shows the magnitude of the new products/services (in certain sectors, additional data may be Figure 11 potential impact of the decreaSing aBility to renew
Source: edited by the authors
Bankruptcy/involuntary diminution of assets
decreasing ability to renew
decreasing creditworthiness
Increasing environmental pressure
Lack of investments Loss of market/decreasing
ability to create value
status indicators
available on changes in the scope of services offered).
In the case of the examined service (heat supply), changes in the service portfolio can be measured by two additional indicators (Table 9).
The product/service portfolio renewal indicator can be determined from the arithmetic mean of the two sub-indicators.22 Indicator of organisational and managerial renewal
Organisational and managerial renewal means any conscious change (modification) that impro- ves cost sensitivity, transparency, performance and integrity of operations in accordance with the company’s vision and strategy.
According to the above definition, organisational renewal may include changing the information and decision-making system,
the strategy development process, or the roles, powers and responsibilities of organisational units, or increasing the number of hierarchical levels or improving their efficiency.23
The aim of renewal of the organisation and of the management system is to enhance the efficiency and effectiveness of operations and to improve the workplace climate, which should also be reflected in the company’s results. The indicators can be determined from data recorded in the general ledger (Table 10).
Renewal of the corporate governance system (in line with international literature) may consist in, for example, the implementation and operation of an integrated, computer- aided Enterprise Resource Planning (ERP) system. (The indicators can easily be determined from general ledger data in a relatively risk-free manner.)
Table 8 meaSuring technical and technological renewal
no. description Quantification Source of data
1. ability to renew technologically (cost of purchased + self-developed technology) / annual net sales revenues
Profit indicators
2. ability to renew assets annual investment expenditure / net capital stock
Profit and loss account
Source: edited by the authors
Table 9 indicatorS of Service portfolio renewal for a heat Supply company
no. description Quantification given source
1. change in network density [length of new network (km, year) / length of old network]
Investment data
2. change in sales revenues [revenues from new entrants (HuF/
household, year) / revenues from old consumers]
corporate revenues / statement of costs
Source: edited by the authors
Value creation sub-index
The value added by the company expresses the usefulness and quality of a given product/
service, which leads to greater profit, better results and success.24
Value added by the company or enterprise value are not synonymous terms.
Our model deliberately includes the value added by the company rather than the enterprise value (the latter depends on the market value of return on assets, MROA), on stock prices for a company listed on the stock exchange, etc.25
Indicator of quality/reliability assurance Quality is defined as the extent to and the manner in which (reliability, compliance with the standards, utility for the intended purpose) a product/service, which satisfies real
needs, satisfies the needs of the given group of consumers/users (ISO 8402).
There is a wealth of literature on quality economics and on the impact of quality on corporate productivity and competitiveness (e.g. Anderson et al., 1994; Herman and Johnson, 1999, etc.); related knowledge is taught both in technical and economic higher education. Based on the data, quality assurance expenditures in proportion to the annual net sales revenues can be determined (Table 11).26
These indicators have a value approach and are designed to bring consumer demand into line with price.
The Quality Sustainability Index can be determined by calculating the average of the above two indicators as follows: [(annual net quality assurance costs + annual net complaint handling costs) / annual net sales revenues] × 100.
Companies using quality controlling can
Table 11 indicatorS of the SuStainaBility of Quality
no. description measurement Source of data
1. Quality assurance ratio (net annual quality assurance costs / net annual sales revenues)
General ledger
2. complaint handling indicator (net annual complaint handling costs / net annual sales revenues)
Source: edited by the authors
Table 10 indicatorS of organiSational and managerial renewal
no. description Quantification Source of data
1. IT quality rate [(annual net IT investment + operating costs)/annual net profit]
General ledger
2. Process / organisational transformation rate
(annual net process organisation cost / annual net profit)
General ledger
Source: edited by the authors
consciously influence and optimise these two, sometimes opposite, cost components.
In the evaluation, the following should be taken into account:
• sectoral particularities (e.g. type and composition of product produced / service rendered, etc.),
• size of the quality assurance organisation (e.g. its operating costs, etc.).
Risks associated with determining this indicator: inaccurate determination of the cost centre or cost bearer, inaccurate accounting for error detection and correction costs.
Indicators of value added
Value added of a product/service: the difference between the sales revenues generated during a specific period and the value of the goods
or services purchased. It is worth noting that companies listed on the stock exchange, where management is expected to increase the price of the company’s stocks, also quantify so-called market value added (MVA) and economic value added (EVA).
The sign and magnitude of value added is an important measure of sustainable financial management (a negative value practically means a depreciation), because the return on capital employed (ROCE) is decreasing.27
There are several methods known in the literature for adding value and calculating value added (Table 12).
When defining these indicators, the following may have a distorting effect: the method used to account for depreciation/
amortisation, the accuracy of inventories,
Table 12 indicatorS of groSS and net value added
no. description definition Source of data
1. Indicators of gross value added [net sales revenues / (net sales revenues + capitalised value of self-produced assets - cost of goods sold (cos) – intermediated services + changes in self-produced inventories – material and energy costs – services used – other services + product and production subsidies – taxes on products and production)]
Balance sheet, narrative report
2. Indicators of net value added [net sales revenues / (net sales revenues + capitalised value of self-produced assets - cost of goods sold (cos) – intermediated services – amortisation/
depreciation + changes in self-produced inventories – material and energy costs – services used – other services + product and production subsidies – taxes on products and production)]
Source: edited by the authors
accruals and deferrals, and the method used to account for low-value assets purchased.
Increase of assets and financial management index
‘Assets’ means the totality of the tangible and intangible assets necessary for the operation of an enterprise. Assets represent the role (forms of appearance) of assets in production/
service provision (fixed assets, current assets, prepayments and accrued income), while liabilities represent the origin of entrepreneurial assets and sources of financing (equity, special reserves, liabilities, deferred income and accrued expenses).
‘Diminution of assets’ indicated that the company faces serious operational, financial and liquidity problems(Figure 12).
Asset position, capital efficiency
The concepts related to the increase of assets and financial management are well known, and the department concerned regularly quantifies them when preparing the annual balance sheet and profit and loss account, and provides their textual evaluation in the reports. Therefore, the determination of these indicators is not an additional burden.
The fundamental purposes of assets are to ensure the fulfilment of public tasks, serve the public interest and satisfy common needs.28
Asset management is designed to preserve and increase assets that are somehow related and interconnected.29 ‘Asset preservation’
basically means the management of assets exercising due care; ‘increase of assets’ means the diversion of revenues towards investments;
while ‘asset utilisation’ means activities ranging from leasing to utilisation.
Figure 12 the Spillover effectS of the diminution of aSSetS
Source: edited by the authors Bankruptcy/
involuntary
decreasing creditworthiness
status indicators decreasing ability
to renew
decreasing ability to create
Increasing environmental pressure diminution of assets
This index shows the dynamics of changes in corporate assets.
Asset position and capital efficiency are important measures of the position and sustainability of operation of a given enterprise.
Based on data in the balance sheet of the enterprise, several asset and capital structure indicators can be calculated (Table 13).
Primarily those indicators are relevant to the model that represent the asset position of the company as a percentage or its year-on- year change.
The risk associated with defining indicators of changes in asset position and capital efficiency is relatively low due to the fact that these indicators are to be determined based on data reported in the profit and loss account and the balance sheet. Therefore, any risk may only arise from the manipulation of these data (e.g. accruals of amortisation/depreciation, prepayments and accrued income/deferred income and accrued expenses, etc.).
Profitability, liquidity position
Profitability is a measure of how effectively a company uses the resources made available to it (labour, technology, capital).
The concepts and knowledge related to this indicator are included in the textual notes attached to the financial statements;
therefore, their definition does not represent an additional burden.
Profitability examines the results of a company for a given period (annual activity) using various indicators (derived from the profit and loss account and the balance sheet).
Profitability is analysed on the basis of ratios (result category/projection basis).
Calculations of the company’s profitability are included in the supplementary notes of the report stipulated by the act on accounting (the most frequently used indicators are summarised in Table 14).
Environmental sustainability sub-index
According to neoclassical economists, reducing the environmental pressure30 increases the company’s costs and reduces its competitiveness (negative externality). In contrast, Porter perceives the environmental pressure caused by companies as inefficiency Table 13 indicatorS of the company’S capital Strength
and capital Structure
no. description calculation method Source of data
1. capital strength (equity capital/total liabilities) Balance sheet, narrative report 2. equity capital increase indicator (equity capital/share capital)
3. Fixed asset coverage ratio (equity capital/fixed assets) 4. asset turnover (net sales revenues/total assets)
5. capital efficiency (profit – or loss – after taxes/equity capital) 6. Fixed assets ratio (fixed assets/total assets)
7. equity capital turnover (net sales revenues/equity capital) Source: edited by the authors
or waste (of materials, energy, etc.) (Porter, Linde, 1995).
According to Porter, innovation-oriented corporate behaviour (e. g. through the introduction of new materials and technologies) is a possibility for reducing environmental pressure, while maintaining the company’s competitiveness.31
The assessment of the difference between these two schools of thought is more complex and requires the corporate management to assume social (ecological, health related) responsibility in addition to responsibility for achieving economic goals.
The reason is that the aim of corporate sustainability is not only to maximise a single factor (after-tax profit for the year) in the short term, but rather the sustainability of operations.32
Companies using an Environmental Management System (EMS)33 and/or an ISO 14001 certified system were familiar with the concepts related to environmental pressure and pollution and knew how to quantify them (the environmental risk assessment guidelines specify the magnitude of the risks to air, soil and water). On this basis, economic organisations are required to declare an environmental pressure charge advance and their annual environmental pressure charge liability (using
Reporting Form No. 1850 of the NTCA).
However, this is still fundamentally new for most Hungarian companies.
To decrease the companies’ environmental pressure three indicators are quantified by the model (Table 15).
Change in environmental pressure can be measured by the change in the simple arithmetic mean of the three indices. (The audited company quantifies the above data but treats them as business secrets and, therefore, has not disclosed them to us.)
The following may pose a risk when calculating this index:
• ‘window-dressed’ data used by companies to avoid the payment of environmental pressure charges (Act LXXXIX of 2003 on Environmental Pressure Charges) and/or penalties,
• the result is not sector-independent (e.g.
from the basic charge/heating rate/sanitary hot water rate calculation methodology).
eMPIrIcaL exPerIence
We tested the applicability of our model using public data of a water utility company for the 2010–2017 period.
Table 14 indicatorS uSed to examine profitaBility
no. description calculation method Source of data
1. return on investment – roI (profit or loss after taxes/total assets) Profit and loss account 2. return on equity – roe (profit (or loss) after taxes/equity capital)
3. return on sales – ros (operating profit or loss/net sales revenues)
4. cash flow gap (narrow cash flow/net sales revenues) 5. return on assets (profit before taxes/all assets) Source: edited by the authors
Table 15 indicatorS for reducing environmental preSSure
no. description calculation method Source of data
1. Proportion of air pressure charge (air pressure charge/net sales revenues) General ledger, technical data 2. Proportion of water pressure
charge
(water pressure charge/net sales revenues) 3. Proportion of soil pressure
charge
(soil pressure charge/net sales revenues)
Source: edited by the authors
As the first step, in addition to the availability of data, we examined the closeness of relationships between individual indicators and sub-indices (the environmental sub-index was disregarded in the calculations due to the lack of historic data, and as regards the integrity sub-index, we only data on ethical compliance).
Most of the data in the six-by-six correlation
matrix revealed a moderate relationship between the sub-indices (Figure 13).
As a second step, the composite index was determined.
Based on the six different sub-indices, we chose the standardisation method, which represents the percentage change in corporate sustainability over time (between 0 and 100).
To this end, minimum and maximum values
Figure 13 an example of the compariSon of competencieS within organiSational unitS
R =
1 0.5234 0.5468 0.5572 0.4321 0.2817 Competencies 0.5234 1 0.2901 0.4571 0.5432 0.1741 Capacity 0.5468 0.2901 1 0.5624 0.1421 0.1111 Ability to renew 0.5572 0.4571 0.5624 1 0.1684 0.1141 Value creation
0.4321 0.5432 0.1421 0.1684 1 0.1517 Increase of assets/financial ma- nagement
0.2817 0.1741 0.1111 0.1141 0.1517 1 Environmental sustainability
Source: edited by the authors
were determined for each sub-index (Table 16), and the test value, which may vary between 37 and 43 percent during the period under review (2010–2017), can be compared with these values.
The second question that we seek to answer:
How do sub-indices affect the value of the sustainability index?
The decomposition confirmed that the renewal and value creation sub-indices represent a weakness for the given company (Figure 14).
suMMary
No economic policy that is committed to collective values can do without the dual ownership. However, duality does not imply
structural constancy; the proportion of public and private ownership may vary over time and space. On the other hand, the involvement of the state in real economic must not lead to a deterioration in the productivity, cost insensitivity and competitive disadvantage of community-owned companies.
The magnitude, economic and social importance of state property justify continuous monitoring of the sustainability of state- owned enterprises and, where necessary, the development of required interventions.
Using a composite index consisting of six sub-indices (ability to renew, value creation, integrity, competencies, increase of assets and environment), it is possible to compare sustainability not only within individual sectors, but also across sectors, and for the owners to take measures based on the results.
Table 16 magnitude of indicatorS included in the SuB-index
(2010–2017)
no. Sub-index indicator minimum maximum
1. Integrity sub-index Legal compliance 0.210 0.720
ethical compliance 0.340 0.820
2. competencies sub-index Individual competencies 0.410 0.810
organisational competencies 0.380 0.790
3. capacity sub-index Throughput 102,481.000 123,111.000
Productivity 3,810,000.000 4,022,000.000
4. ability to renew sub-index Technical and technological renewal 0.00001 0.00001
Portfolio renewal 0.000013 0.000021
organisational/managerial renewal 0.000001 0.00000101
5. Value creation sub-index roa –2.000 3.600
roI – –
6. asset position sub-index capital strength 17.600 24.200
roI –1.100 10.300
Fixed asset 0.991 1.078
Source: edited by the authors
The tools of sustainable enterprise development (value management, environ- mental management, change management, assets management, knowledge management,
motivation management) are given. It depends first and foremost on the preparedness and commitment of the senior management, how for what and with what results these tools are used.
1 New theories concentrate in particular on the role of the state in technological development, the protection and development of strategic industries, its impact on international division of labour, as well as issues related to the oversight of state-owned business associations (Milicz, 2016) and the management of state-owned and municipality-owned business associations (Do- mokos et al., 2016).
2 In developed Western European countries there was a turn of events in the practice of state ownership in the 20th century. In the era of neoliberalism, marked by theorists Milton Fried- man and Friedrich August von Hayek, people generally believed that the state was a bad owner;
therefore, the companies in its ownership were weaker market players than privately-owned companies with the same profile. Following the
Figure 14 decompoSition of SuStainaBility
% 6 4
2 1 1 1 2 1 1 1 1 1 1 1 1 1 1 1 1 1 1 1 1 1 1
0
–2 –2 –2 –2 –2 –1 –1 –1 –1 –1 –1 –1
–4 –3 –3
–6
–8
ability to renew Value creation Integrity competencies assets Change in sustainability index (year/year)
Source: Edited by the authors
2011 2012 2013 2014 2015 2016 2017
–1
–4
–7
2 2
4 4
Notes
