Hungarian Higher Education 2014
Strategic Progress Report
Authors:
József Berács András Derényi Gergely Kováts István Polónyi József Temesi
January 2015
© 2015 József Berács, András Derényi, Gergely Kováts, István Polónyi, József Temesi
ISSN 2064-7654
Publisher: József Berács, CIHES executive director Technical editor: Péter Csaba Nagy
Printed in the Digital Press of Corvinus University of Budapest Printing manager: Erika Dobozi
Table of contents
Introduction ...5
Overview ...6
1. Entrance to higher education and student numbers ...9
1.1 Admission trends and the situation in 2014 ...9
1.2 Regional inequality of opportunities in admission to higher education ... 12
1.3 The distribution of Hungarian higher education outcomes by field of study ... 15
2. On the structure of qualifications and the issues of teaching and learning ... 22
3. Trends in higher education funding ... 27
4. An organizational change of key importance: the introduction of the chancellor system ... 33
5. Higher education in Hungary in international comparison ... 37
5.1 Country rankings and country analyses ... 37
5.2 Hungarian and Central European higher education institutions in international rankings ... 44
6. International mobility and export capacity in Hungarian higher education ... 50
Figure 1. Number of applicants and number of students admitted to higher education, 2010-2014 10 Figure 2. Number of students admitted by level of education, 2010-2014 ... 11
Figure 3. Number of students admitted by payment status, 2008-2014 ... 11
Figure 4. Opportunity index* (in %) in bachelor programmes for students from the 30 least developed (LD30) and the 30 most developed (MD30) micro-regions ... 13
Figure 5. Opportunity index* (in %) in higher education vocational programmes for students from the 30 least developed (LD30) and from the 30 most developed (MD30) micro-regions ... 14
Figure 6. Distribution of students by field of study in developed countries, 2000-2012 ... 15
Figure 7. Distribution of students by field of study in Hungary, 2000-2012 ... 16
Figure 8. Proportion of students graduated in MSE by group of developed countries ... 18
Figure 9. Number of first university degree recipients by field of study per 100 000 inhabitants, 2008 ... 18
Figure 10. Proportion of graduated students in MSE among the 25-64-year-olds with tertiary education attainment ... 19
Figure 11. Number of BA/BSc and MA/MSc qualifications, 2007-2014 ... 23
Figure 12. Using new methods for organizing/managing the learning process: distribution of answers ... 25
Figure 13. Accepting uniform outcome standards: distribution of the answers ... 26
Figure 14. Opinions concerning the necessity of revising the teaching and outcome standards of qualifications ... 26
Figure 15. Public funding for higher education institutions in Hungary, (2008-)2014 ... 40
Figure 16. Change of public funding for higher education institutions, in %, European countries, 2008-2014 ... 40
Figure 17. Evolution of student numbers in some European countries, 2008-2014 ... 41
Figure 18. Relative position of government university policy in Hungary, 2012-2014 ... 43
Figure 19. Evolution of the number of inbound and outbound students between 2001 and 2012 in some neighbouring countries ... 54
Figure 20. Erasmus student mobility (study + internship mobility), 1998-2013, Hungary ... 55
Table 1. Number of applicants by level of education, 2010-2014 ... 10
Table 2. Admission rates from the 30 least developed (LD30) and the 30 most developed (MD30) micro-regions in full-time bachelor programmes ... 12
Table 3. Admission rates from the 30 least developed (LD30) and the 30 most developed (MD30) micro-regions in higher education vocational programmes ... 13
Table 4. Proportion of MSE students in groups of developed countries ... 16
Table 5. Number of first university degree recipients by field of study, 2006-2012... 17
Table 6. Number of 25-64-year-olds with tertiary education attainment and their distribution by field of education in Hungary ... 19
Table 7. Proportion of new entrants to higher education in MSE among all new entrants by group of developed countries, 2009-2012 ... 20
Table 8. Main components of higher education budgetary plans, 2009-2015 ... 28
Table 9. Data of higher education budget based on the institutions’ financial reports, 2009-2013 .. 30
Table 10. Higher education revenues in detail based on the institutions’ financial reports, 2009-2013 ... 31
Table 11. U21 ranking of national higher education systems in 2014 ... 38
Table 12. U21 ranking of national higher education systems after adjusting for levels of economic development in 2014... 39
Table 13. Autonomy scores (2010) ... 42
Table 14. Countries of the region in the QS World University Ranking ... 45
Table 15. Indicator values of some East-Central European and Central Asian countries, based on QS ... 46
Table 16. Indicator values of some countries among BRICS & Emerging Economies, based on THE Ranking ... 47
Table 17. Research ranking: indicator values of some countries ... 48
Table 18. Revenues of TUB from international sources (in thousand HUF), 2008-2012 ... 51
Table 19. Export and import, incoming and outgoing students in Hungarian higher education ... 51
Table 20. Countries sending more than 100 students in 2012/2013 by main strategic groups ... 52
Table 21. Top 10 countries by certain priority indicators ... 53
Table 22. Grants and supports awarded by Tempus Foundation (TKA) and by Campus Hungary, revenue of Hungarian Rectors’ Conference from tuition fees, number of participants in mobility programmes in 2013 and during the whole period of the programmes ... 56
5 | P a g e
Introduction
The destiny of Hungarian higher education is an intriguing topic for all because – as many of us would agree – the future of Hungary depends on the present of education. At the beginning of each year when higher education applications are submitted, tens of thousands of families are in agony because they have to make a crucial decision. By then, the central budget has already earmarked the state funds to be spent on higher education in the given year. Higher education institutions are busy recruiting their students: they are organizing open days, placing in advertisements, competing at the Educatio Fair, and politicians also speak up more often on the topic at this time of the year.
The whole of society is concerned with the basic issues of higher education. Is it worth attending higher education institutions in Hungary? Do graduates have any kind of future ahead of them? In which direction is the standard of Hungarian higher education heading? Who pays the costs of education and who should be paying for them: the state, the students or the potential employers?
Where do we stand in the international competition? A multitude of questions could follow, about which everybody has an opinion: some form firm and more persuasive views while others less pronounced ones. Ever since its foundation, the Center for International Higher Education Studies (NFKK-CIHES), established in 2008 at Corvinus University of Budapest (CUB), has always considered it to be its mission to take stock – at the beginning of each year in the last week of January – of the previous year and of the trends that were in focus throughout the year before. Since 2009, CIHES has been organizing its yearly conference on “Hungarian Higher Education”, where researchers, university officials, government representatives and foreign experts can share their views on higher education before a steadily growing audience.
Two years ago, CIHES decided to draft a document – in preparation for the conference – on Hungarian higher education with an analogous title. The “Strategic Progress Report” on the year of 2012 focused on six topics on sixteen pages. The authors of the documents, i.e. the leaders of CIHES, were faced with the challenge of how to write about something so briefly: many of the topics could not even be touched upon while we had the impression that academic argumentation was also injured. In harmony with the philosophy of our research centre and in order to make it available for the international public, we published our progress report for 2013 in English as well, covering topics equally relevant on the international level.
Our strategic progress report for 2014 presents higher education on as many as fifty pages, with lots of tables and graphs, and yet, it is still fragmentary. The authors of the study are all members of CUB-CIHES, but not all of them are full-time employees of the university. Since 2014, the research centre has been open to Hungarian and foreign higher education researchers as well. This gives even more variety to our study, which we recommend to all readers interested in higher education.
Most likely you will not find every topic which you are interested in or which is present in public discourse. That is exactly why you should attend our conference on 28 January with the subtitle
“Waiting for a Shift in Gears…” There you can obtain first-hand information from the competent state secretary about the directions of development for a performance-based higher education.
The Authors
6 | p a g e
Overview
1 The change of government in 2010 and the turn in education policy manifested in the new Higher Education Act of 2011 as well as the government decrees on the implementation thereof (the raising of the minimum admission score, the introduction of student contracts, the extension of fee- paying programmes, the extreme raising of the admission scores of the state-funded places of 16 programmes) led to a decline in the number of applications to higher education exceeding the demographic effect.
2 As it transpires from the analysis of regional divergences, the chances of admission to higher education – i.e. bachelor programmes and higher education vocational programmes – vary according to the micro-regional location of the permanent place of residence of those admitted. It is especially students coming from the most disadvantaged micro-regions whose chances declined in undergraduate-level higher education between 2002 and 2012. On the other hand, the trend in the longer run seems to justify the claim till 2010 that shorter higher education programmes can increase the chances of admission to higher education of those students who come from disadvantaged micro-regions. However, even their chances were reduced as a result of the Higher Education Act of 2011 due to the transformation of higher education vocational programmes.
3 Our analyses have shown that the educational and outcome structure of Hungarian higher education does not differ significantly from those of the developed countries. Indeed, we are somewhat behind regarding our outcomes in terms of MSE programmes, but (as a result of earlier processes), the ratio of graduates in science and engineering in the age group of 25-64-year-olds is not unfavourable at all. Thanks to the efforts of the past period, the proportion of those representing these academic fields has been growing among new entrants as well. Nonetheless, this ratio is still low in international comparison.
4 The accumulated findings of the empirical studies concerning the individual subdomains of teaching and learning indicate that while the teaching staff are affected by burnout and frustration due to their pedagogical difficulties and – in many cases – failures along with their lack of means to change the situation, they not only recognize these problems, but are also open to changes promising to improve the situation and bring innovative solutions. All of the above imply that the current climate of higher education is favourable for education policy initiatives aiming at the improvement of the quality of teaching and learning.
5 The revision of qualifications and the reformation of teaching are both quite timely, indeed: the figures indicate that the system of qualifications of Hungarian higher education has been frozen since 2010/2011, that is, the introduction of the two-cycle structure in a phasing-out system: barely any outdated qualifications have been abolished or new ones created ever since. Thus it is not only the quantity and the regional distribution of qualifications that have become “ossified”, but the internal structure as well, with very different – and in some cases, distorted – proportions in each region.
6 Based on the analysis of the total revenues side, the funding conditions of Hungarian higher education have been quite rhapsodic in the past five years. The diminution of the proportion of state support has been conspicuous, which is disturbing, especially in international comparison. A similarly steady decrease can be detected in the ratio of the total expenditure on higher education as a percentage of the total expenditure of the state budget. After the peak year of 2011, the figures of institutional revenues and expenditures deteriorated. Based on the figures of budget reports, it is clear that a growing proportion of the expenditure on higher education is funded from the institutions’ own revenues. In 2013, this made up for nearly two thirds of the total expenditure.
At the same time, the proportion of transfers from non-budgetary sources (i.e. directly from
7 | P a g e companies, organizations, international organizations) within the total revenues stagnated steadily and merely around 3.5-4%. This is an extremely modest sum, and as such, it is one of the major weaknesses of the funding of Hungarian higher education.
7 The normative state support for higher education has been basically terminated, to be replaced by a kind of mixed system of historic budgeting and earmarked state support, which is heavily hand- operated: it is non-transparent for the institutions and cannot be foreseen in the long run. Although the higher education strategic draft proposal issued in 2013 was yet calling for the restoration of normative state support, the 2014 document affirms that “the funding of the programmes relies on cost calculations determined along identical principles, and its sum will be differentiated by institution, adjusted on the basis of predetermined performance indicators”. It is too early to form an opinion about the latter system yet, but this would require the substantial transformation of cost recording (even in the simplified form of cost calculation) and the identification of proportionate and fix costs.
8 The strategic plan for higher education devised in 2013 proposed that “within a reasonable time frame, Hungarian higher education should reach the level customary in OECD countries, i.e. a budgetary expenditure of 1-1.2 percentage points of GDP”. However, the new higher education strategy issued in autumn 2014 declares that “the direct state support cannot be substantially increased in the upcoming years, and in light of the robustness of the system, it is not even advisable to be so exposed to a single source of revenue”. If we take this fact and the objective to improve the quality of education and research together, the only likely scenario in the medium run seems to be the considerable polarization of the stakeholders of higher education.
9 Since 2011, the organizational and managing autonomy of higher education institutions has been reduced dramatically. Just to cite a few examples: the appointment of rectors and Chief Financial Officers by the Minister, the appearance of budgetary supervisors, the restriction on the establishment of companies and the introduction of centralized payroll. It should be added, however, that the current higher education strategy envisages the expansion of management rights (asset management, founding companies). The year 2014 saw the introduction of an additional element, the chancellor system – along with the restoration of the university’s right to elect its rector –, which was carried out most of all with reference to the practice in Germany. However, the Hungarian implementation diverges significantly from the logic of the German practice on two points: on the one hand, there are no built-in mechanisms to resolve conflicts between the chancellor and the academic leadership (rector), and on the other, the chancellor’s internal and external legitimacy is uncertain, not to mention the strong tendencies inherent to the system to erode his internal legitimacy. Although the chancellor system could be suitable for driving the efficiency of the use of resources, the introduction of the chancellor system on the whole tends to preserve the low-level organizational and managing autonomy of the institutions, especially because it reduces their ability and possibility to take responsibility.
10 International rankings and country analyses indicate that all in all, Hungary’s higher education is in line with its level of economic development, and in general, we are among the middle ranks. Thus the current situation does not seem too bad. However, it is regrettable that we have attained this position as a result of losing significant advantages. In the middle of the 2000’s, Hungarian higher education “outperformed” the country’s level of economic development in many respects; it was usually at the top of the East-Central European region, about to catch up with the EU average. In the past 10 years, however, we have fallen behind in nearly all the rankings. Since these analyses rely on the official figures provided by the Hungarian government via its international reporting obligations, certain ranks and methodological solutions can be disputed, but the overall picture is a realistic one. It would be worthwhile to analyse in detail whether we are dealing with long-term
8 | p a g e
trends and to what extent some of the evaluations can be put down to the impact of the economic crisis, to turns in economic policy or to the return to normality. The recommendations of external observers keep talking about the increase of state support for Hungarian higher education, the expansion of certain components of autonomy, the improvement of admission and outcome rates and the enhancement of mobility.
11 If we analyse the ranks of the institutions in the past three years, we can see that those Hungarian institutions which regularly (ELTE, SZTE, DE) and occasionally (BCE, BME, PTE) appear in these rankings are typically ranked somewhere between 400 and 700, and with that, they come right after the international elite. Taking into consideration the further ranks, Hungary has a relatively high number of good-quality institutions in the aggregated rankings of excellence per number of inhabitants compared to its neighbouring countries – institutions that exhibit a high- standard and well-balanced performance on the whole. In terms of research rankings, Austria and Slovenia stand out in the region while Hungary, the Czech Republic and Poland perform on a similar level, falling behind the former two.
12 The export market orientation of higher education conceals major inequalities both with respect to fields of study and higher education institutions, which is also true for the convergence region. In 2001, Hungary was still in the lead among the Visegrád countries in terms of the absolute number of degree seeking foreign students, with only Austria being ahead of it in the region. By 2012, however, compared to Hungary’s somewhat more than 1.5-times increase, Austria nearly doubled the number of its foreign students, Poland tripled this figure, and the Czech Republic and Slovakia achieved a fivefold increase.
13 Concerning the number of European exchange students and non-European students doing part- time studies in Hungary, we can look to Tempus Public Foundation, the Campus Hungary initiative and a country-specific programme of the Hungarian Rectors’ Conference for a breakthrough. The Brazilian government is sending 100 thousand university students to foreign countries for at least one semester. In the global ranking of host countries, Hungary has attained the exquisite 10th place, while the University of Technology holds the impressive 5th rank among universities. Thanks to the various exchange programmes, part-time studies and study trips abroad, it is not only Hungarian students and instructors who could profit from this favourable opportunity: the international receptiveness of the entire Hungarian higher education has also improved. For the moment, however, the motivation of officials, the international marketing capacity and the pressure from proprietors or the government all seem to be missing – factors which could possibly turn the tide in the export revenues of Hungarian higher education.
On the whole, the situation of Hungarian higher education does not differ significantly from that of the other social and economic areas of the country. Its legal regulations have undergone numerous and significant modifications in every respect and this process is still in course. The three Higher Education Acts approved since the political changeover have been amended nearly 100 times till 2015, with a yearly average of 6-7 modifications in the past 10 years, occasionally along radically new lines of direction in education policy. The higher education strategy currently under preparation will bring a major change in education policy again, and it foreshadows non- negligible amendments in legislation. It remains to be seen to what extent the organic development of Hungarian higher education and its “shift in gears” will be affected by such “jerks of the steering wheel”.
9 | P a g e
1. Entrance to higher education and student numbers
The change of government in 2010 and the turn in education policy manifested in the new Higher Education Act of 2011 as well as the government decrees on the implementation thereof (the raising of the minimum admission score, the introduction of student contracts, the extension of fee-paying programmes, the extreme raising of the admission scores of the state-funded places of 16 programmes) led to a decline in the number of applications to higher education exceeding the demographic effect.
It transpires from the analysis of regional divergences that the chances of admission to higher education – i.e. bachelor programmes and higher education vocational programmes – differ according to the micro-regional location of the permanent place of residence of those admitted.
We can observe a significant inequality of chances, especially among students coming from the most disadvantaged micro-regions: their chances declined in undergraduate-level higher education between 2002 and 2012. On the other hand, the trend in the longer run seems to justify the claim till 2010 that shorter higher education programmes can increase the chances of admission to higher education for those students who come from disadvantaged micro-regions.
However, even their chances were reduced as a result of the Higher Education Act of 2011 due to the transformation of higher education vocational programmes.
It is a frequently recurring issue that there are few students in science and engineering and that few students apply to such programmes. Our analyses show that the educational and outcome structure of Hungarian higher education does not differ significantly from those of the developed countries. Indeed, we are somewhat behind regarding our outcomes in terms of programmes in science and engineering but (as a result of earlier processes) the ratio of MSE graduates in the age group of 25-64-year-olds is not unfavourable at all. Thanks to the efforts of the past period, the proportion of those representing these academic fields has been growing among new entrants as well. Nonetheless, this ratio is still low in international comparison.
1.1 Admission trends and the situation in 2014
Due to the reduction of the admission quotas, the total number of students was more than 10%
lower for the academic year of 2013/2014 than for the academic year of 2010/2011 (within that, the number of students in full-time programmes dropped by 7% and that of part-time programmes by 20%). In international comparison, Hungary is one of the few OECD countries where the number of students went down in the past four years (besides Slovenia, Poland, Italy, New-Zealand and Estonia). After the uncertainties concerning further education following 2011 and the subsequent decline in the number of applicants, the situation seems to have consolidated by 2014 and the number of applicants to higher education saw a slow increase, as did the number of those admitted (to some extent).
Nevertheless, the number of those admitted to full-time programmes continued to diminish, even if to a lesser extent than in the previous years, i.e. only by 2%. In 2014, the number of students admitted to full-time higher education was smaller by nearly one fourth (23%) than in 2011. The proportion of those admitted to part-time programmes out of the total number of students admitted was 32.7% in 2010 and 26.7% in 2013. The year of 2014 saw a minor upswing in this area as well: in absolute figures, their number grew from more than 83 000 to almost 86 000, attaining a 30% ratio.
It is evident that the drop in full-time programmes cannot be put down to demography, or at least, not exclusively, since the age group of 20-24-year-olds shrank only by 3% between 2010 and 2013.
10 | p a g e
However, even the diminution of the number of students having obtained a secondary school leaving certificate remained below 10-12%.
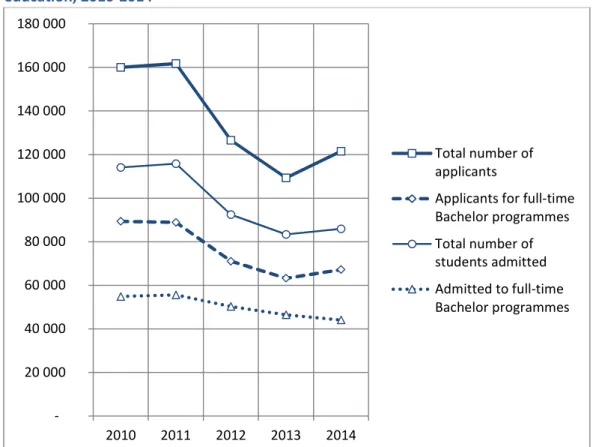
Figure 1. Number of applicants and number of students admitted to higher education, 2010-2014
Source: based on data from http://www.felvi.hu/felveteli/ponthatarok_rangsorok/elmult_evek and http://www.felvi.hu/felveteli/ponthatarok_rangsorok/friss_statisztikak
In 2014, the number of applicants for each level of education was higher than in the previous year.
The number of applicants to tertiary vocational programmes, bachelor programmes, master programmes and integrated programmes was 52%, 8%, 11% and 17% higher (as first-place application) than in the previous year, respectively.
Table 1. Number of applicants by level of education, 2010-2014
2010 2011 2012 2013 2014 Higher education vocational programmes 9 978 11 435 9 008 4 719 7 188
Bachelor programmes 108 314 106 883 80 352 71 120 76 684
Master programmes 30 194 32 378 28 292 24 621 27 321
Integrated programmes 11 547 11 035 8 922 8 799 10 316
Source: based on data from http://www.felvi.hu/felveteli/ponthatarok_rangsorok/elmult_evek and http://www.felvi.hu/felveteli/ponthatarok_rangsorok/friss_statisztikak
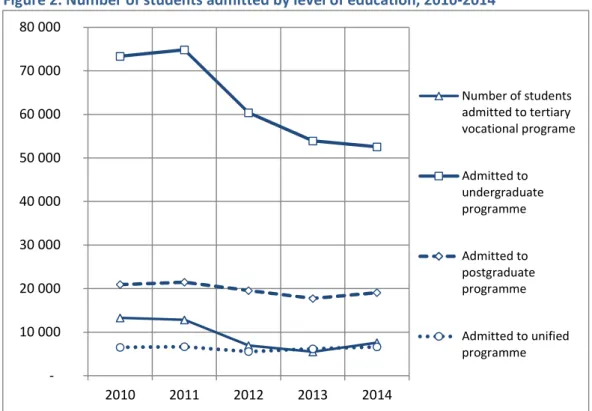
Almost 40% more students were admitted to tertiary vocational programmes than in the previous year, but this figure is still only 59% of the number of those admitted in 2011. A little more than 7%
more applicants were admitted to both master programmes and integrated programmes than in 2013. In the case of integrated programmes, the number of students admitted is identical to the 2011 figure, but the figure for master programmes is more than 10% inferior to that year. 3% less students were admitted to bachelor programmes than in the previous year, and this figure amounts to less than 60% of the 2011 data.
- 20 000 40 000 60 000 80 000 100 000 120 000 140 000 160 000 180 000
2010 2011 2012 2013 2014
Total number of applicants
Applicants for full-time Bachelor programmes Total number of students admitted Admitted to full-time Bachelor programmes
11 | P a g e Figure 2. Number of students admitted by level of education, 2010-2014
Source: based on data from http://www.felvi.hu/felveteli/ponthatarok_rangsorok/elmult_evek and http://www.felvi.hu/felveteli/ponthatarok_rangsorok/friss_statisztikak
The number of students admitted to state-funded places was 5% higher than in the previous year, but despite this increase, it was still 16% lower than the number of students admitted with such payment status in 2011. 6% less students were admitted to fee-paying places than the year before (obviously as a result of the raising of the minimum admission scores and the requirement of advanced level secondary school leaving examination).
Figure 3. Number of students admitted by payment status, 2008-2014
Source: based on data from http://www.felvi.hu/felveteli/ponthatarok_rangsorok/elmult_evek http://www.felvi.hu/felveteli/ponthatarok_rangsorok/friss_statisztikak
- 10 000 20 000 30 000 40 000 50 000 60 000 70 000 80 000
2010 2011 2012 2013 2014
Number of students admitted to tertiary vocational programe
Admitted to undergraduate programme
Admitted to postgraduate programme
Admitted to unified programme
0%
5%
10%
15%
20%
25%
30%
35%
40%
45%
- 20 000 40 000 60 000 80 000 100 000 120 000 140 000 160 000
Number of students admitted to state- funded places
Admitted to fee-paying places
Total number of admitted students Proportion of students admitted to fee-paying places
12 | p a g e
Besides the quality of applicants, it is the distribution of the number of students admitted by institution that reflects the education policy intervention the most (especially in the case of the number of students in part-time programmes). It is clear that the increase in the number of students admitted to state-funded part-time programmes at the Colleges of Baja, Szolnok and Nyíregyháza, or at King Sigismund Business School and at the University of Applied Sciences compared to the previous year is a sign of the education policy intervention. Similarly, the decline at Wesley College or Károly Róbert University College is also an indication of that. For in the case of universities, it is manifest that the outstandingly higher growth in the number of state-funded students admitted at Károli Gáspár University of the Reformed Church in Hungary and at Pázmány Péter Catholic University as well as the significantly higher growth thereof compared to the previous year has been induced by the preferences of education policy, just like the radical fallback in the number of state-funded places at the University of Theatre and Film Arts.
1.2 Regional inequality of opportunities in admission to higher education
With the help of higher education admission databases, we can explore whether the chances of admission to higher education (undergraduate and tertiary vocational programmes) vary according to the micro-regional location of the permanent place of residence of those admitted or not. As we will see, a significant difference can be observed in opportunities at the expense of the disadvantaged.
By arranging the more than 170 micro-regions on the basis of the so-called complex indicator describing their level of development, we can identify the 30 least developed micro-regions (LD30) and the 30 most developed ones (MD30). It transpires from the regional statistical data on education that based on the participation rates in secondary education, those living in the LD30 micro-regions set off for further education with smaller chances already than those living in the MD30 micro-regions, since more than 10% of the students in the LD30 attend schools that do not give a secondary school leaving certificate. We would like to express our gratitude to the former leaders and employees of Educatio Kht. for having provided us with (naturally, anonymous) admission data for the period of 2002-2010 free of charge. The figures for 2012 come from the higher education admission statistical database of the Educational Authority obtained for a certain fee.
We calculated the admission rates on the basis of the above two sources, i.e. how the average secondary school participation of the LD30 micro-regions and the MD30 micro-regions relate to the average rate of admission to full-time undergraduate programmes and tertiary vocational programmes from the given group of micro-regions. The difference between these indicators for the two groups of micro-regions shows the difference in their typical admission chances.
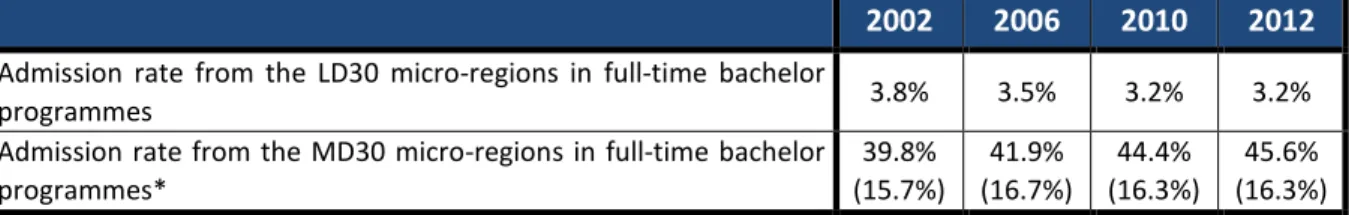
Table 2. Admission rates from the 30 least developed (LD30) and the 30 most developed (MD30) micro-regions in full-time bachelor programmes
2002 2006 2010 2012 Admission rate from the LD30 micro-regions in full-time bachelor
programmes 3.8% 3.5% 3.2% 3.2%
Admission rate from the MD30 micro-regions in full-time bachelor programmes*
39.8%
(15.7%)
41.9%
(16.7%)
44.4%
(16.3%)
45.6%
(16.3%) Source: based on the admission statistics of each specific year
*Percentages in brackets show the admission rates without Budapest
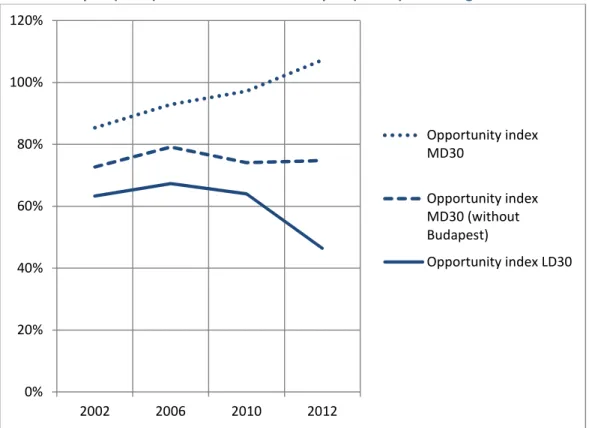
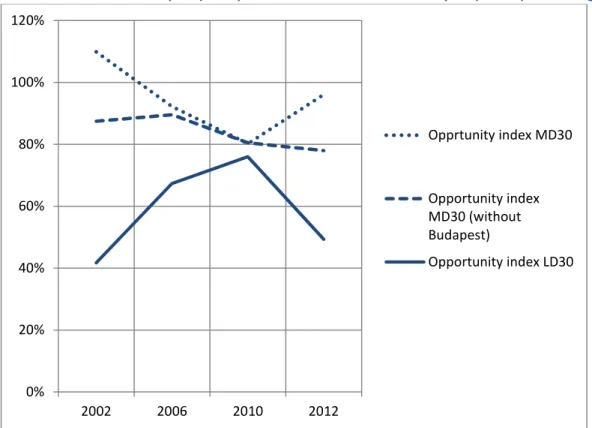
13 | P a g e Figure 4. Opportunity index* (in %) in bachelor programmes for students from the 30 least developed (LD30) and the 30 most developed (MD30) micro-regions
Source: based on the admission statistics of each specific year
*Opportunity index: the average secondary education participation rate from a given group of micro-regions compared to the average admission rate to full-time bachelor programmes from the same group of micro-regions
It is clearly visible that the further education chances of students coming from the least developed micro-regions deteriorated between 2002 and 2012: according to Figure 4, the gap widened from 22% to 61% (from 9.5% to 28.5% without Budapest).
However, as shown by Figure 5, in the case of tertiary vocational programmes, the chances were on the rise till 2010 (they were nearly equalized, the difference being around 4.5%), but then the chances of students of the least developed micro-regions decreased here as well (in 2012, 47%
again, or 29% without Budapest) as a result of the transformation of tertiary vocational education set forth by the Higher Education Act of 2011.
Table 3. Admission rates from the 30 least developed (LD30) and the 30 most developed (MD30) micro-regions in higher education vocational programmes
2002 2006 2010 2012
Admission rate from the LD30 micro-regions in higher
education vocational programmes 2.5% 3.5% 3.8% 3.4%
Admission rate from the MD30 micro-regions in higher education vocational programmes
51.2%
(18.9%)
41.6%
(18.9%)
36.7%
(17.7%)
38.2%
(17.4%) Source: based on the admission statistics of each specific year
*Percentages in brackets show the admission rates without Budapest 0%
20%
40%
60%
80%
100%
120%
2002 2006 2010 2012
Opportunity index MD30
Opportunity index MD30 (without Budapest)
Opportunity index LD30
14 | p a g e
Figure 5. Opportunity index* (in %) in higher education vocational programmes for students from the 30 least developed (LD30) and from the 30 most developed (MD30) micro-regions
Source: based on the admission statistics of each specific year
*Opportunity index: the average secondary education participation rate from a given group of micro-regions compared to the average admission rate to higher education vocational programmes from the same group of micro-regions
The longer-term trend till 2010 justifies the claim that shorter higher education programmes such as tertiary vocational programmes can increase the admission chances of disadvantaged groups (and within that, of students of disadvantaged micro-regions) to higher education.
At the same time, we witness the deterioration of the chances of disadvantaged micro-regions in 2012 both with respect to undergraduate programmes and tertiary vocational programmes (especially the latter). In the case of tertiary vocational programmes, the obvious reason for that is that higher education vocational programmes were radically transformed by the Higher Education Act of 2011 and they stopped to offer qualifications registered in the National Qualifications Register (NQR). In other words, they were deprived of their specificity which used to offer a sense of security for those in a more disadvantaged position: that of offering a useful qualification in the job market after the completion of the tertiary vocational programme (even if no further education followed). Concerning the undergraduate programmes, the deterioration of the chances of disadvantaged students could be put down to the impact of several education policy measures entering into force from 2011 (student contracts, the requirement of an advanced level secondary school leaving examination in an increasing number of programmes, fee-paying students paying full tuition, etc.)
The widening of the already existing gap in undergraduate programmes and the opening of the gap in tertiary vocational programmes in comparison to the previously improving situation is demonstrated by the data of Tables 2 and 3 presented by Figures 4 and 5.
0%
20%
40%
60%
80%
100%
120%
2002 2006 2010 2012
Opprtunity index MD30
Opportunity index MD30 (without Budapest)
Opportunity index LD30
15 | P a g e
1.3 The distribution of Hungarian higher education outcomes by field of study
It is a frequently recurring issue in the strategic plans of Hungarian higher education, but outside of them as well, that there are few students in science and engineering and few students apply to such programmes.
The ratio of students in maths, science and engineering (hereinafter: MSE) is a priority issue in the USA as well as in the European Union, which is linked – among others – to the EU’s efforts in Europe related to the Lisbon Strategy devised in 2000. It is in harmony with the latter that the European education and educational objectives were approved in 2003 by the Education Council of the European Union. The resolution 8430/03 approved stipulates the following concerning the objectives to be achieved by 2010: the proportion of those graduating in maths, science or engineering should increase by at least 15% on average in the European Union and gender imbalances between men and women should be reduced.
If we examine the distribution of students of the 41 developed OECD and EU countries in higher education by the four major integrated fields of study and its evolution between 2000 and 2012 (so that we have comparable data), we can observe some characteristic shifts.
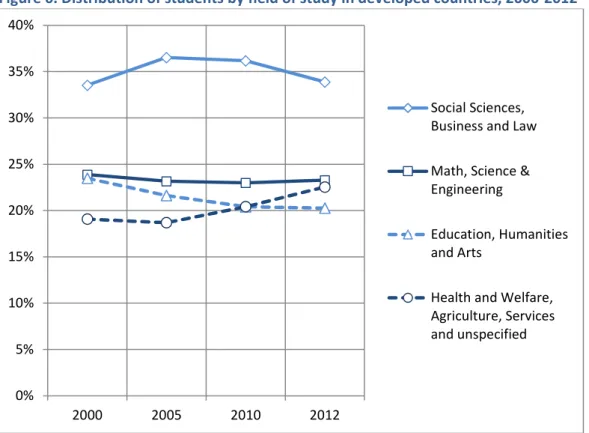
Figure 6. Distribution of students by field of study in developed countries, 2000-2012
Source: based on data from http://data.uis.unesco.org/Index.aspx?DataSetCode=EDULIT_DS
The greatest proportion of students, more than one third of them, attend programmes in social sciences, business and law, but the ratio of this group decreased slightly, but steadily after the peak in 2005. On the other hand, the ratio of students in education, humanities and arts fell continuously from 2000. The proportion of students in MSE remained somewhat above one quarter, and in spite of the priorities presented above, it did not seem to be growing: it stagnated and even decreased a bit. However, the proportion of students in health and welfare, agriculture and services was on the
0%
5%
10%
15%
20%
25%
30%
35%
40%
2000 2005 2010 2012
Social Sciences, Business and Law Math, Science &
Engineering
Education, Humanities and Arts
Health and Welfare, Agriculture, Services and unspecified
16 | p a g e
rise. (It is important to add that the field of agriculture amounts to a mere 1-2% and its proportion shrank from 2.2% in 2000 to 1.8% in 2012.)
In Hungary, the proportion of the field of social sciences, business and law saw a mild decrease while education, humanities and arts dropped more substantially in the same period; the other two, MSE and health and welfare, agriculture and services expanded. (The dimension of the field of agriculture is by far above the average in Hungary: it was 3.9% in 2000, 3.4% in 2010 and 2.5% in 2012. With that, Hungary is the sixth out of the 41 countries after Greece, Croatia, the Czech Republic, Slovenia and Japan.)
Figure 7. Distribution of students by field of study in Hungary, 2000-2012
Source: based on data from http://data.uis.unesco.org/Index.aspx?DataSetCode=EDULIT_DS
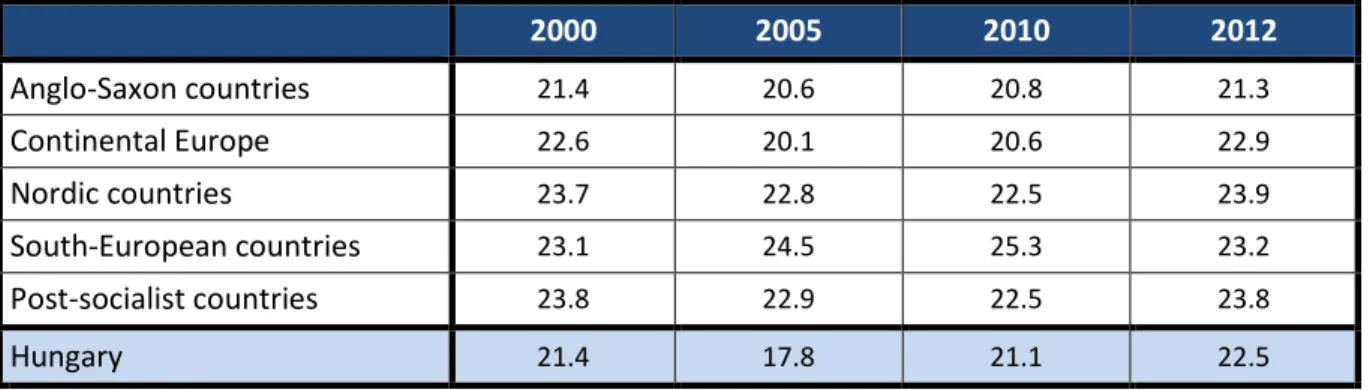
If we divide the 41 countries into five big groups according to Table 4, then a more detailed analysis of the ratio of students in MSE reveals that the rate of proportion increase in Hungary was among the highest in this field in the past years.
Table 4. Proportion of MSE students in groups of developed countries
2000 2005 2010 2012
Anglo-Saxon countries 21.4 20.6 20.8 21.3
Continental Europe 22.6 20.1 20.6 22.9
Nordic countries 23.7 22.8 22.5 23.9
South-European countries 23.1 24.5 25.3 23.2
Post-socialist countries 23.8 22.9 22.5 23.8
Hungary 21.4 17.8 21.1 22.5
Source: based on data from http://data.uis.unesco.org/Index.aspx?DataSetCode=EDULIT_DS
The total number of degrees issued in Hungary per year was basically constant in the past decade, ranging from 49 000 to 57 000. Within that, the number of certificates issued in full-time
0%
5%
10%
15%
20%
25%
30%
35%
40%
45%
2000 2005 2010 2012
Social Sciences, Business and Law Math, Science &
Engineering (MSE) Education, Humanities and Arts
Health and Welfare, Agriculture, Services and unspecified
17 | P a g e programmes fluctuated between 29 000 and 38 000. These fluctuations can be put down to the fluctuation of the number of students admitted as analysed above and the introduction of two- cycle higher education. The number of first university degree recipients (tertiary vocational programmes excluded) went down from 55 000 in 2006 to 39 000. The reason for that (just like in the case of the number of degrees issued in full-time programmes above) is the fluctuation of the demand manifested in admission procedures and the subsequent fluctuation of the number of students admitted, as well as in the introduction of two-cycle higher education.
Let us also look at the number of first university degrees by field of study. (Due to the Hungarian specificities, the field of education is presented separately in Table 5.)
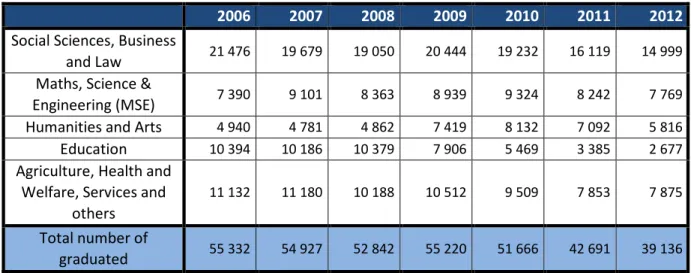
Table 5. Number of first university degree recipients by field of study, 2006-2012
2006 2007 2008 2009 2010 2011 2012
Social Sciences, Business
and Law 21 476 19 679 19 050 20 444 19 232 16 119 14 999 Maths, Science &
Engineering (MSE) 7 390 9 101 8 363 8 939 9 324 8 242 7 769 Humanities and Arts 4 940 4 781 4 862 7 419 8 132 7 092 5 816
Education 10 394 10 186 10 379 7 906 5 469 3 385 2 677
Agriculture, Health and Welfare, Services and
others
11 132 11 180 10 188 10 512 9 509 7 853 7 875 Total number of
graduated 55 332 54 927 52 842 55 220 51 666 42 691 39 136
Source: based on data from http://db.nefmi.gov.hu/statisztika/fs06_fm/ , http://db.nefmi.gov.hu/statisztika/fs07_fm/ , and from higher education statistics 2008-2012 http://www.oktatas.hu/felsooktatas/felsooktatasi_statisztikak
Looking at it by field of study, it was in education that the number of first university degree recipients dropped the most dramatically, almost by three quarters (due to the transformation of teacher training after the introduction of the two-cycle education system). The number of degrees issued in social sciences, business and law as well as in agriculture, health and welfare and services decreased by about 30%. After the upswing of the period of 2009-2011, the number of degrees in humanities and arts fell back to the level of 2006. The number of degrees in MSE stagnated with some fluctuation or saw an (extremely mild) increase. It is evident that these processes can be explained by the reshaping of demand and the change of internal procedures (e.g. the change in dropout).
If we examine the evolution of the distribution of graduates by field of study in light of the average of the above mentioned 41 developed (OECD + EU) countries, then we can see that the proportion of graduates in social sciences, business and law increased, while that of graduates in education went down and the rest more or less stagnated. Using the classification of Table 4, we can also compare the proportion of graduates in MSE. Here we can observe movements contrary to each other: a decrease in the case of the Anglo-Saxon group versus growth in post-socialist countries. As shown by Figure 8, Hungary followed the same trend as the latter group.
18 | p a g e
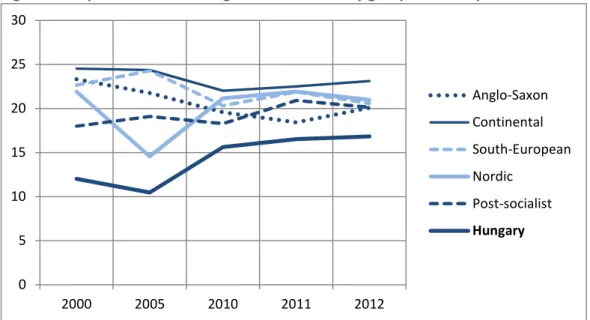
Figure 8. Proportion of students graduated in MSE by group of developed countries
Source: based on Education at a Glance 2008 and Education at a Glance 2011-2014
The comparative study of the G8 countries provides another excellent opportunity to analyse higher education outcomes. The figures allow for a comparison of the ratios of graduates in each field of study in percentage of the total population. We have inserted Hungary’s figures for 2008 and 2012 among the indicator values of the G8.
While in terms of the total number of (first) university degree recipients Hungary is about on the same level as in Italy, Germany and Japan, the number of MSE graduates per 100 thousand inhabitants in 2008 and especially in 2012 was significantly inferior to the figures characteristic of the G8 countries (except for Italy).
Figure 9. Number of first university degree recipients by field of study per 100 000 inhabitants, 2008
Source: David C. Miller, Laura K. Warren (2011): Comparative Indicators of Education in the United States and Other G-8 Countries: 2011 http://nces.ed.gov/pubs2012/2012007.pdf
0 5 10 15 20 25 30
2000 2005 2010 2011 2012
Anglo-Saxon Continental South-European Nordic
Post-socialist Hungary
0 100 200 300 400 500 600 700 800 900 1000
Social sciences, business, law, arts and humanities, education Agriculture, health and welfare, services and others
Math, science & engineering (MSE)
19 | P a g e While the international comparisons made on the basis of participation and graduates data indicate considerably low (if somewhat growing) proportions in the area of MSE programmes in Hungarian higher education (i.e. the flow is low), the situation is not entirely the same with respect to the stock and the ratio of MSE graduates within the population.
The last time the OECD published such figures was in 2008 (and even then for the year 2004). In that comparison, Hungary’s figures were basically identical to the OECD average: Hungary was in mid-range concerning the proportions of both MSE graduates and the other two major fields. The reason for that is that before the political changeover, these fields of study had special priority (especially programmes in engineering and agriculture) for they were considered to be programmes satisfying the demand for specialists in the productive sectors.
Figure 10. Proportion of graduated students in MSE among the 25-64-year-olds with tertiary education attainment
Source: Education at a Glance 2008
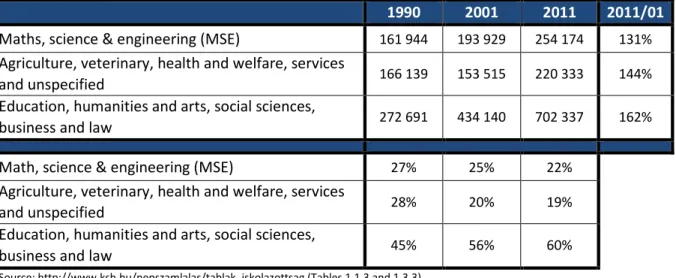
Since the figures presented by the OECD are from ten years ago, it is worth examining the evolution of the number of graduates and their distribution by field in the age group of 25-64-year-olds. In order to do that, we rely on census data.
Table 6. Number of 25-64-year-olds with tertiary education attainment and their distribution by field of education in Hungary
1990 2001 2011 2011/01 Maths, science & engineering (MSE) 161 944 193 929 254 174 131%
Agriculture, veterinary, health and welfare, services
and unspecified 166 139 153 515 220 333 144%
Education, humanities and arts, social sciences,
business and law 272 691 434 140 702 337 162%
Math, science & engineering (MSE) 27% 25% 22%
Agriculture, veterinary, health and welfare, services
and unspecified 28% 20% 19%
Education, humanities and arts, social sciences,
business and law 45% 56% 60%
Source: http://www.ksh.hu/nepszamlalas/tablak_iskolazottsag (Tables 1.1.3 and 1.3.3) 0
5 10 15 20 25 30 35 40
20 | p a g e
Based on the census data, it is clearly visible that the number of graduates of each field of study in the age group of 25-64-year-olds has grown since 2011: the integrated ratio of graduates in education, humanities, arts, social sciences, economy and law increased by nearly two thirds, while that of graduates in agriculture, veterinary science, health and welfare, social science and services rose by 44% and that of MSE graduates by 31%.
Regardless of the above, it is still true that while the proportion of graduates in education, humanities, arts, social sciences, economy and law continued to grow since 2001 and reached 60%
by 2011, the ratio of MSE graduates decreased from 25% in 2001 to 22% in 2011.
All in all, the educational and outcome structure of Hungarian higher education – apart from PhD programmes not discussed here – do not differ significantly from that of the developed countries.
Indeed, we are somewhat behind regarding our outcomes in terms of MSE programmes, but (as a result of earlier processes), the ratio of MSE graduates is not unfavourable at all. Thanks to the efforts of the past period, as demonstrated by Table 7, the proportion of those representing these academic fields has been growing among new entrants as well. Nonetheless, this ratio is still low compared to the average of the individual country groups (except for the Nordic countries). In the past period, the expansion of the proportion of MSE students has more or less corresponded to the average of the continental countries.
Table 7. Proportion of new entrants to higher education in MSE among all new entrants by group of developed countries, 2009-2012
2009 2010 2011 2012
OECD average 33.7 34.3 35.7 34.5
EU21 average 33.8 34.3 36.5 36.2
Anglo-Saxon countries 35.2 35.4 36.4 38.4
Continental Europe 30.4 30.1 32.6 31.7
Nordic countries 33.5 34.8 35.5 34.7
South-European countries 34.1 34.6 37.6 37.8
Post-socialist countries 34.4 36.2 37.3 38.0
Hungary 28.5 30.7 31.1 32.1
Source: Education at a Glance 2011-2014 Distribution of tertiary new entrants by field of education
At the same time, it should be emphasized that increasing the entrance rate of MSE students is not a simple matter of higher education policy priorities and treating it exclusively as such will lead to evident distortions in higher education. Interest in MSE programmes depends on two essential factors.
One of them is the situation of MSE graduates on the job market (demand, salary, unemployment, etc.) and the other is the standard of the academic programmes offered by public education.
As long as a physicist earns about 25% less than an analyst economist or a controller, as long as a biologist makes not even half the salary of a tax consultant or a prosecutor (source:
http://www.afsz.hu/sysres/adattar2014/index.html), it is not surprising that programmes in economy, business and law will be more popular. On the other hand, if salary conditions are truly like that, it is questionable whether MSE graduates (or all MSE programmes) are indeed so necessary for the Hungarian economy. For true demand is much better reflected by salary
21 | P a g e conditions than the statement of the Chambers of the Ministry, or even the strategies of international organizations. And this is equally true for the demand for PhD graduates, allowing that in their case, a decisive part of the demand is generated by state-owned (research and higher education) institutions. It is obvious that raising PhD quotas does not solve anything if the state wishes to employ the eventual graduates for the current salaries.
But the standard of programmes in science and engineering offered by public education (especially in primary and lower secondary schools) poses just as much of a problem. If students are deterred by the programme itself due to various factors (e.g. curriculum, teachers, methods), then it is hopeless to wait for a surge in demand for MSE programmes. Or if an increase in demand is forced out by means of a favourable admission policy and other education policy measures, that may kick in severely counterproductive processes that will encumber the teaching of the given fields in the long run (e.g. by training inadequate maths, physics and chemistry teachers).
22 | p a g e
2. On the structure of qualifications and the issues of teaching and learning
In the course of the past two to three years, several development projects have been implemented which concerned hundreds of instructors and generated a meaningful discussion among them through workshops held about the specific subdomains of teaching and learning.
The experiences thus accumulated indicate that while teaching staff are affected by burnout and frustration due to their pedagogical difficulties, and in many cases, failures as well as their lack of means to change the situation, they not only recognize these problems (which is a remarkable change in attitude), but they are also open to changes promising to improve the situation (such as the revision and harmonization of teaching and outcome requirements announced by the higher education department of the Ministry of Human Capacities) as well as to innovative solutions (such as the application of learning results or outcome-based planning and regulation).
All of the above imply that the current climate of higher education is favourable for qualitative education policy initiatives aiming at the improvement of the quality of teaching and learning.
The revision of qualifications and the reformation of teaching are quite timely, indeed: the figures indicate that the system of qualifications of Hungarian higher education has been frozen since 2010/2011, that is, the introduction of the two-cycle structure in a phasing-out system: barely any outdated qualifications have been abolished or new ones created ever since. Thus it is not only the quantity and the regional distribution of the qualifications that have become “ossified”, but the internal structure as well, with very different – and in some cases, distorted – proportions in each region.
Ever since the transition to the two-cycle higher education system, critical opinions emerge every year (in many cases, mixing the criticism of Hungarian solutions and their implementation with the criticism of the structure). Parallel to that, institutional initiatives also appear advocating the (re)- transformation of two-cycle study programmes into integrated ones and the launching of new integrated programmes. In 2014, these initiatives were also fuelled – to some extent – by the structural revision initiated by the Ministry of Human Capacities. However, it was not the revision of the two-cycle system of programmes that the Ministry was in favour of. Arguing for the integration of job market demands, the Ministry and the revision focused on the reduction of the number of qualifications in the individual fields. In eight years, that was the first serious intention on the government’s part to revise educational and outcome requirements.
The educational and outcome requirements constitute a document regulating the qualifications issued by higher education, which have a significant impact on the content of the qualifications offered by the institutions and thus, on the effectiveness of the programmes. Consequently, it makes sense that the qualifications should be regularly revised, both with respect to their “raison d’être” and relevance.
The figures indicate that the system of qualifications of Hungarian higher education has been frozen since 2010/2011, that is, after the introduction of the two-cycle structure in a phasing-out system: it is not only the quantity and the regional distribution of the qualifications that have become
“ossified”, but the internal structure as well. There have been barely any cases for the minister of higher education to phase out outdated qualifications or to approve new ones in the Ministerial Decree defining qualifications; at the most, there have been a few cases of reassignment from one field of study to another.
23 | P a g e Figure 11. Number of BA/BSc and MA/MSc qualifications, 2007-2014
136 146 151 101 278 299 Total
Source: own calculation based on Ministerial Decree 15/2006.
The data reveal one more prominent distribution pattern: the number of master qualifications is precisely the double of bachelor qualifications, whereas the ratio of students in master qualifications is about one third of the students in bachelor qualifications. This ratio shows significant divergences per field of study: while the number of qualifications of the two cycles is nearly identical in the fields of sport, IT and law, the number of qualifications in humanities is six times higher on master level.
We cannot form a well-founded overview about the learning process in higher education. Although there have been developments with immense reporting obligations in recent years (e.g. FIR, AVIR), those pieces of data that could be indicative of the characteristics of the learning process have not been collected and synthesized. Research directed at certain subdomains, interviews, case studies and the workshop memos of some development projects have revealed that in international comparison, the majority of curricula are still extensive, and they contain a variety of subjects taught in a small number of classes for few credits. This is true for all fields of study. Thus, the learning environment created by Hungarian higher education does not yet effectively allow for intensive learning: study obligations and the organization of learning lead to the fragmentation of attention; the weight of individual and autonomous learning continues being low. At the same time, the learning situations are increasingly diverse, not only because of the increase of the proportion of various internships and field works, but also as a result of the appearance of project-based and task-based learning situations. There are numerous promising attempts at the creation of novel forms of learning, but these often remain invisible even within their own institution. For the moment, the lessons learned from experimental developments and the teaching and learning experience are seldom reported, registered or shared; the knowledge emerging from them is not considered valuable by the instructors, and it gets lost for the institution.
0 5 10 15 20 25
2007 2011 2014
BA/BSc
0 10 20 30 40 50 60 70 80 90
2007 2011 2014
MA/MSc Humanities
Arts
Engineering and technological sciences Agriculture
Natural sciences Social sciences Business and economic science Medical and health sciences
Theological studies Law and public administration Security and military Sport science Informatics Pedagogy Art communication