Cite this article as: Duma, L. (2021) "The Groundless Use of Linearity in Daily Thinking and Decision-making", Periodica Polytechnica Social and Management Sciences, 29(2), pp. 125–135. https://doi.org/10.3311/PPso.14900
The Groundless Use of Linearity in Daily Thinking and Decision-making
László Duma1*
1 Department of Infocommunication, Institute of Information Technology, Corvinus University of Budapest, H-1093 Budapest, Fővám tér 8, Hungary
* Corresponding author, e-mail: laszlo.duma@uni-corvinus.hu
Received: 27 August 2019, Accepted: 23 March 2020, Published online: 16 June 2021
Abstract
The overuse or groundless use of linearity, that is the fallacy of omnipotent linearity, intertwines our everyday lives and decisions.
The misconception of linearity is not an isolated phenomenon, yet we do not handle this question in the proper way. The examples of MPG (Miles per Gallon) and MPH (Miles per Hour) or driving speed have something else in common: there is a widely used indicator conveying a false impression about the nature and physical, economical effects of the described phenomena by creating the illusion of linearity, leading to faulty decisions. In this paper, I show the common cases where we often make linear mistakes, and for which I can give illustrations drawn from scientific publications or everyday examples. Fresh survey research has been done in order to reveal the presence of linearity in the daily decision-making in terms of its groundless use. The article also identifies some common roots to the problem; it also outlines the psychological mechanisms and possible policies to help avoid them.
Keywords
fallacy of linearity, linear mistakes, hyperbolic mistake, misleading indicators
1 Introduction
The overuse or groundless use of linearity, that is the fal- lacy of omnipotent linearity, intertwines our everyday lives and decisions. I am going to clarify what linearity means but first I would like to give an example.
In 2008, an article by Larrick and Soll, "The MPG illu- sion" was published in Science magazine (Larrick and Soll, 2008). The authors examined decision-making on the seemingly simple question about which solution was most advantageous: switching from a high MPG car to another one with a moderate MPG yield, or a lower MPG car to another one with higher MPG yield percentage over the replaced one. The first situation resulted in a gas mileage yield of approximately 15 % (from 12 MPG to 14 MPG).
On the other hand, switching "from a fuel-economic car to a more fuel-economic one" produced a gas mileage yield of more than 40 % (from 28 MPG to 40 MPG). The arti- cle demonstrated based on questionnaires that people would often make an inappropriate choice (Larrick and Soll, 2008). In reality, the lower gas mileage yield (from 12 MPG to 14 MPG) with an average total yearly mile- age produces substantially greater cost savings for the car owner and the national economy as a whole. This is
due to a misleading indicator, and the mistake of linearity, because the fuel volume consumed per distance, i.e. MPG is not a linear but a hyperbolic formula. The article proved this through a questionnaire-poll that most of us (60 %) tend to fall in the trap of this fallacy, and only 1 % approached this problem in the correct way.
In 2013, Allcott found that the MPG illusion was valid by analyzing car purchase survey data (Allcott, 2013).
This was partly due to the article by Larick and Soll, when the US Environmental Protection Agency engaged in a sub- stantial effort to redesign fuel economy information labels that car dealers must post on new vehicles l (Allcott, 2013).
1.1 Objectives and relevance
In this article, I discuss several similar, or isomorphic cases in daily thinking and decision-making, and show their com- mon roots and possible policies to avoid them. The ques- tion we attempt to answer is that to what extent the miscon- ception of omnipotent linearity is present in our everyday and business thinking, what effects it has and how it can be eliminated. A survey research has been done in order to reveal the presence of linearity in the daily decision-making
in terms of its groundless use. I also show that improper indicators can lead to incorrect perceptions and decisions:
that is, they tend to mislead us. It is not an isolated phenom- enon, yet we do not handle this question properly.
First and foremost, let us clarify what linearity means.
Linearity is assuming direct proportionality between two sets of variables. I will study the widespread phenome- non that we assume clear direct proportionality between the elements, i.e. variables or indicators of simple natural, technical and social processes, thus viewing their interre- lation as first-degree functions. For example, if a car con- sumes twice as much fuel than another one then it will use twice as much gas in the same distance (e.g. 100 miles).
As we have seen, even this simple case can lead to much confusion due to the fuel-economy indicator used.
Linearity is one of the key concepts (a so-called "leit- motiv") in human thinking (Van Dooren et al., 2004).
We base much of our short- and long-term business or personal decisions, and also several scientific or practical models on linear proportionality. Forecasting and future studies are heavily affected by the fallacy of omnipotent linearity in the field of business and management. "We are all by nature linear thinkers" (Saffo, 2007). Saffo claims that in effective forecasting it is important to face the fact that technology developments follow the S-curve and thus the shape of a power law. We tend to underestimate the speed with which change will occur (Saffo, 2007).
This article will focus not on the fallacies in mathemat- ical or economic problems, mostly encountered in the field education, and not on the non-linear relations in complex, multi-variable or stochastic processes but on everyday lin- ear fallacies involving one simple factor. Conclusively, I will deal with the simple linear mistakes or fallacies in perception, decision-making and interpretation while addressing natural-technical or economic-social problems.
Of necessity, there are a number of other non-linear mod- els too describing our natural or artificial world, and actu- ally, there are more such models than linear ones. I will try to pick the common cases where we often make linear mistakes, and for which I can give direct or indirect illus- trations through scientific publications or everyday exam- ples. I would like to demonstrate that this phenomenon is more than the mere misuse of an otherwise not too difficult mathematical rule. It has multidisciplinary roots and con- stitutes a general framework and/or trap in our thinking.
Scientific research primarily and almost exclusively focuses on linear fallacies in education where this issue is quite well studied. Here we must mention the name of
De Bock and his team who had dealt with this topic in the field of education methodology quite extensively during the recent years, exploring the causes and giving pieces of advice on methodology to correct the problem (De Bock et al., 1998;
2002; 2003; 2014; Van Dooren et al., 2004). The everyday life of adults and the decision-making techniques are less studied areas. That is why we feel that this topic is import- ant, lacking a detailed exploration so far.
The business side of the phenomenon is the exponen- tially growing technologies and their impact on the econ- omy and future. Kurzweil (2014) claims that the pace of technological change, particularly with respect to infor- mation technologies, is exponential and not linear as ordinary person conceives of such things. Many other thinkers have come to the same conclusion. Phenomena governed by the exponential growth rate catch us by sur- prise (Saffo, 2007). We have known about Moore's Law for decades. Moore's Law not only refers to the exponen- tial price-performance improvements of computing but it is relevant in other fields outside of integrated circuits (Diamandis, 2012).
For this reason, my primarily goal in this article is ini- tial exploration. I want to show that the misconception of linearity is not an isolated phenomenon, yet we do not han- dle this question in the proper way, there is a hiatus in our approach. It is all the more true, since it is a multidisci- plinary and common phenomenon, calling for a multidis- ciplinary approach and treatment.
1.2 Some typical linear mistakes
Apart from the MPG illusion from the Introduction, there are a number of similar such mistakes, of which I would like to briefly discuss and analyse here.
2 The MPH illusion
We examine how decision makers lean towards the devel- opment of two different transportation lines. One of the most important performance indicators of rail transporta- tion is the top speed for a given line or rail speed in Miles per Hour (MPH). The problem below will show an exam- ple of the misleading (linear) interpretation of rail speed in MPH, so that we may call it the MPH illusion. Let us assume that we improve the allowed rail speed for one of two existing rail lines of the same length. We then also assume that both lines are 200 miles long, and on one we increase the rail speed from 60 to 90 MPH, vs. on the other from 30 to 40 MPH. The decision makers assess which rail line to develop in order to achieve the greatest gain.
We tend to choose the first option (from 60 to 90 MPH), yielding a 50 % rail speed increase over the second option (from 30 to 40 MPH), creating only a 33 % gain. However, this example is somewhat deceptive as well. Examining travel times for these two options will lead to a decrease of 200 minutes (200/60 h) to approximately 133 min- utes (200/90 h), saving about 67 minutes in the first case.
In the second case, however, we can achieve a decrease of 400 minutes (200/30 h) to 300 minutes (200/40 h), or a time saving of 100 minutes. Thus, selecting the second option will result in a substantially greater time saving, despite that with the first option, rail speed improvement led to a greater percentage. The culprit is the misleading sub- stitute indicator, as travel times will change according to a hyperbolic function (t = s/v). This is the same correlation as in the case of the MPG illusion (see Fig. 1).
Svenson studied a similar mistake, interpreting the effect of speed increase in travel time, and concluded that we tend to incorrectly interpret the smaller increase in lower speeds (Svenson, 2009). This systematic mistake was later verified through research with taxi drivers (Peer and Solomon, 2012).
In general, these illusions lead to the question of effi- ciency: this is the amount achieved divided by the amount used, or the indicator showing the most useful amount that can be gained. MPG describes the distance covered by investing one gallon of gas, whereas MPH shows the distance covered by investing one hour of time. The effi- ciency indicators we meet in everyday life, such as energy efficiency when switching from traditional to low-wattage
"green" light bulbs, produce similar cases to the linear fal- lacies of MPG or MPH. There are large numbers of sim- ilar examples, including the calculation of the heating or calorific value of energy sources, the Joule per cubic foot
"energy content" of natural gas when heating our homes, or the J/kg indicator used in Europe for coal.
The similarity of these examples helps us in categoris- ing them, emphasising their common root. The common root of this type of fallacies (MPG, MPH, calorific value, etc.), I believe, can be clearly identified. I will deal with it, together with the possibilities to avoid them, in the second half of this article.
2.1 Other speed illusions
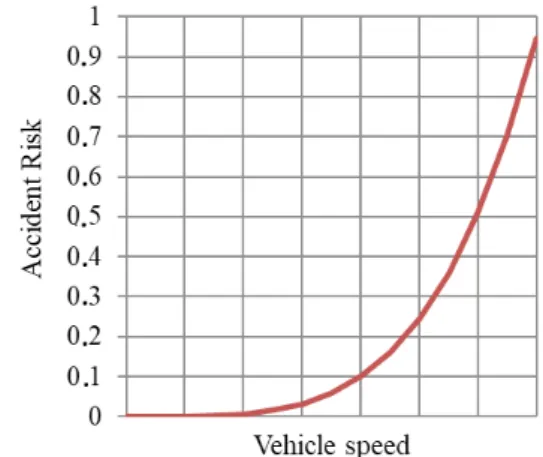
In terms of examining speed, actual driving speed can be considered to be the most important factor, which is usu- ally given in km/h or MPH. Our actual speed affects trans- portation in several ways. Through one's actual speed, the stopping distance of the vehicle, or the safe "manageabil- ity" of the course of our car (e.g. our speed in bends) pri- marily depends on this factor. In reality, stopping distance is proportional to speed squared. That is why an increase in car speed by a factor of two increases the stopping dis- tance by a factor of four times. Generally speaking, the incorrect decision about driving speed can be consid- ered the leading cause of road accidents (World Health Organization, 2013). Several researchers suggest that the increased risk of lethal accidents due to increased driving speed follows a nonlinear but progressive trend (Aarts and van Schagen, 2006) as it is illustrated Fig. 2.
Nilsson summarised this correlation in 2004 in his
"Power model", stating that the number of lethal or seri- ous injuries are proportional to the square of the driving speed (Nilsson, 2004). Other independent researchers later verified Nilsson's model through statistical analysis (Elvik et al., 2004). A few years later, Svenson demon- strated this common mistake through several surveys.
He found that professionals and engineers who are famil- iar with technical issues, made the mistake as well (Svenson, 2009). He also verified this with samples outside Europe, including the US (Svenson et al., 2012).
Fig. 1 The accurate hyperbolic correlation of the MPH illusion: travel
time for 200 miles in minutes as a function of travel speed in MPH Fig. 2 Risk increase of accidents due to increase in driving speed
The above researches and statistical data regarding road accidents indicates that we tend to misinterpret the non-linear effects of speed of our vehicle partly due to the misleading speed indicators (MPH or KMPH).
Still talking about speed, there is a common average speed illusion, which is well known to cyclists. Let us con- sider that on a hilly terrain we cover the same distance at two different speeds, at 8 and 16 MPH, going uphill and downhill. We often calculate our average speed for the whole route wrongly, using a simple arithmetic aver- age. This would give us an average speed of 12 MPH in this case, instead of the correct value of approximately 10.5 MPH! Experienced bikers are usually aware that although we go twice as fast downhill as uphill, our aver- age speed is the harmonic average of the two. Scientific research proved that "judgments deviated systematically from objective mean speeds because the distances driven at different speeds were given more weight than travel time spent on the different distances" (Svenson et al., 2011).
2.2 Linear mistakes in geometry
De Bock and his team, also mentioned in our introduc- tion, have studied the overuse of linearity in math educa- tion for years (De Bock et al., 2003). Out of these, the geo- metric mistakes in area calculations are of key importance.
This simple linear misconception in geometry can easily fool us in everyday situations, such as buying a new TV or display. The most important parameter of displays is the display size measured diagonally usually in inches. During the shopping, our first unpleasant surprise usually comes when realizing that e.g. TV prices are not in linear pro- portion to the increase in diagonal display size. Our sec- ond and much more pleasant surprise comes when realiz- ing that say a 32" TV display is how much larger than say a 24" one. Of course, because the display area increases in square proportion to the diagonal increase. In the survey discussed later in the article we will also examine this area.
2.3 Temperature vs. heat energy dilemma
The behavioral economists Thaler and Sunstein, in their influential book Nudge, presented several methods to direct people in the right direction in order to avoid some typical mistakes in decision-making. One example was the room thermostat, showing not only the set temperature, but according to their recommendations, the cost of required heating energy (Thaler and Sunstein, 2008). One aspect of this problem can be linked to mistakes caused by a
"wrong" indicator, although the authors did not name it in
their work. Let us suppose that we want to raise the tem- perature of our flat from 67 to 74 °F during the winter.
In a linear manner, it seems to correspond to a cca. 10 % increase (7/67 = 0.1). Unfortunately, this has been an incor- rect deduction in most cases. The required heating energy is linearly proportional to the difference between the out- side temperature and room temperature (not to actual room temperature). If, for instance, the outside mean tem- perature is 50 °F, then the temperature difference expands from 67–50 °F = 17 °F to 74–50 °F = 24 °F, yields more than a 40 % (not 10 %) increase in heating costs.
This typical misinterpretation of our heating/cooling costs in relation to our room temperature also underlines an important theoretical issue. Linear mistakes may often come from using the "wrong" scale. Celsius and Fahrenheit values are measured on so-called interval scales and not ratio scales. Consequently, we cannot say that 30 Celsius is twice as warm as 15 Celsius. On an interval scale, only dif- ferences can be interpreted and not proportions since these scales have no absolute zero points. Unlike the metre-scale (length measurement) or kilogram-scale (weight measure- ment), both of which are ratio scales (i.e., 4 metres are twice as long as 2 metres).
2.4 Mistakes concerning network effects
Networks are organised and operate in a specific way, and there are several well-known linear misconceptions in this field.
It has been shown by research that the value of the phone network, one of the oldest artificial networks, is wrongly interpreted by students (De Bock et al., 2014).
This particular issue is closely linked to an interesting field in economics, externalities. Each new phone sub- scriber will increase the "value" of the network not lin- early. That is the total number of available connections equals n*(n – 1)/2 where n is the number of nodes (i.e., the number of subscribers).
Negative network effects and externalities include the phenomenon of congestion, which is quite well known the fields of transportation, telecommunication and infor- matics. In this case, our individual decisions as network users impair the value of the entire network and all other users factorially.
Another practical example of negative network effects at work is the so-called Brooks' law, which says "add- ing manpower to a late software project makes it later".
This surprising rule was coined by Fred Brooks in his 1975 book, based on his experiences in software development.
One of the explanations is that the communication structure of a project (i.e. developers) takes the form of a complete graph, which means that every participant must communi- cate with all other ones and therefore there will be a squared increase in communication "costs". The total number of connections again equals n*(n – 1)/2 whereas the increase in team performance is linear at best. (Raymond 1999).
Distance within networks also changes in non-linear proportion to network size. Research proved that theo- retically any two individuals can contact one another by means of no more than six steps (Milgram, 1967). It is the so-called six degree of separation theory. This "small- world" differs from the Euclidean world we have been used to: it is a non-Euclidean world. Since then this small- world phenomenon has been detected in several fields of life (e.g., computer network topology, interlinking of com- panies, food chains, and cell organisation). The key ele- ments here are the nodes with extraordinarily high number of connections, making these networks scale independent.
In these small-worlds, networks with shortcut connections the distance between two nodes increases in non-linear proportion to the size of the graph but only logarithmically, that is degressively (Albert and Barabási, 2002). In more simple terms, the growth in the number of nodes (N) in a network will increase network distances, i.e. network diameter to a smaller extent only.
Another rule describing the value of networks is Metcalfe's law. It states that the value of a network is pro- portional to the square of its size, which is expressed as the number of connected users of the system. This law was originally coined in relation to telecommunication networks and it has been validated scientifically only recently (Madureira et al., 2013). Social networks behave much the same way. For instance, that is why the prop- agation of AIDS was faster than expected, which high- lights the importance of the problem of misinterpreting distances in a linear way.
Some of the above examples are also referred to as paradoxes (e.g. Brooks' paradox), showing their mislead- ing nature.
2.5 Non-linearity of perceived subjective value
In psychology, we call it a linear asymmetry when a lin- ear or quasi-linear function has different steepness for dif- ferent intervals. Kahneman's prospect theory is a good example of this where the perceived psychological value of different probabilistic alternatives plotted as function of losses and gains has different steepness to the left and right of the zero point, which means that we tend to avoid
risks. The theory also demonstrates another good exam- ple of linear fallacies from the field of human behavior, showing that the psychological value is not in linear pro- portion to the increase in absolute value (i.e., losses/gains) (Kahneman and Tversky, 1979).
Studies on decision making and especially medical deci- sion making have dealt with this area extensively, finding several distortions or fallacies that originate from the differ- ence between the psychological and mathematical probabi- listic values (Woloshin et al., 2000; Gurmankin et al., 2005;
Garcia-Retamero et al., 2010; Chapman et al., 2015). I will discuss this issue further in the second part of the article.
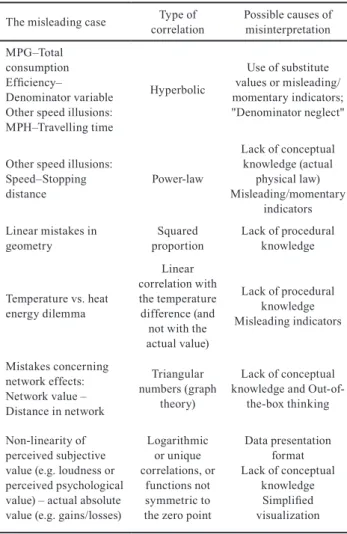
Yet another nice example of non-linear growth is the popular puzzle which goes as follows: "If a lily pad dou- bles in size everyday and on the 20th day it covers a lake, on what day would it cover just half of the lake?". The cor- rect answer is, of course, the 19th day and not the 10th. 3 Summary and categorization of linear mistakes The examples shown so far, their mathematical nature and possible causes are summarised in Table 1. The possible causes are also examined briefly below the chart.
Table 1 Summary of the linear mistakes discussed The misleading case Type of
correlation Possible causes of misinterpretation MPG–Total
consumption Efficiency–
Denominator variable Other speed illusions:
MPH–Travelling time
Hyperbolic
Use of substitute values or misleading/
momentary indicators;
"Denominator neglect"
Other speed illusions:
Speed–Stopping
distance Power-law
Lack of conceptual knowledge (actual
physical law) Misleading/momentary
indicators Linear mistakes in
geometry Squared
proportion Lack of procedural knowledge
Temperature vs. heat energy dilemma
Linear correlation with the temperature difference (and not with the actual value)
Lack of procedural knowledge Misleading indicators
Mistakes concerning network effects:
Network value – Distance in network
Triangular numbers (graph
theory)
Lack of conceptual knowledge and Out-of-
the-box thinking Non-linearity of
perceived subjective value (e.g. loudness or perceived psychological value) – actual absolute value (e.g. gains/losses)
Logarithmic or unique correlations, or
functions not symmetric to the zero point
Data presentation format Lack of conceptual
knowledge Simplified visualization
Evidently, we often misuse linear proportionality due to our lack of conceptual or procedural knowledge.
These two causes, although closely related, are not the same. By lack of conceptual knowledge, we mean that we do not know the actual mathematical correlation behind the process at all (Bush and Karp, 2013). Such is the case with not knowing that kinetic energy changes in squared proportion to vehicle speed or not knowing certain expo- nential correlations and, as a result, we consider these as linear correlations. As distinguished from this, procedural knowledge means internalised, actively used knowledge, which is present in our everyday actions. Conclusively, the lack of procedural knowledge means that although most people do know the actual correlation passively, they are not aware of it and do not apply it actively in practice.
Our survey and its findings are presented in more details under "Research and results".
Part of the problems mentioned in this paper comes from the incorrect use of really simple or intermediate level physical or economic rules and yet, we tend to com- mit these mistakes. As Thaler and Sunstein put it, we are Humans, not Econs who are always rational. It is well shown by the common experience in education that it is often hard for the people to learn and generalise even the method of linear thinking. Even our linear reasoning is mainly conceptual and not procedural first, being inter- nalised gradually only, taking a lot of time (Bush and Karp, 2013). It can be easily understood then that to learn, let alone actively use a non-linear approach is rather hard.
Part of the problem may come from the relational vs.
feature-based reasoning. Non-linearity is rather a rela- tion-based category than a feature-based one hence it is determined by fulfilling an abstract relational role.
The difference or interplay of these two categories is essential to better understand the difficulty of creating new techniques of learning in the field of challenging problems (Tomlinson and Love, 2010).
The examples of MPG and MPH or driving speed have something else in common: there is a widely used indi- cator conveying a false impression about the nature and physical, economical effects of the described phenomena;
it creates an illusion of linearity, in turn leading to erro- neous decisions.
The use of substitute values is misleading in itself, as we "measure" time using speed, or fuel consumption using specific consumption. We might call this the trap of spe- cific performance or efficiency indicators. If the variable with the key information (time or consumption) is in the
denominator, it produces a nonlinear, hyperbolic correla- tion. When the denominator contains the key information, interpreting it is not obvious and requires fair mathemat- ical knowledge. Generally speaking, this field is a part of numeracy, which, as several authors claim, is essen- tial for making judgments in everyday life (Reyna and Brainerd, 2008). To understand how difficult is to handle key data in the denominator, we can link this issue to the
"denominator neglect" or "base-rate neglect" phenomenon, which refer to the fact that people adjust insufficiently for the denominator or base rate, which negatively affects their capability to asses values or results properly expressed in mathematical fractions (Reyna and Brainerd, 2008).
Human mathematical competence, in both adults and chil- dren, has evolved to represent numbers in two principal ways (Feigenson et al., 2004). There are great individual differences in mathematical abilities, which correlates with the individual's unlearned, ancient, approximate number sense (Halberda et al., 2008). However, these abilities, the two core systems are limited. That is neither system sup- ports the concept of fractions for example (Feigenson et al., 2004), which explains why we are not able to handle indi- cators formulated as fractions (when the variable with the key information is in the denominator) properly.
However, we tend to favour "specific values", because they can be compared to each other; nevertheless, this comparison can lead to flawed deductions. The MPG or MPH illusions illustrate that we measure (or from the aspect of cognitive psychology, substitute) the important parameter (e.g., fuel consumption or travelling time) with
"wrong" denominator-oriented indicators (MPG or MPH).
The MPG indicator is in fact designed to evaluate the range a vehicle can cover with a full tank of fuel.
We evaluate many processes that are under our control, based on measuring the "surface" only, given their momen- tary (or instant) state from one arbitrary aspect (e.g., the actual speed or temperature of the room). However, the effect of these processes, due to their physical nature, is based on aggregate/cumulative or subtractive values (e.g., kinetic or heating energy), and in this sense, momen- tary indicators are inadequate to describe them correctly.
Our typically linear perception of these momentary indi- cators is erroneous, leading to incorrect deductions.
It is also known that presentation format influences how decision makers value the outcomes of especially medical (Trevena et al., 2013) and management decisions (Al-Kassab et al., 2014). In a study about health-related deci- sions, the perception of risk varied significantly depending
on the presentation format (Chapman et al., 2015). Authors claim that measurable statements are interpreted widely, and their interpretation is affected by framing and their form of presentation. For example, "risks were consis- tently perceived higher, when presented as frequen- cies (e.g., 1 in 50) compared with equivalent percentages (e.g., 2 %)". Conclusively, they recommend that multiple quantitative formats should be used for presenting decision making input information (Chapman et al., 2015).
Actually, the role of information visualisation has been well addressed in management science, claiming that peo- ple's natural decision-making process can be enhanced by appropriate visualisation techniques. Visual representation, however, can also bias managers by directing their atten- tion to the wrong variables or narrowing it to a limited set of alternatives (Lurie and Mason, 2007; Al-Kassab et al., 2014), which can result in misleading implications.
According to the cognitive fit theory, better perfor- mance is achieved by decision-makers when problem-solv- ing processes are adapted to the problem representation (Al-Kassab et al., 2014).
In summary, due to the problems mentioned above, the base conditions of cognitive fit theory are not fulfilled when interpreting the indicators discussed in my paper, giving way to obvious and erroneous linear interpretations and wrong conclusions.
4 Research and results
A survey was conducted in order to reveal the presence of linearity in the daily decision-making in terms of its groundless use. Throughout the spring and fall semesters of 2015, 182 students filled out my survey at two different universities in Budapest (Corvinus University of Budapest and Budapest University of Technology and Economics).
Those students who completed the surveys were pursuing their economics and technology bachelor's degree, attend- ing their sophomore and junior years.
The students were asked to evaluate the effects of a change in certain factors, which possibly could have an influence on everyday economic and technological phe- nomena. The questions (8 questions) assessed the follow- ing fields of daily decision-makings:
• Q1. The change expected in the house-heating costs by increasing and decreasing the room temperature of residence. (2 questions)
• Q2. The assessment of the existing relationship between the vehicle's speed and its stopping-distance.
(2 questions)
• Q3. The possible gain in savings by switching to energy-efficient light bulbs. (1 question)
• Q4. The impact of the change in travelling speed on the journey's total duration. (1 question)
• Q5. Switching from a high gas-consuming car to a low gas-consuming one by ranking the alternatives.
(1 ranking question)
• Q6. The impact of the increase in a tablet's screen size on its effective size, i.e. on the screen's surface.
Geometry related question. (1 question)
First, let me demonstrate the primary findings from this survey. Out of the previously listed question groups, the frequent presences of the MPH (Q.4.) and the geome- try (Q.6.) illusions have been confirmed with the use of the survey. The presence of the MPG illusion has also been confirmed by purposely utilizing different measures to avoid it (Q.5).
Out of the questions answered, the most significant lin- ear misconception has been confirmed in the field of geom- etry (Q.6.). This question sounded as the following: "How much larger do you think a 10" tablet's screen surface over a 7" tablet?" Not more than 20 % of the respondents have given correct answers (the screen-surface is 100 % larger).
High numbers of students merely have given the wrong answer that assumed a 50 % larger screen-surface linearly deriving from the increase in the diagonal screen size.
The other field or the other set of questions, where the linear misconception was significantly present, is the pre- viously defined MPH illusion, or more precisely, interre- lation (conceptualised by the author). This was question group Q.4. in the list. The question sounded as "Imagine that you would like to enhance the highest track speed of two railway lines already constructed with the same track lengths. If you had to choose between two of the options below, which one do you think would be more beneficial to the passengers?
A, Speeding it up from 120 kph (75 mph) to 160 kph (99 mph)
B, Speeding it up from 50 kph (31 mph) to 60 kph (37 mph)".
The correct answer was speeding it up "from 50 kph (31 mph) to 60 kph (37 mph)". Only one-quarter of the respondents have given the correct answer. High rate of the students linearly assumed the higher increase (improvement) in the travelling speed (from 120 kph [75 mph] to 160 kph [99 mph]) would mean higher
timesaving. As a matter of curiosity, speaking of the MPH illusion, those respondents who possessed a driving license and those who did not, also gave the same rate of wrong answers (with license 64.4 % and without license 64.5 %). This finding reinforces the research of (Peer and Solomon, 2012), interpreting the effects of speed increase on the travel time. Their research concluded that even professional taxi drivers tend to incorrectly interpret the increase in speeds.
The MPG illusion and its avoidance mentioned earlier in the first part of this article and the question that attempts to give answers were also present (Q.5.). This particular question was about a measure unit utilised in the US, called the MPG, but instead this question used its reciprocal unit;
the unit that is conventionally used in Europe, the litre per 100 km, like the GPM (Gallon per Mile). The students had to rank each vehicle that had different consumption char- acteristics (alterations in their consumption profile) by their expedience. We can declare that the method employed by Larrick & Soll was valid, implying that a preliminary set- ting of the appropriate unit could help avoid the misappre- hension. The reciprocal unit of MPG (litre/100 km) estab- lishes a linear interrelation between the measure unit and the gas consumed through a set distance (route).
Two-thirds of the respondents correctly chose the answer that showed the highest unit difference in order to save the most on gas (switching from 15 liter per 100 km to 10 l/100 km). In parallel to this, 75 % of the students were correct about a lower difference in the units mean- ing less savings on gas (switching from 6 liter per 100 km to 4 l/100 km).
In the next step of the analysis, the interrelation between the speed and the stopping-distance was evaluated with the use of two similar questions (Q.2.). Interestingly, a high rate of the respondents (56 and 60 %) were aware of the theoret- ically correct proportion to the square concept between the speed and the stopping-distance (a two times increase in car speed increases the stopping distance four times), regard- less of whether they possessed a driving licence or not.
In a manner similar to the previous finding, the students did not have issues selecting the right answer when eval- uating the switch from regular light bulbs to energy effi- cient ones (Q.3.). We measure the energy consumption of a light bulb in Watts, which is linearly interrelated with the total amount of energy consumed through a set period and with the energy costs. This question was aimed to be a control question, because the most obvious linear answer is the correct one, thus 71 % of the respondents gave the correct answer.
To assess the heating costs expected after the 10 % increase and decrease in the residence’s temperature we required two similar questions to answer (Q.1.). We were unable to establish an obvious linear deduction, because there was a similar rate of answers present amongst the correct and incorrect answers. This field is relatively com- plex, since the inner temperature change of the residence does not obviously affect the heating costs; thus, the dis- tribution of the answers was uneven, too.
5 Conclusions
Our survey has found, when evaluating the geometrical and the MPH illusion, people tend to draw wrong linear deductions. However, it also demonstrates, when we inte- grate and utilise proper measure units (question on con- sumption and the reciprocal of MPG), that there are no decision-making errors, unless we utilised non-linearly interrelated units to evaluate certain changes.
The problem discussed here is not an isolated one, but rather a general framework of daily decision making and thinking, creating multidisciplinary effects; I can also identify its common roots. There are other similar exam- ples, which call for further research.
Not forgetting about the different nature of the par- ticular fields discussed, I believe that, due their com- mon roots, we can also find generally applicable methods to avoid and cure the misconception of linearity and its effects. Here, too, further research is required. The diffi- culty and complexity of this formidable task is profoundly illustrated by several researchers of this topic. De Bock in his 2004 article stated that the fallacy of linearity in edu- cation is so deeply rooted that it could not be eliminated completely even by systematic and intensive intervention (Van Dooren et al., 2004) whereas other authors empha- sise the difficulty of decreasing the linear bias in adult decision making (Arnott, 1998).
I would like to highlight the necessity for further research in this realm and will provide some brief sugges- tions below.
Non-linear cases must receive special focus in edu- cation and the training of professionals. They must be highlighted so that they become procedural knowledge in not only one particular professional field. The weight of this issue is well shown by the high number books, articles and papers discussing the importance of cases and misbeliefs, which are contrary to our linear precon- ceptions. Here I must mention (Taleb, 2010; Thaler and Sunstein, 2008), to name but two. We have turned our attention from general and well-known phenomena to
deviant and unique cases. It is because the effects and conclusions of the latter go far beyond the boundaries of individual cases, unveiling unknown (or not fully known) aspects of the world and human behavior. And not only this, with interdisciplinary knowledge gaining more and more ground, we must be aware of the exceptions, together with a less deep general professional knowledge.
In the case of "hyperbolic" mistakes, used as indica- tors when the important parameter is in the denominator (e.g., MPG), their reciprocal values can help preclude mis- interpretations: these reciprocal indicators would actually correspond to linear correlations (Larrick and Soll, 2008;
Thaler and Sunstein, 2008). There have been some exam- ples of this in practice in the US, using the reciprocal value of MPG and the GPM value, as mentioned earlier. For sim- ilar cases in the article, we will avoid misinterpretations by using related methods.
Regarding the base-rate or denominator neglect issue, additional visualisation techniques can help. In such fal- lacies, studies found that using diagrams could greatly help (Sloman et al., 2003). Adding icon arrays or picto- graphs to the numerical information drew attention to the actual denominators and helped people make more accu- rate assessments. (Garcia-Retamero et al., 2010).
In the case of indicators that substitute a critical param- eter (e.g., using MPH instead of a safe stopping distance), thus bearing the possibility of linear misinterpretation, their replacement with more appropriate indicators or using a distorted, nonlinear scale (e.g., on speedometers) would also be a possible solution. In addition, to indicate the speed of a vehicle as kinetic energy is somewhat unre- alistic. Despite this, I specifically mentioned this aspect because it is relevant in the dangerous practice of point- ing the opposite way. Some carmakers (e. g., Tesla) use a non-equidistant, "magnified" speedometer scale for low
speeds (at Tesla Model S up to 60 MPH), thereby reinforc- ing a false and dangerous illusion.
Medical literature has studied extensively how to com- pensate the distortion of perceived values. As a solu- tion, "magnifying glass" or magnifying scales were recommended, featuring logarithmic scales instead of linear ones to represent probabilities between 0 and 1 % (Woloshin et al., 2000). Indeed, based on clinical tests and surveys, later studies proved that such magnify- ing correction for low-probability events were effective (Gurmankin et al., 2005).
Indicators, such as Key Performance Indicators (KPI's), are of primary importance in management. When design- ing them, the above phenomenon should be taken into consideration in engineering psychology or ergonomics, belonging to the realm of applied psychology. Whereas physical ergonomics attempts to adjust a system to the physical capabilities of humans, cognitive ergonomics attempts to adjust it to our cognitive capabilities and typ- ical (linear) fallacies. When choosing substitute indica- tors, however, we must pay attention to the psychological effects of intensity matching. During this process, we often assign variables and functions with different intervals and characteristics to one another, which in itself is one of the reasons of linear mistakes. Therefore, in the case of con- scious substitution, it must be addressed through appro- priate conversion.
I believe that this initial exploration and research fos- ters an understanding of the importance and interrelation of misleading indicators, as well as the misconception of omnipotent linearity. This will eventually help people find appropriate ways to handle this fallacy. Through this article, I would like to attract the attention of research- ers and other professionals to this issue, calling for further research and outlining possible focus areas.
References
Aarts, L., van Schagen, I. (2006) "Driving speed and the risk of road crashes: A review", Accident Analysis and Prevention, 38(2), pp. 215–224.
https://doi.org/10.1016/j.aap.2005.07.004
Al-Kassab, J., Ouertani, Z. M., Schiuma, G., Neely, A. (2014)
"Information visualization to support management decisions", International Journal of Information Technology & Decision Making, 13(2), pp. 407–428.
https://doi.org/10.1142/S0219622014500497
Albert, R., Barabási, A. L. (2002) "Statistical mechanics of complex net- works", Reviews of Modern Physics, 74(1), pp. 47–97.
https://doi.org/10.1103/RevModPhys.74.47
Allcott, H. (2013) "The Welfare Effects of Misperceived Product Costs:
Data and Calibrations from the Automobile Market", American Economic Journal: Economic Policy, 5(3), pp. 30–66.
https://doi.org/10.1257/pol.5.3.30
Arnott, D. (1998) "A Taxonomy of Decision Biases", School of Information and Management Systems, Monash University, Melbourne, Australia, Rep. 1/98.
Bush, S. B., Karp, K. S. (2013) "Prerequisite algebra skills and associated misconceptions of middle grade students: A review", The Journal of Mathematical Behavior, 32(3), pp. 613–632.
https://doi.org/10.1016/j.jmathb.2013.07.002
Chapman, A. R., Litton, E., Chamberlain, J., Ho, K. M. (2015) "The effect of prognostic data presentation format on perceived risk among surrogate decision makers of critically ill patients: A randomized comparative trial", Journal of Critical Care, 30(2), pp. 231–235.
https://doi.org/10.1016/j.jcrc.2014.11.005
De Bock, D., Van Dooren, W., Janssens, D., Verschaffel, L. (2002)
"Improper Use of Linear Reasoning: An In-Depth Study of the Nature and the Irresistibility of Secondary School Students' Errors", Educational Studies in Mathematics, 50(3), pp. 311–334.
https://doi.org/10.1023/A:1021205413749
De Bock, D., Van Reeth, D., Minne, J., Van Dooren, W. (2014) "Students' overreliance on linearity in economic thinking: An exploratory study at the tertiary level", International Review of Economics Education, 16, Part B, pp. 111–121.
https://doi.org/10.1016/j.iree.2014.04.004
De Bock, D., Verschaffel, L., Janssens, D. (1998) "The Predominance of the Linear Model in Secondary School Students' Solutions of Word Problems Involving Length and Area of Similar Plane Figures", Educational Studies in Mathematics, 35(1), pp. 65–83.
https://doi.org/10.1023/A:1003151011999
De Bock, D., Verschaffel, L., Janssens, D. (2002) "The Effects of Different Problem Presentations and Formulations on the Illusion of Linearity in Secondary School Students", Mathematical Thinking and Learning, 4(1), pp. 65–89.
https://doi.org/10.1207/S15327833MTL0401_3
De Bock, D., Verschaffel, L., Janssens, D., Van Dooren, W., Claes, K.
(2003) "Do realistic contexts and graphical representations always have a beneficial impact on students' performance? Negative evi- dence from a study on modelling non-linear geometry problems", Learning and Instruction, 13(4), pp. 441–463.
https://doi.org/10.1016/S0959-4752(02)00040-3
Diamandis, P. H. (2012) "Abundance: the future is better than you think", Free Press, New York, NY, USA
Elvik, R., Christensen, P., Amundsen, A. H. (2004) "Speed and road acci- dents: An evaluation of the Power Model", Institute of Transport Economics, Oslo, Norway, Rep. 740/2004.
Feigenson, L., Dehaene, S., Spelke, E. (2004) "Core systems of number", Trends in Cognitive Sciences, 8(7), pp. 307–314.
https://doi.org/10.1016/j.tics.2004.05.002
Garcia-Retamero, R., Galesic, M. Gigerenzer, G. (2010) "Do Icon Arrays Help Reduce Denominator Neglect?", Medical Decision Making, 30(6), pp. 672–684.
https://doi.org/10.1177/0272989X10369000
Gurmankin, A. D., Helweg-Larsen, M., Armstrong, K., Kimmel, S. E.
Volpp, K. G. M. (2005) "Comparing the Standard Rating Scale and the Magnifier Scale for Assessing Risk Perceptions", Medical Decision Making, 25(5), pp. 560–570.
https://doi.org/10.1177/0272989X05280560
Halberda, J., Mazzocco, M. M. M., Feigenson, L. (2008) "Individual differences in non-verbal number acuity correlate with maths achievement", Nature, 455(7213), pp. 665–668.
https://doi.org/10.1038/nature07246
Kahneman, D., Tversky, A. (1979) "Prospect Theory: An Analysis of Decision Under Risk", Econometrica, 47(2), pp. 263–292.
https://doi.org/10.2307/1914185
Kurzweil, R. (2014) "The Singularity is Near", In: Sandler, R. L. (ed) Ethics and Emerging Technologies, Palgrave Macmillan, London, GB, pp. 393–406.
https://doi.org/10.1057/9781137349088_26
Larrick, R. P., Soll, J. B. (2008) "The MPG Illusion", Science, 320(5883), pp. 1593–1594.
https://doi.org/10.1126/science.1154983
Lurie, N. H., Mason, C. H. (2007) "Visual representation: Implications for Decision Making", Journal of Marketing, 71(1), pp. 160–177.
https://doi.org/10.1509/jmkg.71.1.160
Madureira, A., den Hartog, F., Bouwman, H., Baken, N. (2013)
"Empirical validation of Metcalfe's law: How Internet usage pat- terns have changed over time", Information Economics and Policy, 25(4), pp. 246–256.
https://doi.org/10.1016/j.infoecopol.2013.07.002
Milgram, S. (1967) "The Small World Problem", Psychology Today, 1(1), pp. 61–67.
https://doi.org/10.1037/e400002009-005
Nilsson, G. (2004) "Traffic Safety Dimensions and the Power Model to Describe the Effect of Speed on Safety", Doctoral thesis, Lund University, Sweden.
Peer, E., Solomon, L. (2012) "Professionally biased: Misestimations of driving speed, journey time and time-savings among taxi and car drivers", Judgment and Decision Making, 7(2), pp. 165–172.
Raymond, E. (1999) "The Cathedral and the Bazaar", Knowledge, Technology and Policy, 12(3), pp. 23–49.
https://doi.org/10.1007/s12130-999-1026-0
Reyna, V. F., Brainerd, C. J. (2008) "Numeracy, ratio bias, and denomi- nator neglect in judgments of risk and probability", Learning and Individual Differences, 18(1), pp. 89–107.
https://doi.org/10.1016/j.lindif.2007.03.011
Saffo, P. (2007) "Six Rules for Accurate Effective Forecasting", Harvard Business Review, 85(7–8), pp. 122–131.
Sloman, S. A., Over, D., Slovak, L., Stibelc, J. M. (2003) "Frequency illusions and other fallacies", Organizational Behavior and Human Decision Processes, 91(2), pp. 296–309.
https://doi.org/10.1016/S0749-5978(03)00021-9
Svenson, O. (2009) "Driving speed changes and subjective estimates of time savings, accident risks and braking", Applied Cognitive Psychology, 23(4), pp. 543–560.
https://doi.org/10.1002/acp.1471
Svenson, O., Eriksson, G., Salo, I., Peters, E. (2011) "Judgments of mean speed and predictions of route choice", Transportation Research Part F: Psychology and Behaviour, 14(6), pp. 504–511.
https://doi.org/10.1016/j.trf.2011.05.002
Svenson, O., Eriksson, G., Slovic, P., Mertz, C. K., Fuglestad, T. (2012)
"Effects of main actor, outcome and affect on biased braking speed judgments", Judgment and Decision Making, 7(3), pp. 235–243.
Taleb, N. N. (2010) "The black swan: the impact of the highly improba- ble", Random House, New York, NY, USA.
Thaler, R. H., Sunstein, C. R. (2008) "Nudge: Improving Decisions about Health, Wealth, and Happiness", Yale University Press, New Haven, CT, USA.
Tomlinson, M. T., Love, B. C. (2010) "When learning to classify by rela- tions is easier than by features", Thinking and Reasoning, 16(4), pp. 372–401.
https://doi.org/10.1080/13546783.2010.530464
Trevena, L. J., Zikmund-Fisher, B. J., Edwards, A., Gaissmaier, W., Galesic, M., Han, P. K. J., King, J., Lawson, M. L., Linder, S. K., Lipkus, I., Ozanne, E., Peters, E., Timmermans, D., Woloshin, S. (2013)
"Presenting quantitative information about decision outcomes: a risk communication primer for patient decision aid developers", BMC Medical Informatics and Decision Making, 13(2), Article No. S7.
https://doi.org/10.1186/1472-6947-13-S2-S7
Van Dooren, W., De Bock, D., Hessels, A., Janssens, D., Verschaffel, L.
(2004) "Remedying secondary school students' illusion of linear- ity: a teaching experiment aiming at conceptual change", Learning and Instruction, 14(5), pp. 485–501.
https://doi.org/10.1016/j.learninstruc.2004.06.019
Woloshin, S., Schwartz, L M., Byram, S., Fischhoff, B., Welch, H. G.
(2000) "A New Scale for Assessing Perceptions of Chance:
A Validation Study", Medical Decision Making, 20(3), 298–307.
https://doi.org/10.1177/0272989X0002000306
World Health Organization (2013) "WHO global status report on road safety 2013: supporting a decade of action", World Health Organization, Department of Violence and Injury Prevention and Disability (VIP), Geneva, Switzerland.