An Extended TAM Model, for Evaluating eLearning Acceptance, Digital Learning and Smart Tool Usage
Andrea Tick
Óbuda University, Keleti Faculty of Business and Management, Institute of Enterprise Management, Tavaszmező u. 17, 1084 Budapest, Hungary, Tick.Andrea@kgk.uni-obuda.hu
Abstract: The learning habits among students in higher education, has radically changed in the last 20 years, partially due to the features of the information and digital society, wide scale broadband internet access, proliferation of smart devices and consequently, available online mobile applications. As a result, the use of eLearning systems, in higher education, is a must in the 21st Century. As hardware and software developments periodically foster each other’s progression, the technological developments, including more and more sophisticated eLearning platforms and available mobile applications, triggers a multiplicative, radical change in educational practices and methodologies. This paper presents an extended version of the Technology Acceptance Model (xTAM), applying Structural Equation Modeling (SEM) with the AMOS program. It focuses on the motivation and usage intention of eLearning systems, among early Z generation students, in higher education and highlights the digital learning aspects and smart tool usages in the Hungarian environment. The evaluation of the above external factors illustrates the behavior of students, when using eLearning systems.
Keywords: IT security awareness; xTAM; SEM; eLearning systems; digital learning; Z generation; smart tools
1 Introduction
Modern digital technologies shift educational practices and methodologies toward collaborative, online and offline computer-supported learning. A radical teaching- learning methodological change is still underway in the higher educational practice in Hungary. Universities and higher educational institutions are revising their teaching practices and integrate more and more offline and online eLearning possibilities, furthermore, they strive to involve students’ digital skills gained by internet and smart device usages. The extensive use of smart phones and mobile devices, the transition in the methodology, methods and ways of learning from a traditional form through blended learning to a digital form, as well as, the shift of
learning from offline to online platforms is unquestionable not only in case of individual learning but within organizational frameworks as well. Students as well as adults in higher education turn to a great extent to massive online educational platforms and utilize self-directed learning using their own smart and mobile devices.
The turn of the century brought about the digital information society, in which, the acceleration of economic and digital development originating from the 20th Century further changes and speeds up the life of individuals. As a result, the requirements in the job market, the lifelong learning phenomenon, the tuition fees and expenses of university studies all require students to have a job parallel to their studies as well as continuously improve their skills and gain novel knowledge to become successful in the job market. Consequently, the time spent on studying shortens, students require such forms of learning that gives the freedom of time and space and, at the same time, creates such a framework that enables more concentrated way of learning. Students find the way to use up their idle time frames, for instance time spent on travelling, queuing or waiting. The integration of smart devices as tools for eLearning boosts the process even further since smart devices are always at hand and, by now, broadband internet access on smart devices is taken for granted. According to Toffler [1] the third wave rhythm changes the concept and perception of time the X and Y generations’ approach to time consumption differs. “But time itself has changed in the “real world,” and along with it we have changed the ground rules that once governed us.” [1] The value of time is of high importance. As a response, universities and colleges are determined to offer a wide scale of eLearning possibilities being standalone eLearning courses or in the form of blended learning, integrating these courses into existing curriculums thus transforming the structure of teaching and lecturing.
A detailed survey was conducted among university students of Óbuda University and the Budapest Business School to explore the students’ eLearning usage motivation, acceptance and attitude [2, 3, 4, 5]. The research has introduced an extended Technology Acceptance model (xTAM) using the Structure Equation Modeling (SEM) with the AMOS program. The research gathered a total of more than 600 responses. After the regular data management processes, data cleansing and transformation, more than 500 questionnaires were used for evaluation [2].
After the determination of the exogenous and the endogenous factors, the ones that are highly significant, regarding the features of the digital environment, i.e.
digital learning (DL), as well as, IT security awareness (IT) and smart tools (ST) were analyzed separately. In addition, in case of the questions about digital learning gender was also taken into account.
On the one hand, this paper presents the conclusive findings of the overall research made on the use and acceptance of eLearning systems among the early Z generation-born students in higher education in Hungarian environment. On the other hand, the paper explores two external factors of the model that are related to the digital environment, namely DL and ST. These factors are of crucial
importance in the transformation of the learning process, since digitalization and available internet access revolutionize the practice of studying. The evaluation of these factors reveals the behavior and attitude of students, when using eLearning systems.
2 The Extended TAM Model
The Technology Acceptance Method (TAM) originates from the 80s [6] and throughout time it evolved by separating the external variables to more specialized influencing variables. The model used in the research was compared to other TAM models applied in international and Hungarian environment in [4]. The model is still applicable for technology acceptance and it is used for eLearning usage and acceptance in the research in question. The model is justified by the Structural Equation Modeling (SEM) using the AMOS program.
2.1 Exogenous and Endogenous Variables in xTAM
The extended Technology Acceptance Model (xTAM) includes the following exogenous variables: IT security Awareness (IT), Digital Learning (DL), Smart Tools (ST), System Access (SA), eLearning Anxiety (ANX), Traditional Education (TE) and Social/Cultural Factor (SF) (Figure 1).
Figure 1
The extended TAM model - xTAM
The use of these external factors for the early Z generation in higher education in Hungary were justified in [2] and [3]. The endogenous variables in the model are the Perceived Usefulness (PU), Perceived Ease of Use (PE), and the Motivation and Usage Intention (MUI) as justified also in [3]. The complex research has allowed the evaluation of the existing influencing effects and the relationships of the xTAM exogenous and the endogenous variables as introduced in [3]. Due to
the criteria for model building, model fit and reliability, some of the questions were excluded from the entire model, however they were included when the factors were analyzed separately. The xTAM has not presumed strong influencing effects between the external factors, which, however, proved to be a significant phenomenon in the research. Previous results [3] showed the relationships of the input factors, however, the strength and nature of the relationships of the exogenous factors in the model seemed to justify the grouping of these factors to digital and human factors. This paper focuses on the group of digital variables (IT, ST, DL and SA).
Figure 2
The relationship of the exogenous variables IT, DL, ST and SA of the digital environment In the course of the evaluation, the exogenous variables related to the digital environment -IT, ST, DL and SA- proved to be in a relatively strong correlation with each other, therefore the analysis of their relationship is also valuable for the research (Figure 2).
3 xTAM Evaluation Results
This chapter presents the results of the evaluation of the extended TAM model that was confirmed with SEM using the AMOS program. The Structure Equation Modeling uses regression-based multivariable technique which is combined with path analysis [3]. The model shows the influencing effect of the external variables and makes direct and indirect effects visible.
3.1 Reliability
Previous studies by the author [3, 4, 5] presented the requirements and criteria for using factorization method and the TAM with the SEM model, the reliability applying the Cronbach’s alpha and the Composite Reliability measures. Due to the very low reliability of Traditional Education (TE), it was excluded from the entire model. TE proved to be a poor factor, it turned out that the factor had no impact
on the model itself, which can be explained by the fact that traditional way of education seldom applies eLearning methods and ICT tools. The evaluated model with 56.52% explanatory level had Cronbach’s α=0.691, KMO=0.911 and Bartlett test p=0.000. The factor reliabilities were presented in [4]. Excluding the TE slightly worsened model reliability, Cronbach’s α did not change at all.
3.2 Evaluation of the Input Factors’ Interactions in xTAM
In the course of model verification all the external factors themselves showed correlation with each other, some of them being positive while others negative.
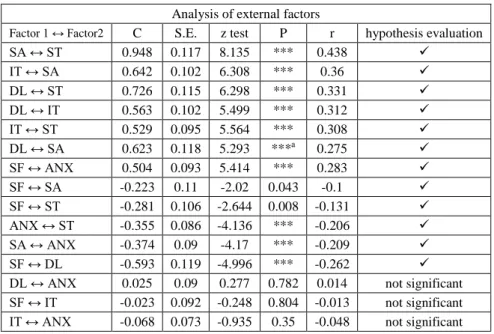
Table 1 summarizes the hypotheses and the conclusions about the interactions amid the external variables. The first column lists the factors; the null hypothesis supposes no interaction between the two factors in question while the alternate hypothesis supposes the existence of the interaction.
Table 1
Interaction evaluation of the exogenous factors Analysis of external factors
Factor 1 ↔ Factor2 C S.E. z test P r hypothesis evaluation
SA ↔ ST 0.948 0.117 8.135 *** 0.438
IT ↔ SA 0.642 0.102 6.308 *** 0.36
DL ↔ ST 0.726 0.115 6.298 *** 0.331
DL ↔ IT 0.563 0.102 5.499 *** 0.312
IT ↔ ST 0.529 0.095 5.564 *** 0.308
DL ↔ SA 0.623 0.118 5.293 ***a 0.275
SF ↔ ANX 0.504 0.093 5.414 *** 0.283
SF ↔ SA -0.223 0.11 -2.02 0.043 -0.1
SF ↔ ST -0.281 0.106 -2.644 0.008 -0.131
ANX ↔ ST -0.355 0.086 -4.136 *** -0.206
SA ↔ ANX -0.374 0.09 -4.17 *** -0.209
SF ↔ DL -0.593 0.119 -4.996 *** -0.262
DL ↔ ANX 0.025 0.09 0.277 0.782 0.014 not significant SF ↔ IT -0.023 0.092 -0.248 0.804 -0.013 not significant IT ↔ ANX -0.068 0.073 -0.935 0.35 -0.048 not significant
a *** p<0.001
Taking the digital factors into account the following can be concluded from the nature of the relationships between the factors. Highlighting the influencing size of the digital factors, all these factors have positive effect on each other, the relationship between ST and SA being the strongest one. This relationship confirms the idea that developing mobile applications for eLearning possibilities on smart device platforms for students in higher education must be in focus. The second strongest relationship in this case is between SA and IT security awareness
(IT), which also justifies the hypothesis that university students are sensitive to IT security issues in case of eLearning system usage and their IT security awareness must be raised. The third strongest relationship exists between DL and ST that proves the concept of providing learning options for the so-called “idle” time that can be used up for learning. Short videos, fast and quickly solvable tasks on mobile platforms help students cover some topics while waiting, travelling or queuing. Students prefer self-study, like eLearning courses and they prefer solving extra tasks and cover extra topics if the application is available on smart tools. IT is also in positive correlation with ST, however, this effect is weaker than in case of SA. System Access questions referred to university computers that form a more robust wired environment. Students usually expect these systems be supervised by university IT staff thus they should rather concentrate on their smart devices’
security problems.
In addition, the above table shows that only eLearning anxiety (ANX) has no interaction with DL and IT security awareness, it is in negative correlation with SA and ST while in positive correlation with SF. Obviously, anxiety implies forbearance from technological solutions, some lack of digital literacy, less confidence in internet usage might result in turning to personal face-to-face contact.
One can draw a parallel between eLearning Anxiety and a Technophobes attitude, who think that some technologies are not for them and tend to ignore technological trends. These type of students do not utilize the benefits of digital learning, do not improve their digital skills and, as a result, “negatively affect their own brand” in the digital society. In parallel, SA has a positive interaction with the digital factors (DL, ST, IT) and a negative interaction with personal/human aspects like Social Factor (SF).
3.3 Confirmative Factor Analysis with the AMOS Program
As a first step the factors were created with Principal Axis Extraction with Promax Rotation. The averages of the factor loadings were over 0.6 and none of them were under 0.3. There was no stronger than 0.7 correlation in the correlation matrix. The question DL4 dropped out in the Pattern matrix, but proved to be strong enough in the structure matrix, thus it was considered in the course of evaluation. No strong cross-loadings were allowed during factorization. Figure 3 shows the graph pattern of the model, including the correlation between the exogenous factors and some error terms (exclusively within a factor).
In the course of model building SEM had to be modified several times. In the first step of the fit test, the covariance matrix showed that the exogenous variables are in correlation, thus these relationships were added to the model. These relationships allowed further hypotheses to be formulated, the evaluation of most of these hypotheses are in [3]. The additional correlations in the model improved
on the model’s fit test (the degree of freedom increased by 15 and CHI2 dropped from 3118 to 2788, the difference is 330, which is significantly more than the double of 15 (the difference between the two degrees of freedom). Consequently, the addition of the correlation among the external factors is justified. However, further improvement on the model was still necessary. The factor loadings were under the expected 0.7 in some cases, however, these factor loadings were kept in the course of the original factor analysis, better factor loadings could not be achieved [4].
Figure 3
The xTAM model evaluation using SEM with AMOS
The model required even further modifications, which were conducted until the model fitted well to the original data. Certain error terms had to be joined in order to improve the model even more. These are all correlations between individual variances within a single factor, there were no cross-correlations. The result model met the requirement of several fit tests, CHI2 was still significant (CHI2=2346.408, and the degree of freedom further dropped by 9), and the other indicators showed a well fitted model. In the end, the model proved to be reliable and fitted to the actual data well. The applied fit test measures with the results and the recommended significance levels are shown in Table 2.
Table 2 Fit measures during SEM
Fit measure Values Recommended value CHI2 2346.408 (p=0.000) p>0.05
RMSEA 0.05 <0.10
CFI 0.905 >0.9
IFI 0.906 >0.9
3.4 Explanatory Levels and Significance of Exogenous Variables on PU, PE and MUI
The explanatory ratio of the Structural Equation Modeling (SEM) is given by R2. Considering the three output factors MUI is explained by 71.7% by the factors – which is a strong explanatory ratio - while PE and PU are explained by 40.4% and 43.8%, respectively, which is a relatively strong explanatory ratio. In the two latter cases there exist some other explanatory factors, the exploration of them will be subject to a future research. Conclusively, in case of the three endogenous factors the model has a good explanatory effect.
Upon analyzing the effect size, which shows the predictive capabilities of the model to the MUI factor, it can be seen that if the values determined in [7] is taken (0.02 means small, 0.15 moderate and 0.35 strong effect size), then in almost each case there is a direct moderate or strong effect, precisely, Digital Learning (0.412), Perceived Usage (0.38) and Perceived Ease of Use (0.277) have strong positive effect size while ANX (-0.291) has a strong negative effect on MUI (Table 3). The strongest positive direct effect is PE → PU (0.42) while the strongest negative effect is ANX → PE (-0.388) (Table 3). It implies that the easier students feel the use of an eLearning system, the more often they will use it while the more frustrated they feel about the eLearning system the more cumbersome they will find its usage. The social factor (SF) has a weak direct effect on PE and PU, even the direct effect is not significant on the MUI. It implies that human factor and the cultural norm in “the third wave” [1] is less dominant in the motivation and usage intention than the digital factors.
Table 3
Effect size between the exogenous and the endogenous factors
ST ANX SA DL SF PE PU
PE -0.388 0.291 0.22 0.13 PU 0.211 -0.31 0.293 0.154 0.42 MUI 0.27 -0.291 0.206 0.412 0.277 0.38
Table 4 summarizes the individual null and alternate hypotheses, the null stating that there is no interaction between the factors, the alternate stating the existence of the relationship. In the model 8 factors were influencing MUI, out of which
Perceived Usefulness (0.324) boosts MUI the most, followed by DL (0.247) and ST (0.172).
In case of PE, System Access has the strongest positive influence (0.254) followed by DL (0.189). PE boosts PU positively the most (0.515), the use of DL and ST moderately, but significantly influence PU (0.211 and 0.204 respectively). ANX proved to worsen all the above three factors – MUI, PE and PU –, which can be explained by the fact that if the use of eLearning systems causes frustration, students will not find it easy to use, will not be motivated and will not have the desire to use the system.
Table 4
Hypothesis evaluation of the interaction of the factors Evaluation of the model – the strength and significance of the interactions
Factor1←Factor2 Coefficient S.E. z test P r hypothesis
evaluation
MUI ← PU 0.324 0.036 8.878 ***a 0.38
MUI ← DL 0.247 0.037 6.704 *** 0.275
MUI ← ST 0.172 0.035 4.882 *** 0.183
MUI ← SA 0.13 0.035 3.674 *** 0.143
MUI ← PE 0.122 0.045 2.706 0.007 0.117
MUI ← ANX -0.146 0.044 -3.318 *** -0.128
PE ← SA 0.254 0.042 6.015 *** 0.291
PE ← DL 0.189 0.041 4.571 *** 0.22
PE ← SF 0.114 0.038 2.963 0.003 0.13
PE ← ANX -0.424 0.051 -8.321 *** -0.388
PU ← PE 0.515 0.064 8.073 *** 0.42
PU ← DL 0.211 0.051 4.117 *** 0.201
PU ← ST 0.204 0.051 4.037 *** 0.185
PU ← SF 0.107 0.047 2.281 0.023 0.1
PU ← ANX -0.197 0.064 -3.071 0.002 -0.147
MUI ← IT 0.007 0.042 0.166 0.868 0.006 not significant MUI ← SF 0.005 0.032 0.143 0.887 0.005 not significant PE ← IT 0.084 0.051 1.638 0.102 0.077 not significant PE ← ST 0.057 0.042 1.357 0.175 0.063 not significant PU ← IT 0.062 0.062 0.997 0.319 0.046 not significant PU ← SA -0.05 0.052 -0.962 0.336 -0.047 not significant
a *** p<0.001
In summary, it can be stated that the two extra digital factors in xTAM (DL and ST) positively strengthen MUI, PE and PU (except ST → PE), i.e. the more students use the digital form of learning and their smart tools, the more motivated they will be to use such courses and systems, the easier to use and more useful they find the systems. Six hypotheses cannot be supported. IT security awareness
is not in direct relation with MUI, PE and PU. IT security awareness, as proved in the previous chapter has direct relation with DL, ST and SA, the nature of the indirect relation of IT to the endogenous factors will also be explored in a future research. Presumably, IT security awareness should be indirectly related to MUI, PE and PU. At the same time neither SA nor ST influence significantly PU, furthermore, ST does not have an impact on PE. The latter might be surprising, since in the digital age it would be expected to have mobile eLearning apps developed for smart tools that boost the perceived ease of use. Supposedly, eLearning mobile apps are still not up to the expectations, challenging higher educational institutions to develop user friendly, easy access eLearning educational platforms for mobile and smart devices.
The influence of Social Factors on MUI gave a non-significant result, which strengthens the raison d’etre of blended learning, since preferring personal, face- to-face consultations and learning does not strengthen or weaken the motivation to use eLearning systems, especially amid the members of the early Z generation - a transitional generation between digital migrants and digital natives [8], who bear the characteristics of the Y generation as being technology savvy, trend followers, receptive to innovations, having social presence and falling into the cluster of Millennials as defined in [7].
Digital learning intensifies perceived usefulness, perceived ease of use as well as motivation. The early Z generation, being almost digital natives, uses e-learning systems with pleasure. According to the results the social factor – personal, face- to-face learning, learning socialization – also gives a positive impulse to eLearning system usefulness and ease, which also affirms the standing existence of blended learning. In this case the lecturer’s persuasive talent could contribute to a great extent to the use of eLearning systems. The significant positive relation between SA, PU and MUI was expected as was proved in a previous study [9].
4 Aspects of Digital Factors – DL and ST
The analysis of the entire xTAM model proved that the digital factors (IT, DL, ST, SA) had a higher influencing effect on MUI, PE and PU than the human factors (ANX, SF). Furthermore, the analysis has shown that there is a direct relationship between these factors as well. Therefore, the separate analysis of the digital factors is justified. The following chapter highlights some aspects of the two digital factors, namely, Digital Learning (DL) and Smart Tools (ST) in terms of the behavior and preference of students in the Hungarian environment.
The classification of the students based on IT Security Awareness and the detailed analysis of the factor IT security awareness was conducted in [4] and [10]. The classification in [4] and [10] showed that students of the early Z generation in higher education in the Hungarian environment could be grouped into
“Negligents”, “IT aware” and “Sceptics” requiring different type of training and IT security education. A cardinal point was for students to know whom to turn to in case of hacking or any system problems.
This chapter highlights some aspects of DL and ST, exploring gender differences and clustering in case of DL and a path preference in case of ST.
4.1 Digital Learning
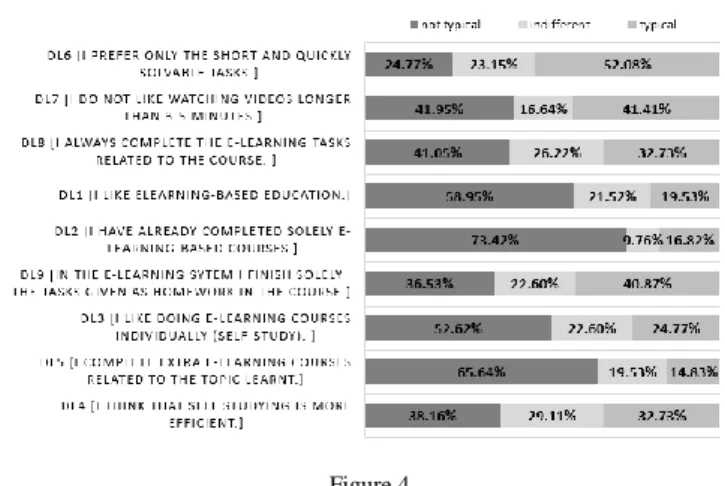
The survey originally included nine questions that dealt with digital type learning (Figure 4). In the course of factorization, some of these questions dropped out because mostly the questions related to eLearning preference had factor loadings over 0.5. However, a separate analysis of the responses focusing on the first two questions in Figure 4 was worthy of consideration. In order to represent the behavior of the students the responses, given use of the 1…7 Likert scale, they were grouped into answer categories: “non-typical”, “indifferent” and “typical”.
Figure 4 shows how students perceive digital learning and how they behave.
Figure 4
Student behavior regarding Digital Learning
The answers reveal that students of the early Z generation are not fully prepared for digital learning since 73% of them have not finished exclusively eLearning courses yet, 53% of them still do not like doing self-study eLearning courses, 66%
of them do not complete extra eLearning courses related to the topic learnt and only 33% of them think that self-paced, individual learning is more efficient. On the other hand, students participating in the research showed that they were in favor of digital learning, they bear the characteristics of digital learners, namely they like short videos and quickly solvable tasks – the basic characteristic of MOOC (Massive Open Online Courses). 52% of them like short videos and quickly solvable tasks and half of them like short educational videos, short exercises, that they can gain with their “scattered brain”. According to [11] the
members of the digital natives become shallow-brained, their brain plasticity, cognition and concentration change. Their brain becomes as fragmented as the pieces of information on the Net. The long and deep concentration on one topic ceased and students’ focus skips from one bit of information to another within a few seconds. These features appear in the course of eLearning, long videos, long texts and sequential tasks cannot engross the students’ attention [12]. Their way of studying and learning is continuously getting scattered, padded with hyperlinks.
4.1.1 Exploring Preferences by Gender
The correlation between DL questions determined their participation in the model.
In case of DL6 there seemed to be the strongest and significant relationship (r=0.306, p=.000) with DL7, which could underlie the phenomenon of the
“scattered brain” and “scattered attention” in the digital age. The analysis used DL6 as a grouping factor and DL7 as dependent because each measure showed a stronger influence in this order. Using directional and symmetric measures for concordant and discordant pairs in the data set it turns out that all the relevant measures are significant (p=0.000) and show a positive value, i.e. the pairs of answers are rather similar (Table 5).
Table 5
Directional measures of DL6 and DL7
Somer’s d Total Male Female Approx. Sign.
Symmetric .255 .235 .266 ,000
DL7 Independent, I prefer only the short
and quickly solvable tasks. Dependent .248 .230 .258 .000 DL6 Independent, I do not like watching
videos longer than 3-5 minutes.
Dependent
.262 .241 .275 .000
The symmetric Somer’s d value equals 0.255, which represents a moderate but significant relationship. The Kendall τb is also 0.255 meaning that there are more concordant, similar pairs than discordant ones. At the same time γ=0.306 which underlines that there is a moderate but significant relationship. In summary, the more students prefer short and quickly solvable tasks, the more they prefer short videos. With higher probability, students who prefer short and quickly solvable tasks, will not prefer longer than 3-5 minute-long videos to watch. Pearson’s R showed a bit stronger relationship (r=0.324). This phenomenon raises two questions, and challenges educational practices in higher education. On the one hand, it might mean that early Z generation students’ concentration on and attention to a topic for a longer time is shallow and superficial, which would hinder deep learning and completing more complex tasks. This phenomenon would support the idea stated by Carr [11] of the existence of the “scattered brain”
and “scattered attention”. On the other hand, it is a challenge not only for eLearning developments but also for lecturers in the course of face-to-face
teaching to maintain student attention and concentration for the whole lecture or seminar. Students need and require extra impulse, extra activities and “games”
during lectures and seminars, newer and newer information impulse must be inserted. A shift to a more informal e-enabled learning environment is emerging.
Gamification has become a significant trend in education, the personal ownership of small on hand smart devices with access to online learning apps require all learning-related activities at lectures and seminars to become e-enabled, boosting less tutor-led approach and creating an informal, more social atmosphere [13].
When students watch educational videos it is easy to stop it, forward and rewind it, it is easy to skip and jump on to another short video but a lecture or seminar is not hyperlinked.
The exploration of student digital learning behavior became more differentiated when splitting the responses by gender. The different behavior of male and female students became visible implying that gender could be a well separating factor. As a result, it is proved that there is a difference how male and female students turn to digital learning including e.g. MOOC. In the research 35% of the surveyed were females and 65% were males. In case of female students all the relevant association measures showed stronger relationship than without separating males and females (Somer’s dF=0.266, τbF=0.266, γF=0.318 and rF=0.310). This can strengthen the trend, that with, the same preference of short and quickly solved tasks female students are getting more and more conscious about their carrier earlier than males, they try to focus more on the content and try to be more success-oriented as well as try to fill in the time spent on learning more and more efficiently. Female students are willing to spend less time on specific educational videos. However, it might mean that male students spend more time on the same topic, deep learning is more characteristic in their case. (Figure 5)
Figure 5
Estimated marginal means of DL7 in respect of DL6 separated by gender
Figure 5 plots that the effect of DL6 on DL7 depends on gender and causes a non- ordinal and non-crossing interaction. At each but level three female students’
resistance to longer educational videos is stronger than of male students. Upon Multiway Analysis of Variance with DL6 and Gender as grouping factors and DL7 as dependent the means are higher for females. Despite the fact that using DL7 as a grouping factor and DL6 as dependent gave a non-ordinal crossing interaction, which is stronger in nature, the above order was evaluated based on figures in Table 5. Despite Levene’s test of Equality of Variance being non- significant, the results were evaluated since the Analysis of Variance is robust enough [14]. Table 6 shows that DL6 and gender significantly influence DL7 separately, but their interaction has no effect.
Table 6
Effects of the grouping factors on DL7 Tests of Between-Subjects Effects
Dependent Variable: DL7 [I do not like watching videos longer than 3-5 minutes.]
Source
Type III Sum of Squares
Df Mean
Square F Sig.
Partial Eta Squared
Corr. Model 297.827a 13 22.910 6.571 .000 .137
Intercept 5200.586 1 5200.586 1491.746 .000 .735
Gender 39.040 1 39.040 11.198 .001 .020
DL6 199.911 6 33.319 9.557 .000 .096
Gender * DL7 14.834 6 2.472 .709 .642 .008
Error 1879.084 539 3.486
Total 10969.000 553
Corr. Total 2176.911 552
a. R Squared = .137 (Adjusted R Squared = .116)
Based on partial η2 it can be stated that there are several other factors influencing DL7 since gender and DL6 explain the behavior by 2% and 9.6% respectively and the model explains only 13.7%. Other factors could be the level of digital skills, internet knowledge, cognitive behavior, different learning strategies, level of concentration etc., or even the time slot available for the actual task or video. It might occur that the skill of multitasking is also reflected in the learning behavior by gender. Figure 5 also shows a consequent positive relationship, a continuously growing curve for males as well as for females, i.e. the quicker students aim to finish the task, the shorter videos they are willing to watch.
4.1.2 Classification of Students on Digital Learning
For the classification of students regarding digital learning, correlation between the questions were evaluated first. Using the individual questions of the survey relatively weak but significant correlations were found between the individual questions regarding digital learning except DL2 (Table 7).
Table 7
Correlation of DL questions without DL2
DL6 DL7 DL8 DL1 DL9 DL3 DL5 DL4 DL6 1
DL7 .306 1 DL8 .107 .181 1 DL1 0.080 .132 .350 1 DL9 .166 .113 .127 .190 1 DL3 0.026 .102 .357 .531 .157 1 DL5 0.070 .134 .326 .430 0.063 .646 1 DL4 .136 0.054 .163 .254 .141 .343 .291 1
The correlation in case of DL2 was non-significant with all the other questions, therefore it was excluded from the entire model. The relatively weak but significant correlations of the other variables allowed a further cluster analysis so as to determine the behavioral pattern of students of the early Z generation studying in higher education. The extreme values determined by the Mahalanobis distance were excluded from the analysis as well (the sample was reduced to 403 responses). Meanwhile in case of some non-significant individual correlations the questions were left in the cluster analysis due to the importance of the question [15].
Two clustering methods were applied (Ward method and K-Means) [10, 16]
which was confirmed with discriminant analysis that suggested three separate clusters to be determined. Hierarchical and non-hierarchical methods were applied, but the K-Means cluster gave a better explanatory effect so the clusters determined by the non-hierarchical method was used for further analysis. The linear relationship among the questions proved to be significant (F-test p=0.0000).
For the graphical representation of the groups and to determine the discriminant dimensions, discriminant analysis was also carried out. Due to normal distribution and homoscedasticity problems, logistic regression was also used, however, the results were very similar thus the results of the discriminant analysis is presented in the paper.
As a result, students could be clustered into three groups based on the questions on Digital Learning and the questions proved to be good separating variables. Two discriminating functions could be determined (Eigenvalue1=1.893, Canonical Correlation1=0.809, Variance1=59.5%, Eigenvalue2=1.288, Canonical Correlation2=0.750, Variance2=40.5%). The groups significantly differ from each other along the two dimensions (Wilks’ λ1 through2=0.151, Wilks’ λ2=0.437, sig=0.000). The first dimension (DL5, DL3, DL1 and DL4) could be determined as “e-Self study exploration” and the second dimension (DL7, DL8, DL6 an DL9) as “digital minimalism”. Table 8 presents the Group Centroids, Table 9 the structure matrix with the strongest separating variable while Figure 6 displays the groups in the dimensions.
Table 8
Functions at Group Centroids of the clusters Functions at Group Centroids
Cluster Number of Case Function 1 Function 2
1 -.205 -1.566
2 1.697 .665
3 -1.663 .964
Unstandardized canonical discriminant functions evaluated at group means Table 9
Effects of the grouping factors on DL7
Structure Matrix Functions 1 2
DL5 .698* .307
DL3 .661* .320
DL1 .605* .348
DL4 .226* .037
DL7 -.214 .922*
DL8 .268 .374*
DL6 -.108 .292*
DL9 .087 .155*
*Largest absolute correlation between each variable and any discriminant function
Figure 6
Student behavior based on Digital Learning
The “hard-working ants” are willing to explore eLearning possibilities, complete extra eLearning courses and they like more complex tasks and longer educational videos. These students gain knowledge with patience and hard work. The “lazy crickets” like playing around extra courses and explore eLearning possibilities but they are not patient enough and are not hard-workers enough to complete more complex tasks and watch longer than 3-5 minute videos. The “easy riders” are the students who would like to have all the tasks finished as quickly as possible, they are not willing to add any extra effort to their studies in the digital environment.
4.2 Smart Tools
The digital factor Smart Tools was also analyzed. Smart devices become more and more popular to use for learning processes. The results imply that eLearning system software or online course developers must focus on mobile app developments, because a significant shift can be noticed from desktops and tablets to smart phone usages in case of such courses among Hungarian students in higher education. Based on the survey responses most of the students (79%) reach the eLearning system on their laptops while almost 70% use the eLearning platforms on smart phones, and surprisingly only 17% of the students use tablets for online learning. Students could mark more than one device [2].
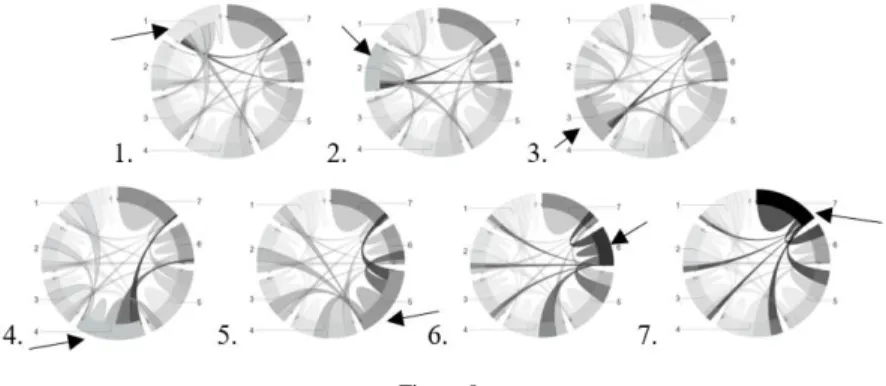
A considerable relationship could be detected among the questions on Smart Tools. Based on the answers on the use of eLearning systems on smart phones and devices (independent) there is a direct positive influence on students’ belief on mobile learning apps (dependent) in the Hungarian environment. The positive relationship supposes well designed and developed eLearning applications. In Figure 7 the direct relationship is depicted by chords, where a chord connecting to another rating means that rating have changed from one rating to another. The darkness of the chord indicates which rating is more dominate, while if a chord connects back to itself, it shows that there was no change in the rating. It can be seen that in each case there is a better rating in favor of the dependent question.
Figure 7
Influence of ‘I use eLearning type…” on “Applications on smart tools ….”
Figure 8 plots the relationship by individual rating and it can be seen that in each case the higher rating is more dominant, that is if students use eLearning systems and applications on their smart phones, presumably they experience faster learning, and they actually learn faster.
Figure 8
The direct relationship between eLearning usage on smart device and the belief of the learning speeding up with mobile applications
Consequently, mobile apps help students study more efficiently, in an individualized, flexible way, where “Third Wave, brings with it personalized, instead of universal schedules” [1]. Figure 8 also shows that there is no deterioration in the answers, in each case, the dependent variable is the more dominant, i.e. more concordant, than discordant pairs can be found.
Conclusions
This paper focused on the evaluation of an xTAM model, related to eLearning systems, with SEM using the AMOS program while highlighting the digital factors, namely IT security awareness, digital learning and smart tools including their relationship. The extended TAM model included such external variables that might have an impact on the motivation, intention to use, perceived usefulness and perceived ease of use of the eLearning systems due to a high scale digitalization and the boom of smart devices.
The newly introduced external factors, well represent the influence on the usage and motivation behavior of students in the Hungarian environment towards eLearning systems and the rate of influence of the exogenous factors on the endogenous factors in the xTAM could be well quantified.
Upon the evaluation of the xTAM, all newly introduced external factors except TE had a direct positive or negative effect on PE, PU and MUI. DL and ANX, a digital and a personal dimension, became the strongest factors. These factors proved to have a correlation with all three output factors, for instance, ANX i.e.
anxiety negatively influences the above factors, so if a student is not confident, then they will prefer not use an eLearning system.
The motivation and intention to use and the perceived usefulness of eLearning systems, do not depend on IT security awareness, which might raise some concerns, provided there are IT negligent and/or IT sceptic sources.
The paper initially analyzed the relationship of the digital factors, then, separately Dl and ST, as these factors are important in the 21st Century, when digitalization is in focus, in business, industry, as well as, in education. IT security awareness as the first digital factor rather has direct influence on the other digital factors like DL, ST and SA but does not influence the personal involvement, ANX and SF.
The motivation and intention to use, the perceived usefulness and the perceived ease of use of eLearning systems are all personal dimensions, thus it can be accepted that IT security awareness has no direct relation with them.
IT security awareness boosts DL and ST, meaning that students who are more IT security conscious, will use digital learning and will be more motivated to learn using smart tools. Furthermore, students who prefer DL and use ST realize they have to pay attention to IT security. The IT-ST significant correlation supports that the (online) eLearning systems are used in an IT security conscious way. DL and ST are also in positive correlation, which supports the phenomenon that digital natives – even the members of the early Z generation, who form a transitional generation as stated in [2], are always online, with their smart phones and other mobile devices, they even study with the help of these devices, instead of desktop computers.
Digital Learning also allowed the classification of “hard-working ants”, “lazy crickets” and “easy riders” could be identified determined by the preference of eLearning courses and extra tasks and digital minimalism. Furthermore, two questions referred to short and quickly solvable tasks and short videos, a significant difference could be detected depending on gender. The cognitive and learning processes differ by gender, males and females react differently to the digital learning process.
Consequently, it can be stated, that more attention must be paid to IT security awareness trainings and courses for the students of the Z generation within Hungarian higher education. In the course of the elaboration of the University eLearning strategy, it must be noted that these students turn more and more towards digital learning, mainly using smart tools but, at the same time, require an occasional, personal, face-to-face contact.
In summary, digitalization and the usage of smart tools can help students be more motivated to use eLearning systems and the usage of these systems, can be easier when system access is easy and the necessary developments are carried out.
References
[1] A. Toffler: The Third Wave, William Morrow and company Inc., New York 1980
[2] A. Tick: “Research on the digital learning and e-learning behavior and habits of the early Z generation“, Proceeding of 22nd IEEE International Conference on Intelligent Engineering Systems (INES) June 2018, pp. 33- 38
[3] A. Tick: “IT Security as a Special Awareness at the Analysis of the Digital/E-learning Acceptance Strategies of the Early Z Generation”, Proceedings of 22nd IEEE International Conference on Intelligent Engineering Systems (INES) June 2018, pp. 45-50
[4] A. Tick: “The role of IT security awareness in the TAM model of students’
motivation and behavioural intention to use an e-learning environment in Hungary – A structural equation modeling approach”, Hadmérnök, Vol.
XIII., No. 32, September 2018, pp. 453-471
[5] A, Tick: “The evaluation of the computer usage and learning habits of the Z generation” in Report of Meeting Researches in Didactics of Mathematics and Computer Sciences (MIDK) Vol. 16, No. 1, p. 145, January 2018 [6] F. D. Davis: “Perceived usefulness, perceived ease of use, and user
acceptance of information technology”, MIS Quarterly, Abi/Inform Global, Vol. 13, No. 3, September 1989, pp. 319-339
[7] W. W. Chin, B. Marcolun, P. R. Newsted: “A Partial Least Squares Latent Variable Modeling Approach for Measuring Interaction Effects: Results from a Monte Carlo Simulation Study and an Electronic mail Emotion/Adoption Study”, Information Systems Research. Vol. 14, No. 2, June 2003, pp. 189-217
[8] A. Kohlhofner-Derecskei, R. Zs. Reichner, Á. Szeghegyi: “The X and Y Generations’ Characteristics Comparison”, Acta Polytechnica Hungarica, Vol. 14, No. 8, 2017, pp. 107-125
[9] S. Y. Park: “An analysis of the Technology Acceptance Model in understanding university students’ behavioural intention to use e-learning”
Educational Technology & Society, Vol. 12, No. 3, 2009, pp. 150-162 [10] A. Tick: “Evaluating e-learning acceptance and usage motivation including
IT Security Awareness amid Z generation Hungarian students with xTAM”, Proceedings of IEEE 23nd International Conference on Intelligent Engineering Systems (INES) April 2019, pp. 137-142
[11] N. Carr: The Shallows: What the Internet is Doing to our Brains, W. W.
Norton & Company, Inc., New York, 2011
[12] P. Luka: “Nicolas Carr’s The Shallows. What the internet is Doing to Our Brain and some implications for Net based learning” e-learningeuropa.info, March 2011, pp. 1-4, https://www.openeducationeuropa.eu/sites/default/
files/asset/the%20shallows.pdf, retrieved: 12.03.2018
[13] Á. Szeghegyi, V. Szoboszlai, J. Velencei, “Informal Post-Experiential Learning”, in Acta Polytechnica Hungarica, 2014, Vol. 11, No. 4, pp. 241- 252
[14] L. Sajtos, A. Mitev: SPSS kutatási és adatelemzési kézikönyv, Aliena Kiadó, 2007
[15] A, Jakus, A, Tick: “IT security risks and risk management”, Hadmérnök, Vol. XII. No. 1, March 2017, pp. 182-202
[16] IBM Knowledge center, General Procedure,
https://www.ibm.com/support/knowledgecenter/en/SSLVMB_22.0.0/com.i bm.spss.statistics.algorithms/alg_cluster_procedure.htm, retrieved: 15. 01.
2018