Surrendering personal control to automation: Appalling or appealing?
Jhanghiz Syahrivar
a,b,⇑,1, Tamás Gyulavári
a, Melinda Jászberényi
a, Katalin Ásványi
a, László Kökény
a, Chairy Chairy
baInstitute of Marketing, Corvinus University of Budapest, F}ovám Tér 8, Budapest 1093, Hungary
bSchool of Business, President University, Jl. KH Dewantara, Jababeka, Bekasi 17550, Indonesia
a r t i c l e i n f o
Article history:
Received 11 September 2020
Received in revised form 14 March 2021 Accepted 30 March 2021
Keywords:
Autonomous vehicle Personal control Desire for control Locus of control Power distance Intention to use User acceptance
a b s t r a c t
There has been a growing interest in Autonomous Vehicle (AV) technology worldwide over the last decade. Nevertheless, various studies have noted some potential socio- psychological challenges to AV use and ownership. These challenges can be mitigated by designing AV that accounts for users’ personalities, such as their perceived control and power. The complex relationship between personal control and automation, two concepts that intuitively sound contradictory to each other, is less explored. In this study, two dimensions of personal control, the desire for control and the driver locus of control, were hypothesized to influence the attitude toward AV. The relationships were moderated by power distance, a cultural factor related to one’s sense of control. The hypotheses were tested using Structural Equation Modelling (SEM) approach via the Analysis of Moment Structures (AMOS) software. As many as 457 respondents from two sample groups, Hungarian and Indonesian drivers were gathered via an online questionnaire and com- pared. The results reveal that 1) the higher the desire for control, the more negative the attitude toward AV 2) the higher the external driver locus of control, the more positive the attitude toward AV 3) the more positive the attitude toward AV, the higher the inten- tion to use AV and 4) power distance moderates the relationship between the desire for control and the attitude toward AV, such that the negative effect of the desire for control is strengthened in high power distance orientation. This study also provides theoretical contributions and managerial implications, especially to AV designers.
Ó2021 The Author(s). Published by Elsevier Ltd. This is an open access article under the CC BY-NC-ND license (http://creativecommons.org/licenses/by-nc-nd/4.0/).
1. Introduction
In the last decade, Autonomous Vehicle (AV) has garnered positive receptions from the world over for its prospect to address numerous environmental as well as social problems facing contemporary societies.Allied Market Research (2019) reported that the global market value of AV in 2026 was expected to reach USD 557 billion indicating a positive trend in this industry. Moreover, various researchers have noted AV’s capacity to shape neighbourhoods and affect their economies
https://doi.org/10.1016/j.trf.2021.03.018
1369-8478/Ó2021 The Author(s). Published by Elsevier Ltd.
This is an open access article under the CC BY-NC-ND license (http://creativecommons.org/licenses/by-nc-nd/4.0/).
⇑Corresponding author at: Institute of Marketing, Corvinus University of Budapest, F}ovám Tér 8, Budapest, 1093, Hungary.
E-mail addresses:jhanghiz@uni-corvinus.hu,jhanghiz@president.ac.id(J. Syahrivar),tamas.gyulavari@uni-corvinus.hu(T. Gyulavári), jaszberenyi@
uni-corvinus.hu(M. Jászberényi), katalin.asvanyi@uni-corvinus.hu (K. Ásványi), laszlo.kokeny2@uni-corvinus.hu (L. Kökény), chairy@president.ac.id (C. Chairy).
1Permanent Address: School of Business, President University, Jl. KH Dewantara, Jababeka, Bekasi 17550, Indonesia.
Contents lists available atScienceDirect
Transportation Research Part F
j o u r n a l h o m e p a g e : w w w . e l s e v i e r . c o m / l o c a t e / t r f
(Rosenzweig & Bartl, 2015; Clements & Kockelman, 2017; Crayton & Meier, 2017). Despite the AV’s potential, various stake- holders still worry about the readiness of the market to adopt AV when they are available for the first time. Based on the 2019 Autonomous Vehicles Readiness Index released by Klynveld Peat Marwick Goerdeler orKPMG (2019), various coun- tries, such as the United Kingdom (UK), New Zealand, Canada, and Japan, have expressed their concerns on AV-related infras- tructures (both physical and digital) as well as AV regulations that would ensure public safety and privacy. Meanwhile, Ford expressed their concerns on the life span of AV, which was reported to last for four years only despite the heavy investments that backed the technology (TechCrunch, 2019).
Studies on AV have been geared toward gauging the public’s response and market readiness toward AV in the future. Typ- ically, marketing departments are responsible for collecting and channelling information on customer needs to other depart- ments dealing with new products, such as Research and Development (R&D) and manufacturing (Keszey & Biemans, 2017).
The idea is to personalize AV to suit its users hence improving their acceptance of it. While driving uniformity is paramount to safety, designing AV that can take into account users’ driving styles may improve comfortability, enjoyment as well as users’ acceptance (Hartwich, Beggiato, & Krems, 2018; Zhu, Wang & Wang, 2018).Hartwich et al. (2018)argued that tailoring the Automated Driving (AD) style to suit the individual users might minimize the perceived loss of control. In essence, to design a human-like driving experience requires inputs on users’ differences or personality traits, such as their desire for control and locus of control. Since previous studies have noted that driving is a mechanism to derive control over one’s life (Burger & Cooper, 1979; Taylor & Deane, 2000) hence the idea of surrendering one’s control to automation could be appalling to some as well as a central challenge in the adoption of AV.
The present study addresses the following questions: What factors contribute to the automation level preferences between Hungarian and Indonesian drivers? What are the roles of desire for control and locus of control, as the dimensions of personal control, in the adoption of AV among drivers? What is the role of power distance as a cultural factor in the rela- tionship between personal control and automation? One specific domain within personality theory that is less explored in the context of AV is that concerning personal control. Previous studies suggest that driving is associated with the perception of control and power (Burger & Cooper, 1979; Gardner & Abraham, 2007; Taylor & Deane, 2000) hence it is also possible that people who desire more control and power in their lives are less inclined toward using AV. A previous study byHartwich et al. (2018)also raised the issue concerning personal discomfort among AV users due to the perceived loss of control. Pre- vious studies suggest that cultural factors, such as power distance, may influence users’ attitudes toward automation (Sherman, Helmreich, & Merritt, 1997; Bing, 2004). In her systematic literature review,Keszey (2020)emphasized the need to study moderating variables that may weaken or strengthen one’s attitude toward AV. In this study, we argue that power distance moderates the relationship between personal control and the attitude toward AV.
This study aims to extend the literature on AV research by putting to rest the finding discrepancies (or lack of findings) on the relationship between personal control and automation. Owing to inconclusive evidence, it becomes paramount to under- stand human-machine relationships and how functions can be shared between humans and automation (Inagaki, 2003). In other words, the negotiation between personal control and full automation has become a central challenge in designing AV that meets the users’ needs (Merat & Lee, 2012). Secondly, we wish to compare drivers based in Europe and Asia and offer insights to AV industries targeting the two markets.
2. Literature review 2.1. Autonomous vehicle (AV)
TheInternational Society of Automation or ISA (2021; p.1)defines automation as‘‘The creation and application of technol- ogy to monitor and control the production and delivery of products and services.” The Society of Automotive Engineers or SAE further classified automation in the context of AV into six levels: 0–5 (Shuttleworth, 2019; p.1). Level 0 means that the dri- vers perform all the driving tasks; meanwhile, level 5 means that AV can perform all the driving functions under all circum- stances. Drivers have the option to take control of their vehicles if they want to. Currently, level 5 AV is unavailable. The Institute of Electrical and Electronics Engineers orIEEE (2020)reported that level 3 AV that permitted drivers to safely dis- engage from the driving tasks under limited road conditions was introduced in 2020.
Previous researchers have used different terminologies to refer to a vehicle that is partially (e.g. level 3) or fully operated (e.g. level 5) by Artificial Intelligence (AI): ‘‘automated vehicles” (Clements & Kockelman, 2017; Bellem et al., 2018; Hartwich et al., 2018), ‘‘autonomous vehicles” or AV (Merat & Lee, 2012; Yap, Correia, & Van Arem, 2016; Crayton & Meier, 2017; Liu, 2017; Woldeamanuel & Nguyen, 2018; Gandia et al., 2019) and ‘‘self-driving vehicles” or SDV (Lee & Kolodge, 2018) and other less popular terms, such as ‘‘driverless” or ‘‘intelligent” vehicles (Gandia et al., 2019).
While cars with driver assistance and partial automation features have been introduced to the market for quite some time now, fully AV is still in the testing phase (Naujoks, Purucker & Neukum, 2016). Unfortunately, it has been noted that current technology in automation is still subject to software and hardware failures (Wickens et al., 2010). Therefore, automation can be advantageous or disadvantageous to human performance (Onnasch et al., 2014). A study byKircher, Larsson, and Hultgren (2013)highlighted how different automation levels influenced driving tactics. During stressful situations, higher levels of automation may be more preferred by users (Sauer, Nickel, & Wastell, 2013).
2.2. Personal control
Greenberger and Strasser (1986; p. 165)defined personal control as‘‘The individual’s beliefs, at a given point in time, in his or her ability to effect a change, in a desired direction, on the environment.” The sense of personal control had socio- psychological nuance. According toRoss and Sastry (1999), the sense of personal control was influenced by social structures because of the difference in income, education, occupation, gender, race, ethnicity, etc. Typically, individuals with high income and high education have a higher perception of personal control compared to those who are poor and low educated.
Moreover, they also argued that personal control (or lack thereof) was linked to some psychological issues, such as depres- sion and anxiety.
In this study, personal control consists of the motivational element as reflected in the desire for control and the belief element as reflected in the Locus of Control (LOC).Ross and Sastry (1999)argued that Rotter’s internal locus of control was related to personal control. Meanwhile,Reich and Infurna (2017)found that desire for control was positively correlated with internal LOC but negatively correlated with external LOC. The findings on the relationship between the two concepts led the authors to conclude in their book that the desire for control and locus of control are ‘‘Two separate pieces in the personal control mosaic” (p. 48).
The desire for control is the general wish to be in charge of everyday events; individuals with a high desire for control are characterized as being assertive, decisive, and active (Burger & Cooper, 1979; Leeper Piquero, Schoepfer & Langton, 2010).
According toBurger and Cooper (1979), individuals who were high in desire for control displayed a higher belief in personal control over random chances. The desire for control is a part of personality construct and is often linked to psychological issues, such as depression and learned helplessness (Burger, 1984). Perception of control or lack of control is recognized to significantly influence stress reactions (Tsai, Eccles, & Jaeggi, 2019).
There is a relationship between the perception of control and driving activities (Burger & Cooper, 1979; Dixon et al., 2020). People may feel an enhanced perception of control when they are behind the wheels (Taylor & Deane, 2000). A pre- vious study byGardner and Abraham (2007)on commuters’ reasons for driving, concluded that desire for control under- pinned many of their motives. Therefore, it can be concluded that the act of driving symbolizes control; people may derive their perception of control or personal control through driving activities. Unfortunately, automation may diminish drivers’ perceptions of control. Therefore, we formulate the first hypothesis as follows:
H1:The desire for control has a negative effect on the attitude toward AV.
There have been substantial debates among researchers in the construct of personal control. Another concept often linked to personal control is the locus of control (Burger & Cooper, 1979; Greenberger & Strasser, 1986).Rotter (1966)developed the locus of control (LOC) scale. According to Rotter, locus of control was the extent to which a person perceived that a reward or punishment was a consequence of a person’s actions (Internal LOC) versus some complex external forces (External LOC). In other words, LOC concerns the origin of rewards and punishments in this world (Peterson & Stunkard, 1992). The measurement of LOC is generally based on one’s perception of internal control, perception of control by powerful others, and perception of events controlled by chance (Burger, 1984).Berrenberg (1987)developed a so-called Belief in Personal Control Scale (BPCS) in which one of its dimensions, the general External Control factor, was related to Rotter’s LOC (1966). However,Greenberger and Strasser (1986)argued that Rotter’s LOC was a distinct concept from personal control, an unstable personality attribute, yet the authors admitted that the first might affect the latter. Moreover,Peterson and Stunkard (1992)concluded that personal control was multidimensional in which there might be some overlaps between per- sonal control and LOC.
Previous researchers have adapted Rotter’s LOC to suit their contexts. One such instance wasÖzkan and Lajunen (2005) who developed a so-called Traffic Locus of Control (T-LOC) to predict risky driving. T-LOC generates four factors: other dri- vers, self, vehicle and environment, and fate. The scale, however, seems problematic for two reasons: first, the scale moves further away from the original concept of LOC that is either internal or external (dichotomy). Second, the scale suffers by having one factor, namely ‘‘Fate”, which only has two variables. Another attempt to adapt LOC was done byMasini et al.
(2018). The authors developed the Driving Locus of Control (DLOC) scale which generates three factors: Internal LOC (Cau- tious and Overconfident) and External LOC. They argued that Rotter’s LOC when applied to driving activities failed to gen- erate a consistent result thus a call for better measurement. In this study, DLOC is defined as the degree to which drivers perceived that an outcome of driving (e.g. safety vs road accident) was a consequence of their driving skills versus technical or non-technical factors beyond their control.
Bellem et al. (2018)argued that drivers with a high external locus of control were more accepting that they were not in control. As a consequence, they were less demanding with the AV driving styles. Meanwhile, drivers with a high internal locus of control might favour being in control of their vehicles; they might have difficulties delegating personal control to an autonomous system. Therefore, we formulate the second hypothesis as follows:
H2:The external driver locus of control has a positive effect on the attitude toward AV.
In the context of autonomous aircraft,Berberian et al. (2012)concluded in their experimental study that understanding the connection between automation and the sense of personal control was very useful for future applications. For instance,
being able to measure perceived control is vital in the evaluation of pilots’ experiences. We think this is also true to other modes of transportation such as personal cars or buses. Automation technology should ensure that passengers have a pos- itive experience hence improving their technology acceptance.
2.3. Intention to use
In the Technology Acceptance Model (TAM), the adoption of new products generally has three parts: attitude, intention, and behaviour or actual usage (Davis, Bagozzi & Warshaw, 1989).Berger (1992; p. 104)defined attitude as‘‘A global evalu- ation of an object such as a product or brand.” Attitude concerns the inner state of consumers and their evaluations toward people, objects, or events, which may affect their actions (Ruiz Ulloa & Adams, 2004). Consumer attitude refers to the capac- ity of a product or service to deliver a buying motive (Rossiter, 2014). When measuring one’s attitude, it generally results in three outcomes: positive, neutral, or negative attitudes. In this study, the attitude toward AV is defined as drivers’ overall evaluations of AV’s potential capability and performance relative to non-AV.
There is a clear relationship between attitude and behavioural intention. In the Theory of Reasoned Action (TRA), beha- vioural intention is a result of attitude and subjective norm (Ajzen & Fishbein, 1980). Since behavioural intention does not always lead to actual behaviour,Ajzen (1985)extended TRA into the Theory of Planned Behaviour (TBP) by introducing per- ceived behavioural control into the model.Davis, Bagozzi, and Warshaw (1989)developed a so-called Technology Accep- tance Model (TAM) whose foundation is TRA; according to TAM, behavioural intention is the consequence of attitude.
One of the basic ideas behind the two aforementioned models is that a positive attitude leads to increasing intention to use certain (usually innovative) products. Apart from the three theories, Prospect Theory explains that certain purchases are driven by the evaluations of gains and losses whereby the latter can be more important than the former (Dörnyei &
Gyulavári, 2016; Kahneman & Tversky, 2013). In the context of AV, drivers may evaluate what they gain or lose from shifting toward AV (Rahimi, Azimi, & Jin, 2020). It should be evident by now that a certain degree of personal control will be given up when riding in an AV and this experience, in turn, forming their attitudes toward AV. According toPayre, Cestac and Delhomme (2014), research concerning AV must take into account the attitude toward AV as it is the predictor of the inten- tion to use AV in the future. Moreover,Yap et al. (2016)concluded in their research that the attitudes regarding certain aspects of AV, such as its trustworthiness, played an important role in the attractiveness of AV. In this study, the intention to use AV is defined as drivers’ readiness to shift to AV as a primary mode of transportation. We formulate the third hypoth- esis as follows:
H3:The attitude toward AV has a positive effect on the intention to use AV.
2.4. Power distance
Cultural norms can have a significant impact on users’ dependence and attitudes on automation (Chien et al., 2015). The study conducted byYerdon et al. (2017)highlighted that attitudes toward Levels of Automation (LOA) could vary across cul- tures. The authors stated that the Japanese were unwilling to ride in an AV whereas some countries (e.g. India) expressed high levels of concerns when AV reached certain automation levels (e.g. level 3 and beyond).
According toHofstede (2001; p. 98), one of the five dimensions of culture is power distance. He defined power distance as
‘‘The extent to which the less powerful members of institutions and organizations within a country expect and accept that power is distributed unequally.” People from high power distance culture are mindful in the way they address or behave toward their elders, and the people deemed more authoritative. It is common to address one’s superiors with their names or nicknames in most Western countries such as the United States. Meanwhile, Asian countries characterized by high power distance, such as Indonesia, South Korea, China, and Japan, will perceive this behaviour as rude or disrespectful. Instead, subordinates should address their superiors or elders by using honorific titles.
There is strong evidence that high power distance improves the attitude toward automation. For instance,Sherman, Helmreich, and Merritt (1997)concluded that pilots from a high power distance culture were less critical toward automa- tion; therefore, the acceptance was higher than pilots from a low power distance culture. Similarly,Bing (2004)argued that a high power distance coupled with high uncertainty avoidance predicted a high level of acceptance for cockpit automation.
According toChien et al. (2015), people from a high power distance culture perceive automation as more authoritative hence they are quick to trust. Moreover, countries with high power distance are also collectivist countries (Minkov et al., 2017) that strongly emphasize the importance of harmonious relationships between superiors and subordinates. In this regard, automation on vehicles provides ample opportunities to realize this goal (i.e. communicating freely with one’s superior or boss while on the road).
We argue that the inconsistency of findings on the relationship between personal control and automation is because the previous studies failed to take into account the roles of cultural factors such as power distance. In this study, power distance is assumed to moderate the relationships between the desire for control and the attitude toward AV and between DLOC and the attitude toward AV. In line withChien et al. (2015), we assume that high power distance orientation or culture promotes a more positive attitude toward automation. Collectively, we formulate the fourth hypothesis as follows:
H4a:power distance moderates the relationship between the desire for control and the attitude toward AV, such that the negative effect of the desire for control is weakened in high (vs low) power distance orientation.
H4b:power distance moderates the relationship between the external driver locus of control and the attitude toward AV, such that the positive effect of the external driver locus of control is strengthened in high (vs low) power distance orientation.
3. Research methodology
This study employed purposive sampling by targeting drivers in Hungary and Indonesia, two growing car markets in each respective region (Europe vs Asia). Participation in this research was voluntary, meaning there was no fee or gift involved. In addition to having driving experiences, respondents had to state that they had stable monthly incomes to cement their posi- tion as potential AV buyers or users. We spread an online questionnaire via academic online network groups of respective countries (e.g. email groups, social media groups). A total of 457 respondents was deemed valid for further analysis. The first part of the online questionnaire attempted to profile and classify the respondents based on country of origin, gender, age, education background, driving experience and driving frequency.
Based onTable 1, The samples contain more respondents from Indonesia and slightly more male respondents who com- pleted their Higher Educations (H.E.). The majority of respondents have substantial driving experiences of between 3 and 10 years. The majority of respondents claimed that they drove almost every day. Overall, these indicators gave credibility to their responses.
The second part of the online questionnaire addressed the automation level preference (level 0–5) and driving experience.
We measured the automation level preferences of Hungarian and Indonesian group samples when acting as a driver and as a passenger. Based onTable 2, Hungarian respondents showed a higher automation level preference (e.g. level 5) when acting as passengers. Meanwhile, the opposite case occurred among Indonesian respondents where a higher automation level (e.g.
level 5) was preferred when acting as drivers. On the other hand, this seems to suggest that Indonesian respondents as ‘‘pas- sengers” feel safer on the hands of fellow drivers (55.3 percent prefer automation level below level 3). The notion that drivers want to feel that they are in charge of their vehicles seems to manifest stronger among Hungarian respondents.
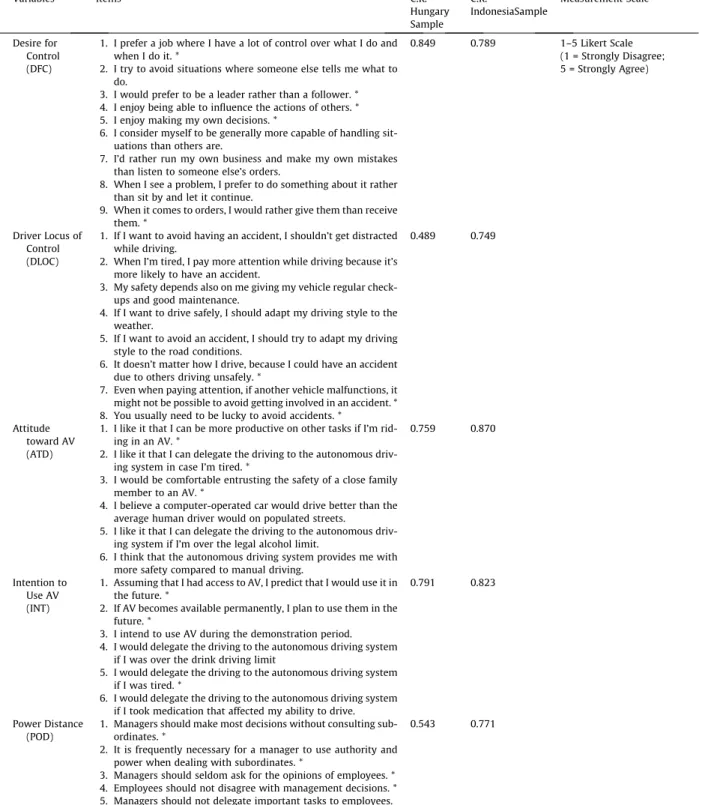
The theoretical framework of this study can be seen inFig. 1. In total, five variables are incorporated in the model: the two exogenous variables are the desire for control (DFC) and driver locus of control (DLOC); the mediating variable is the attitude toward AV (ATD); the endogenous variable is the intention to use AV (INT); and finally, the moderating variable is power distance (POD).
The third part of the online questionnaire incorporated five different measurements (seeTable 3). The respondents had to respond to a 34 item-questionnaire using a 5-Likert scale. The desire for control scale was adapted from the work ofBurger and Cooper (1979); the driver locus of control (DLOC) scale was adapted from the scale developed byMasini et al. (2018); the attitude toward AV scale was adopted from the work ofYap et al. (2016); the intention to use AV scale was adapted from the work ofMadigan et al. (2017) and Payre et al. (2014); lastly, the power distance scale was adopted from the work of Robertson and Hoffman (2000). The hypotheses were tested using Structural Equation Modelling (SEM) approach via the Analysis of Moment Structures (AMOS) software. In deciding the fitness of the SEM model, we used the work ofSchreiber et al. (2006)as the main guideline.
4. Findings
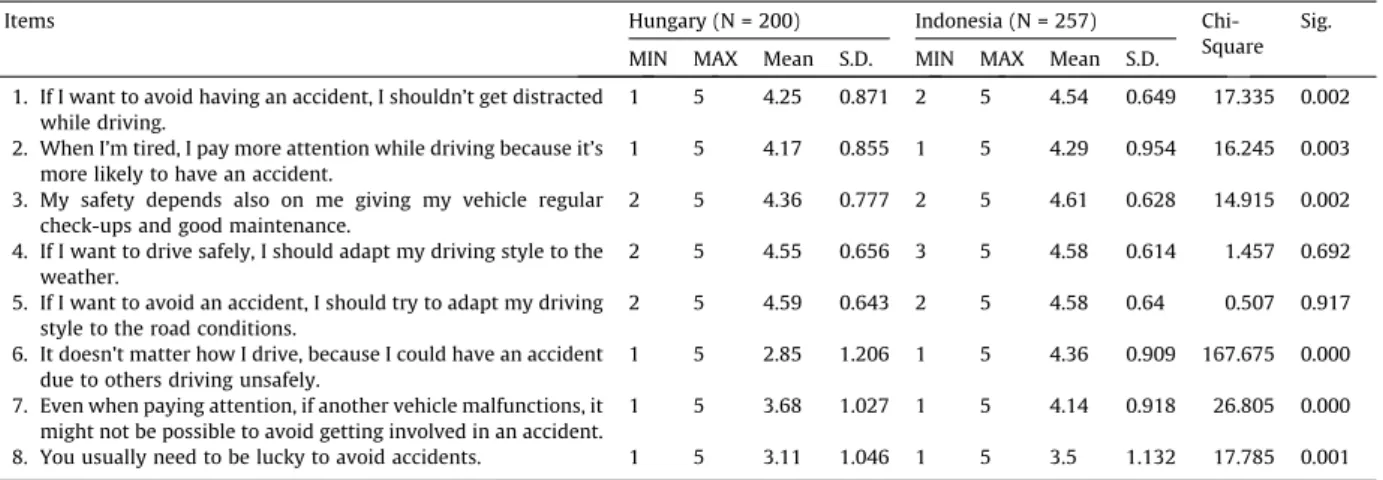
Table 4shows that, on average, Hungarian respondents chose a slightly higher automation level than Indonesian respon- dents. The results also indicate a discrepancy in automation level preferences between drivers and passengers. The automa- tion level preferences in Hungarian respondents are higher when acting as passengers. Meanwhile, the automation level preferences in Indonesian respondents are slightly higher when acting as drivers. The Chi-square tests, however, show that only the differences in Passenger Automation Level are due to country factors.
We also analysed if automation level preferences were correlated to the driving frequency and experience.Table 5shows that the negative correlations occur between driver automation level preference, driving frequency and driving experience in the context of Hungarian respondents. The higher the driving frequency and the driving experience, the lower the automa- tion level preference.
Table 6compares the desire for control between Hungarian and Indonesian respondents. The results suggest that Indone- sian respondents exhibit a higher desire for control than Hungarian respondents. The Chi-square tests show that the differ- ences in the desire for control are due to the country of origin factor.
Table 7compares the external DLOC between Hungarian and Indonesian respondents. The results suggest that Indonesian respondents exhibit a higher external DLOC than Hungarian respondents. The Chi-square tests show that the differences are due to the country of origin factor, except for item 4 and 5.
Table 8compares the attitude toward AV between Hungarian and Indonesian respondents. The results suggest that Indonesian respondents exhibit a more favourable attitude toward AV than Hungarian respondents. The Chi-square tests show that the differences in the attitude toward AV are due to the country of origin factor, except for item 4 and 5.
Table 1
The respondent profile analysis of Hungarian and Indonesian respondents (N = number of respondents).
N Percent (%)
Country of Origin Hungary 200 0.44
Indonesia 257 0.56
Gender Male 231 50.5
Female 226 49.5
Age 18–39 (Young Adults) 272 59.5
40–59 (Middle-age Adults) 157 34.4
60 (Old Adults) 28 6.1
Education Background With University/College Degree 386 84.5
Without University/College Degree 71 15.5
Driving Experience 2 years or less 75 16.4
3–10 years 192 42
>10 years 190 41.6
Driving Frequency Currently almost never 82 17.9
Seldom / occasionally 65 14.2
At least once a month 50 10.9
At least once a week 102 22.3
Almost every day 158 34.6
Table 2
The comparison results of Automation Level Preference between Hungarian and Indonesian respondents.
Country of Origin Automation Level As a Driver As a Passenger
Frequency Percent Frequency Percent
Hungary 0 4 2.0 4 2.0
1 39 19.5 30 15.0
2 35 17.5 26 13.0
3 25 12.5 25 12.5
4 36 18.0 39 19.5
5 61 30.5 76 38.0
Total 200 100.0 200 100.0
Indonesia 0 14 5.4 11 4.3
1 57 22.2 49 19.1
2 55 21.4 82 31.9
3 28 10.9 20 7.8
4 42 16.3 44 17.1
5 61 23.7 51 19.8
Total 257 100.0 257 100.0
Fig. 1.The theoretical framework of this study highlights the relationship between personal control and automation as well as the role of power distance as a moderator.
Table 9compares the intention to use AV between Hungarian and Indonesian respondents. The results suggest that Indonesian respondents exhibit a higher intention to use AV than Hungarian respondents. The Chi-square tests show that the differences in the intention to use AV are due to the country of origin factor.
Table 3
The measurement of each variable.
Variables Items C.R.
Hungary Sample
C.R.
IndonesiaSample
Measurement Scale
Desire for Control (DFC)
1. I prefer a job where I have a lot of control over what I do and when I do it. *
2. I try to avoid situations where someone else tells me what to do.
3. I would prefer to be a leader rather than a follower. * 4. I enjoy being able to influence the actions of others. * 5. I enjoy making my own decisions. *
6. I consider myself to be generally more capable of handling sit- uations than others are.
7. I’d rather run my own business and make my own mistakes than listen to someone else’s orders.
8. When I see a problem, I prefer to do something about it rather than sit by and let it continue.
9. When it comes to orders, I would rather give them than receive them. *
0.849 0.789 1–5 Likert Scale
(1 = Strongly Disagree;
5 = Strongly Agree)
Driver Locus of Control (DLOC)
1. If I want to avoid having an accident, I shouldn’t get distracted while driving.
2. When I’m tired, I pay more attention while driving because it’s more likely to have an accident.
3. My safety depends also on me giving my vehicle regular check- ups and good maintenance.
4. If I want to drive safely, I should adapt my driving style to the weather.
5. If I want to avoid an accident, I should try to adapt my driving style to the road conditions.
6. It doesn’t matter how I drive, because I could have an accident due to others driving unsafely. *
7. Even when paying attention, if another vehicle malfunctions, it might not be possible to avoid getting involved in an accident. * 8. You usually need to be lucky to avoid accidents. *
0.489 0.749
Attitude toward AV (ATD)
1. I like it that I can be more productive on other tasks if I’m rid- ing in an AV. *
2. I like it that I can delegate the driving to the autonomous driv- ing system in case I’m tired. *
3. I would be comfortable entrusting the safety of a close family member to an AV. *
4. I believe a computer-operated car would drive better than the average human driver would on populated streets.
5. I like it that I can delegate the driving to the autonomous driv- ing system if I’m over the legal alcohol limit.
6. I think that the autonomous driving system provides me with more safety compared to manual driving.
0.759 0.870
Intention to Use AV (INT)
1. Assuming that I had access to AV, I predict that I would use it in the future. *
2. If AV becomes available permanently, I plan to use them in the future. *
3. I intend to use AV during the demonstration period.
4. I would delegate the driving to the autonomous driving system if I was over the drink driving limit
5. I would delegate the driving to the autonomous driving system if I was tired. *
6. I would delegate the driving to the autonomous driving system if I took medication that affected my ability to drive.
0.791 0.823
Power Distance (POD)
1. Managers should make most decisions without consulting sub- ordinates. *
2. It is frequently necessary for a manager to use authority and power when dealing with subordinates. *
3. Managers should seldom ask for the opinions of employees. * 4. Employees should not disagree with management decisions. * 5. Managers should not delegate important tasks to employees.
0.543 0.771
C.R. = Composite Reliability; *retained items.
Table 10compares the power distance between Hungarian and Indonesian respondents. The results suggest that Indone- sian respondents are slightly higher in power distance than Hungarian respondents. The Chi-square tests show that the dif- ferences in power distance are due to the country of origin factor, except for item 2.
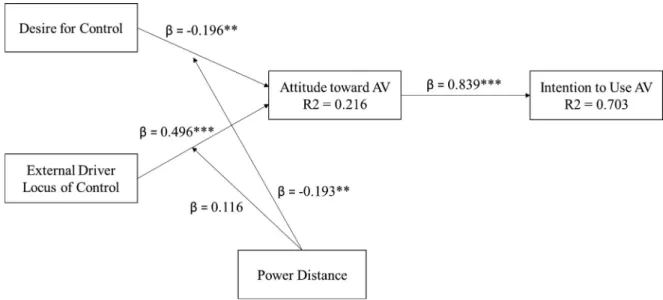
We then conducted a Confirmatory Factor Analysis (CFA) via SPSS and AMOS software. Based onFig. 2, two exogenous variables are the desire for control (DFC) and external driver locus of control (DLOC); one mediating variable that is the atti- tude toward AV (ATD); one endogenous variable that is the intention to use AV (INT); and finally, one moderating variable that is power distance (POD). The Squared Multiple Correlations (R2) value of the model suggests that 21.6 percent of the variance of the attitude toward AV can be explained by the desire for control and the external driver locus of control of the respondents. Moreover, 70.3 percent of the variance of the intention to use AV can be explained by the respondents’ atti- tudes toward AV.
Next, we assessed the fitness of the above SEM model through several indicators (fit indices) outlined bySchreiber et al.
(2006). The results are presented inTable 11. In general, our model fitness is moderate.
Table 4
The comparison results of Automation Level Preference between drivers and passengers in each country.
Country of Origin N MIN MAX Mean S.D.
Hungary Driver Automation Level Preference 200 0 5 3.17 1.588
Passenger Automation Level Preference 200 0 5 3.47 1.556
Indonesia Driver Automation Level Preference 257 0 5 2.82 1.637
Passenger Automation Level Preference 257 0 5 2.74 1.541
N = Number of respondents; MIN = Minimum; MAX = Maximum; S.D = Standard Deviation.
Table 5
The correlations between Automation Level Preference and driving frequency and experience.
Country of Origin Driving Frequency Driving Experience
Spearman’s rho Hungary Driver Automation Level Preference Correlation Coefficient 0.229** 0.295**
Sig. (2-tailed) 0.001 0.000
N 200 200
Passenger Automation Level Preference Correlation Coefficient 0.024 0.060
Sig. (2-tailed) 0.740 0.396
N 200 200
Indonesia Driver Automation Level Preference Correlation Coefficient 0.104 0.034
Sig. (2-tailed) 0.095 0.583
N 257 257
Passenger Automation Level Preference Correlation Coefficient 0.012 0.115
Sig. (2-tailed) 0.845 0.067
N 257 257
Sig. = Significance Level; ** = P0.01.
Table 6
The comparison results of desire for control between Hungarian and Indonesian respondents.
Items Hungary (N = 200) Indonesia (N = 257) Chi-
Square Sig.
MIN MAX Mean S.D. MIN MAX Mean S.D.
1. I prefer a job where I have a lot of control over what I do and when I do it.
2 5 4 0.946 1 5 4.17 0.767 14.674 0.005
2. I try to avoid situations where someone else tells me what to do.
1 5 3.31 0.993 1 5 3.51 1.008 13.089 0.011
3. I would prefer to be a leader rather than a follower. 2 5 3.72 0.932 2 5 4.05 0.833 20.934 0.000 4. I enjoy being able to influence the actions of others. 1 5 3.6 0.977 2 5 4.04 0.782 30.33 0.000
5. I enjoy making my own decisions. 2 5 4.28 0.814 1 5 4.2 0.763 10.673 0.030
6. I consider myself to be generally more capable of handling sit- uations than others are.
2 5 3.59 0.876 1 5 3.64 0.878 9.578 0.048
7. I’d rather run my own business and make my own mistakes than listen to someone else’s orders.
1 5 3.31 1.067 1 5 3.48 1.004 7.848 0.097
8. When I see a problem, I prefer to do something about it rather than sit by and let it continue.
2 5 4.29 0.773 1 5 4.28 0.781 17.366 0.002
9. When it comes to orders, I would rather give them than receive them.
1 5 3.58 0.894 1 5 3.67 0.885 12.659 0.013
N = Number of respondents; MIN = Minimum; MAX = Maximum; S.D = Standard Deviation; Sig. = Significance Level.
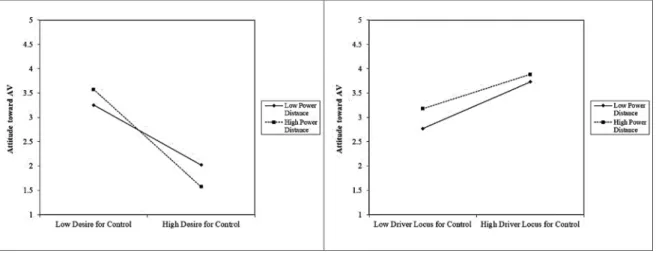
Table 12presents the regressions analysis among the exogenous and endogenous variables incorporated in this study. In addition to testing the direct effects in the model, we also investigated the moderation effects of power distance (MPODxDFC and MPODxDLOC). The results confirm H1, H2, H3, and H4a. Meanwhile, we do not have sufficient evidence to support H4b.
The graphical representation of the moderation effect of power distance on the relationship between the desire for con- trol and the attitude toward AV (H4a) and on the relationship between the external driver locus of control and the attitude toward AV (H4b) can be seen inFig. 3. The two downward lines (left) show that the relationship is negative; whereas, the Table 7
The comparison results of Driving Locus of Control between Hungarian and Indonesian respondents.
Items Hungary (N = 200) Indonesia (N = 257) Chi-
Square Sig.
MIN MAX Mean S.D. MIN MAX Mean S.D.
1. If I want to avoid having an accident, I shouldn’t get distracted while driving.
1 5 4.25 0.871 2 5 4.54 0.649 17.335 0.002
2. When I’m tired, I pay more attention while driving because it’s more likely to have an accident.
1 5 4.17 0.855 1 5 4.29 0.954 16.245 0.003
3. My safety depends also on me giving my vehicle regular check-ups and good maintenance.
2 5 4.36 0.777 2 5 4.61 0.628 14.915 0.002
4. If I want to drive safely, I should adapt my driving style to the weather.
2 5 4.55 0.656 3 5 4.58 0.614 1.457 0.692
5. If I want to avoid an accident, I should try to adapt my driving style to the road conditions.
2 5 4.59 0.643 2 5 4.58 0.64 0.507 0.917
6. It doesn’t matter how I drive, because I could have an accident due to others driving unsafely.
1 5 2.85 1.206 1 5 4.36 0.909 167.675 0.000
7. Even when paying attention, if another vehicle malfunctions, it might not be possible to avoid getting involved in an accident.
1 5 3.68 1.027 1 5 4.14 0.918 26.805 0.000
8. You usually need to be lucky to avoid accidents. 1 5 3.11 1.046 1 5 3.5 1.132 17.785 0.001
N = Number of respondents; MIN = Minimum; MAX = Maximum; S.D = Standard Deviation; Sig. = Significance Level.
Table 8
The comparison results of the attitudes toward AV between Hungarian and Indonesian respondents.
Items Hungary (N = 200) Indonesia (N = 257) Chi-
Square Sig.
MIN MAX Mean S.D. MIN MAX Mean S.D.
1. I would like it that I could be more productive on other tasks if I were riding in an AV.
1 5 3.25 1.172 1 5 4.07 0.899 74.029 0.000
2. I would like it if I could delegate the driving to the autonomous driving system in case I were tired.
1 5 3.87 0.939 1 5 4.14 0.947 16.633 0.002
3. I would be comfortable entrusting the safety of a close family member to an AV
1 5 3.19 1.082 1 5 3.33 1.073 11.112 0.025
4. I believe a computer-operated car would drive better than the average human driver would on populated streets.
1 5 3.31 1.117 1 5 3.29 1.07 4.331 0.363
5. I would like it if I could delegate the driving to the autonomous driving system if I were sick or over the legal alcohol limit.
1 5 3.72 1.192 1 5 3.91 1.09 7.032 0.134
6. I think that the autonomous driving system would provide me with more safety compared to manual driving.
1 5 3.26 1.165 1 5 3.44 0.979 10.211 0.037
AV = Autonomous Vehicle; N = Number of respondents; MIN = Minimum; MAX = Maximum; S.D = Standard Deviation; Sig. = Significance Level.
Table 9
The comparison results of the intention to use AV between Hungarian and Indonesian respondents.
Items Hungary (N = 200) Indonesia (N = 257) Chi-
Square Sig.
MIN MAX Mean S.D. MIN MAX Mean S.D.
1. Assuming that I had access to AV, I predict that I would use it in the future.
1 5 3.63 0.994 1 5 4.05 0.832 27.131 0.000
2. If AV becomes available permanently, I plan to use it in the future.
1 5 3.49 1.089 1 5 4.01 0.899 32.359 0.000
3. I intend to use AV during the trial or demonstration period. 1 5 2.51 1.169 1 5 3.39 1.21 59.202 0.000 4. If driving was boring to me, I intend to shift to AV instead of
driving by myself.
1 5 3.17 1.255 1 5 3.86 1.012 46.984 0.000
5. If one day becomes available, I plan to use the AV on the high- way rather than driving by myself.
1 5 3.54 1.251 1 5 3.88 1.031 14.987 0.005
AV = Autonomous Vehicle; N = Number of respondents; MIN = Minimum; MAX = Maximum; S.D = Standard Deviation; Sig. = Significance Level.
Table 10
The comparison results of power distance between Hungarian and Indonesian respondents.
Items Hungary (N = 200) Indonesia (N = 257) Chi-
Square Sig.
MIN MAX Mean S.D. MIN MAX Mean S.D.
1. Managers should make most decisions without consulting subordinates.
1 5 2.3 1.05 1 5 2.87 1.109 35.992 0.000
2. It is frequently necessary for a manager to use authority and power when dealing with subordinates.
1 5 3.09 0.963 1 5 3.14 1.04 3.801 0.434
3. Managers should seldom ask for the opinions of employees. 1 5 3.12 1.246 1 5 2.3 1.022 75.027 0.000 4. Employees should not disagree with management decisions. 1 5 2.43 1.02 1 5 2.59 1.17 9.611 0.048 5. Managers should not delegate important tasks to employees. 1 5 2.36 1.041 1 5 2.72 1.212 14.024 0.007 N = Number of respondents; MIN = Minimum; MAX = Maximum; S.D = Standard Deviation; Sig. = Significance Level.
Fig. 2.The final SEM Model (b= the standardized beta, ** = P (sig.) < 0.01, *** = P (sig.) < 0.001).
Table 11
The fit indices and results of the final SEM Model.
Fit Index Recommended Thresholds Results Notes
RMSEA <0.08 0.057 Good Fit
SRMR <0.08 0.051 Good Fit
GFI >0.95 0.922 Moderate Fit
NFI >0.95 0.870 Moderate Fit
TLI >0.95 0.902 Moderate Fit
CFI >0.95 0.919 Moderate Fit
RMSEA = Root Mean Squared Error of Approximation; SRMR = Standardized Root Mean Square Residual; GFI = Goodness of Fit; NFI = Normed Fit Index;
TLI = Tucker Lewis index; CFI = Comparative Fit Index.
Table 12
The effects between variables included in the final SEM Model.
Estimate S.E. C.R. P
ATD <— DFC 0.368 0.130 2.820 0.005
ATD <— DLOC 0.475 0.082 5.784 ***
ATD <— POD 0.129 0.072 1.796 0.073
ATD <— MPODxDFC 0.146 0.045 3.279 0.001
ATD <— MPODxDLOC 0.097 0.051 1.899 0.058
INT <— ATD 0.769 0.057 13.518 ***
ATD = Attitude; DFC = Desire for Control; DLOC = Driver Locus of Control; POD = Power Distance); MPOD = Mediating Effect of Power Distance;
INT = Intention to Use; S.E. = Standard Error; C.R. = Composite Reliability; P = Significance Level; *** = P0.001.
two upward lines (right) show that the relationship is positive. Moreover, the intersecting lines (left) show that the moder- ation effect of power distance is significant.
5. Discussion
The descriptive analysis suggests that Indonesian respondents have more positive attitudes toward AV than Hungarian respondents. Indonesian respondents also have a higher intention to use AV as an alternative transportation mode. Despite having a more positive attitude and a higher intention to use AV, Indonesian respondents prefer a lower level of automation than Hungarian respondents. The results also indicate different automation level preferences between the drivers and the passengers. The results suggest that Indonesian respondents show a higher desire for control and a higher external LOC than Hungarian respondents. Culturally, Indonesian respondents have a higher power distance orientation than Hungarian respondents. The results of this study confirm that the desire for control is a negative predictor of the attitude toward AV (H1); drivers who exhibit a higher desire for control (i.e. to influence other behaviours or to be fully in charge of everyday situations) tend to view AV negatively. We argue that automation diminishes drivers’ perceptions of control. The empirical findings give a weight of evidence to the previous study byLee and Kolodge (2018).
The results of this study confirm that the external driver locus of control (DLOC) is a positive predictor of the attitude toward AV (H2); drivers with high external DLOC tend to view AV more favourably. We argue that drivers with a high exter- nal locus of control might be more accepting of the fact that they were not in control hence are more welcome toward AV as an alternative transportation mode. The empirical findings give a weight of evidence to the previous study byBellem et al.
(2018).
The results of this study confirm that the attitude toward AV is a positive predictor of the intention to use AV (H3); drivers who have positive attitudes toward AV also exhibit higher intention to use AV in the future. The empirical findings give a weight of evidence to the previous studies such asPayre et al. (2014) and Rahimi et al. (2020). The AV Acceptance Meta- framework byKeszey (2020)shows that the attitudes toward AV and driving are predictors of behavioural intention to use AV.
Finally, the results of this study partially confirm the role of power distance as a moderating variable in the relationship between the desire for control and the attitude toward AV (H4a). While the moderation effect is confirmed, the nature of its effect is incorrectly predicted. Previous studies suggest that people from countries with a high power distance orientation are less critical toward automation; they view automation as more authoritative thus improving acceptance and trust (Sherman et al., 1997; Bing, 2004; Chien et al., 2015). However, the moderation analysis suggests the opposite: high power distance orientation strengthen the negative effect of the desire for control on the attitude toward AV. Our power distance scale concerns the interactions between managers and non-managerial employees. We argue that depending on which side the drivers are (manager vs non-managerial employee), it may strengthen or weaken the effect. We suggest that this mod- eration effect is retested in future research, taking into account the drivers’ occupations or organizational roles. Meanwhile, this study cannot support the role of power distance as a moderating variable in the relationship between the external DLOC and the attitude toward AV (H4b). The significance value of this moderation effect is only marginally significant (slightly above 0.05) hence we recommend retesting this relationship in future research.
We can think of several theoretical contributions: first, our study provides a theoretical construct and new empirical evi- dence regarding the role of personal control on the attitude toward AV. There is sufficient evidence to support the idea that people who enjoy driving and see driving activities as a mechanism to derive control over their lives would see automation on vehicles in a negative light as it detracts them from their perceived sense of control. Second, our study provides new
Fig. 3.The moderation effects of power distance.
empirical evidence about the role of power distance on the attitude toward AV. Power distance as a cultural factor may par- tially explain the discrepancy of findings in the relationship between the desire for control and the attitude toward AV (see Sener et al., 2019). Lastly, to our best knowledge, our research is the first to compare European with Asian drivers in the con- text of AV.
The managerial implications of the study are as follows: First, the findings suggest some differences in automation level preferences between the two regions (Europe vs Asia), as well as between drivers and passengers. Factors such as driving frequency, driving experience, personal control and power distance may affect automation level preferences. The fear of los- ing control in AV may also suggest one’s perception of risk hence some discrepancies in the automation level preferences between drivers and passengers (Nishihori et al., 2020; Starkey & Charlton, 2020). In order to accelerate the adoption of AV in the future, we recommend that the findings of this research be considered and incorporated in the design and segmen- tation of the AV market. In general, the AV industries must also recognize cultural factors and individual differences. Second, the research findings suggest that Asian drivers are higher in personal control than European drivers. We argue that finding the right balance between personal control and automation will be the key to the future success of AV.
6. Conclusion
This study has highlighted the role of personal control (desire for control and locus of control) in the attitude toward AV.
Cultural factors, such as power distance, also play a role in the social acceptance toward AV and automation in general. As there are more and more studies on AV, both as private and public transportations, we think that cultural factors that shape customers’ attitudes are often neglected, perhaps because cultural factors are often seen as non-controllable factors. There- fore, this study calls for a future research agenda that specifically discusses the role of personal control as a psychological construct as well as the culture that revolves around it as the determinant factors in the success of AV adoption in the future.
Moreover, Asian countries, such as Indonesia, have become a lucrative market for vehicles from the West hence we think that cross-examining the attitudes and cultures of Europeans and Asians in the context of driving and automation would be ben- eficial in understanding the future implications of AV.
The present study limits itself to drivers based in Hungary and Indonesia, two growing markets for vehicles in their respective regions. Future research may also compare drivers with non-drivers or those with zero driving experience to affirm whether the need to be in charge while using an AV is weakened or strengthened due to prior driving experience.
Secondly, this study employed a specific type of locus of control which is the external driving locus of control. Future research can also assess the general locus of control of drivers. Dividing the respondents into two groups, those who lean toward internal Locus of Control (LOC) and those who lean toward external LOC, might reveal some interesting results.
Thirdly, in response to previous studies that called for investigations on the moderation effects of cultural factors (e.g.
Keszey, 2020), this study emphasizes the role of power distance as a cultural factor that is highly relevant in the context of power and control in automation. Other cultural factors (e.g. ‘‘masculinity vs femininity”), where the notion of power and control may manifest, can be incorporated in future research. Lastly, this study limits itself to behavioural intention to use AV. Future studies may investigate the actual use or purchase of AV.
CRediT authorship contribution statement
Jhanghiz Syahrivar:Conceptualization, Methodology, Writing - original draft.Tamás Gyulavári:Writing - review & edit- ing, Data curation, Investigation.Melinda Jászberényi: Funding acquisition, Supervision, Project administration.Katalin Ásványi:Writing - review & editing, Validation.László Kökény:Writing - review & editing, Visualization.Chairy Chairy:
Writing - review & editing, Investigation.
Acknowledgements
Funding: This work was supported by the National Research, Development and Innovation Fund of Hungary financed under the ‘Tématerületi Kiválósági Program’ funding scheme [NKFIH-869-10/2019]
References
Ajzen, I., & Fishbein, M. (1980).Understanding Attitudes and Predicting Social Behavior. Englewood Cliffs, NJ: Prentice-Hall.
Ajzen, I. (1985). From Intentions to Actions: A Theory of Planned Behavior. InAction control(pp. 11–39). Berlin, Heidelberg: Springer.https://doi.org/
10.1007/978-3-642-69746-3_2.
Allied Market Research. (2019). Autonomous Vehicle Market Outlook – 2026. Retrieved from:https://www.alliedmarketresearch.com/autonomous-vehicle- market
Bellem, H., Thiel, B., Schrauf, M., & Krems, J. F. (2018). Comfort in autonomous driving: An analysis of preferences for different autonomous driving styles and their dependence on personality traits.Transportation Research Part F: Traffic Psychology and Behaviour, 55, 90–100.https://doi.org/10.1016/j.
trf.2018.02.036.
Berberian, B., Sarrazin, J. C., Le Blaye, P., & Haggard, P. (2012). Automation technology and sense of control: A window on human agency.PLoS One, 7(3).
https://doi.org/10.1371/journal.pone.0034075e34075.
Berger, I. E. (1992). The nature of attitude accessibility and attitude confidence: A triangulated experiment.Journal of Consumer Psychology, 1(2), 103–123.
https://doi.org/10.1016/S1057-7408(08)80052-6.