1
Assessing Industry 4.0 readiness: a multi-country industry level analysis
Krisztina Demeter (krisztina.demeter@uni-corvinus.hu)
Department of Logistics and Supply Chain Management, Corvinus University of Budapest
Dávid Losonci
Department of Logistics and Supply Chain Management, Corvinus University of Budapest
Béla Gergely Rácz Babeș-Bolyai University
Faculty of Economics and Business Administration
Department of Economics and Business Administration in Hungarian Language Romania
Levente Szász Babeș-Bolyai University
Faculty of Economics and Business Administration
Department of Economics and Business Administration in Hungarian Language Romania
Abstract
Recently digital solutions and novel industrial technologies started to become widespread in manufacturing. There are many different approaches to assess the so called Industry 4.0 transition of national economies (macro) and of individual companies (micro) as well.
Our paper elaborates a framework that enables the assessment of Industry 4.0 at sector (meso) level. Relying on the proposed methodology we compare the (evolution of) Industry 4.0 readiness of four manufacturing sectors in EU28. We conclude that the aggregated sector of computer and vehicle manufacturing is the most advanced in I4.0. A deeper analysis of this sector has revealed that countries with top starting performance in the transition in 2014 (SWE, DE, AT) have presented the greatest progress between 2014- 2017. While there are expectations that I4.0 could strengthen the relative importance of manufacturing in terms of value added, we did not find evidence for it.
Keywords: Digitalisation, Industry 4.0, Sector
Introduction
In the last couple of years digitalisation has transformed the way how companies operate.
Among others digitalisation includes the appearance of Industry 4.0 (I4.0) solutions in
2
manufacturing (Lasi, et al., 2014) (Valenduc & Vendramin, 2016). The emergence of the Industry 4.0 concept clearly shows that development and adoption of digital tools has reached a critical mass in manufacturing context. The I4.0 concept refers to a collection of technologies and methods of value chain organization that involves intelligent and smart products and production processes creating a manufacturing environment in which all participants are interconnected and share information with each other (Schlechtendahl, et al., 2015) (Brettel, et al., 2014).
Irrespective of the exact set of I4.0 solutions to be implemented by a manufacturing company, certain digital technologies need to be in place for a successful implementation.
Furthermore, beside technology, the most important barriers of implementation are related to human resources, including the skills of employees to understand and use the most recent digital solutions (Goran, et al., 2017).
Beside successful micro level adjustment to I4.0 there is a need to facilitate changes at meso level (i.e., sector) and macro level (i.e., country) as well. This paper aims to investigate the meso level. Our purpose is to assess the technological prerequisites of I4.0 adoption in some manufacturing sectors in EU countries, thereby showing which sectors and which countries show the most advanced and effective progression in I4.0 implementation.
Industry 4.0 in the digital economy The principles of digital economy
Digitalisation pervades the economy and requires rethinking of operations in almost every industries. Concepts accompanying the digital transition clearly differ in their novelty, and their impact has changed considerably over time as well. According to Valenduc and Vendramin (2016) there are some well-known concepts that have already existed for years. However, these older concepts are getting more powerful and play a changing role recently. These are complemented with emerging concepts that bring novel manufacturing solutions. Valenduc and Vendramin (2016) differentiated several principles of the digital economy:
1. Due to recent developments, data management and processing information have become a strategic resource.
2. Economy and society are based on networks and they are managed on this level.
3. The principle of growing returns (due to positive network externalities) prevails with zero or quasi-zero marginal costs.
4. New business models (e.g. sharing economy based models) and new business dynamics (the winner takes all) gain space.
5. There is a new model of industrial production (Industry 4.0), with customized/small batch products, fragmentation of global value chains, networks of productive capacities (including the blurring boundaries between producers and consumers, or between manufacturers and services providers).
6. The drastic reduction of technology prices (both hardware and software) in parallel with the significant increase in performance and efficiency restructure investment decisions.
Many of these principles have shaped management’s and OM’s interests in the last decades and increasingly in the last few years. Management of production networks have gained special interest due to the expansion of large multinational companies and global value chains (2nd and 5th principles). Furthermore, the involvement of buyers/suppliers and deeper cooperation with them pushed OM to rethink the boundaries of the organisation (e.g., supply chains) and to mix services and products to a greater extent (e.g., servitization) (5th principle). Additionally, the development of software and
3
hardware (1st and 6th principles) offers new opportunities to manage both external (i.e., value chain, customer requests) and internal processes for manufacturing companies.
The toolset of Industry 4.0
Current literature includes several different approaches on the technologies and solutions that collectively form Industry 4.0. For example, a recent study by McKinsey & Co (Goran, et al., 2017) investigates the usage of ten Industry 4.0 tools: digital quality management, digital performance management, statistical process control, remote monitoring and control, real-time yield optimization, predictive maintenance, smart energy consumption, real-time supply chain optimization, human-robot collaboration, and 3D printing. Referring to the automotive industry, Huber (2016) adds the following elements to the list: digital factory, cyber-physical systems (CPS), big data, cloud computing, RFID, portable devices, IT security. Schwab (2016) classifies these diverse set of Industry 4.0 tools into digital (e.g., big data, simulation, cloud) and physical (e.g., additive manufacturing, robots) groups.
Assessments and impact of digital transformation – macro, meso and micro level There are so called I4.0 readiness indices and maturity models available, all of them comparing either countries (macro level) or companies (company level) (see (Viharos, et al., 2017). One of the most well-known indicators is the Digital Economy and Society Index (DESI), prepared by the European Commission to measure progress towards the digital economy and society in EU countries. DESI is built of five principal dimensions with different weights (connectivity – 25%, digital skills – 25%, use of internet – 15%, integration of digital technology – 20%, digital public services – 15%). Each dimension consists of sub-dimensions (12 altogether), and subdimensions consist of indicators (31 altogether). Indicators are collected regularly, ideally on a yearly basis. Collected indicators are normalized. Based on the collected database, assessments on country and dimension/sub-dimension/indicator level can be made. In DESI 2017 the most advanced digitized EU economies are Denmark, Finland, Sweden and Netherlands, while the lowest scores are achieved by Romania, Bulgaria, Greece and Italy. The highest progress was measured in Slovakia and Slovenia (DESI, 2017). For our purposes some company related indicators from the dimensions of digital skills and the integration of digital technology are the most relevant as detailed in Table 2. For these indicators the European Commission makes aggregated sector level data available. Each indicator shows what ratio of companies with at least 10 employees in the selected sector in the given country meet the predetermined requirements.
While DESI considers both general digital infrastructure, as well as public service environment and people skills, Roland Berger (RB) also created a readiness index for I4.0 focusing on business perspective. Their index, resonating clearly with the World Economic Forum’s Global Competitiveness Index, is calculated as follows: first they bundled production process sophistication, degree of automation, workforce readiness and innovation intensity into a category called “industrial excellence”. Then they combined high value added, industry openness, innovation network and internet sophistication into a category labelled “value network”. Each category was measured using a 5-point scale, with “5” indicating that a country is excellently prepared for the I4.0 landscape. The combination of these two categories determines a country's position in the RB 4.0 Readiness Index. Using this index, both in 2014 and 2015, Germany, Finland and Belgium were ahead, while Bulgaria, Poland and Croatia lagged behind (Blanchet, et al., 2014) (Viharos, et al., 2017). RB combined their readiness index with the weight of the manufacturing sector within GDP and created four groups of countries
4
along the two dimensions: hesitators, traditionalists, potentialists, frontrunners (Blanchet et al, 2014).
At company level, there are maturity models created e.g. by Capgemini, a consulting company, or survey-based researches carried out by organizations such as the Fraunhofer Institute or VDMA (Viharos, et al., 2017). These models consider strategic and human issues besides how smart production process, factory, products, services, or IT itself is.
We did not find any model or index measuring the meso level, that is the industry/sector level readiness of I4.0. This stands in the focus of our paper.
Research questions
By analysing the recent trends in manufacturing sectors our study focuses on three research questions:
RQ1: Are there any differences in digitalisation among manufacturing sectors in Europe?
RQ2: Are there differences among countries in I4.0 adaption at sector level?
RQ3: Does progress in I4.0 in a particular sector lead to their higher share of value added?
We will answer these RQs by relying on descriptive statistics. We believe that our methodological approach gives the first valid answers for these dilemmas. However, we also acknowledge that future work is essential. To stick to the page limits the RQs will be analysed on different subsets of our datasets.
Methodology – a sector level approach
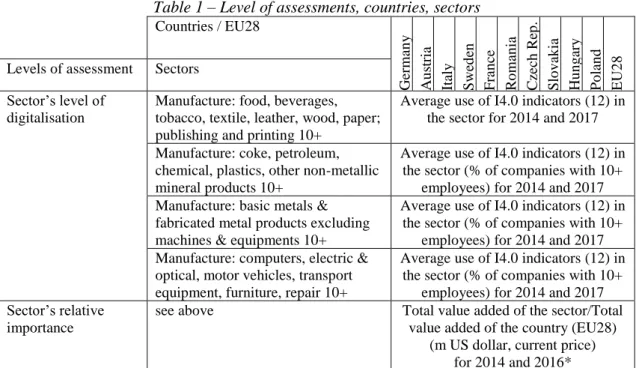
We combine secondary data to assess (1) the level of digitalisation and (2) the relative importance of each sector involved in our analysis. To provide an international outlook we have chosen 10 countries, and aggregated EU28 data as well. Data are available for four manufacturing sectors to assess their level of digitalisation. Further assessments (relative importance) were organized according to this list of sectors. Details on levels of assessments, countries and selected sectors are shown in Table 1.
Table 1 – Level of assessments, countries, sectors Countries / EU28
Germany Austria Italy Sweden France Romania Czech Rep. Slovakia Hungary Poland EU28
Levels of assessment Sectors Sector’s level of
digitalisation
Manufacture: food, beverages, tobacco, textile, leather, wood, paper;
publishing and printing 10+
Average use of I4.0 indicators (12) in the sector for 2014 and 2017 Manufacture: coke, petroleum,
chemical, plastics, other non-metallic mineral products 10+
Average use of I4.0 indicators (12) in the sector (% of companies with 10+
employees) for 2014 and 2017 Manufacture: basic metals &
fabricated metal products excluding machines & equipments 10+
Average use of I4.0 indicators (12) in the sector (% of companies with 10+
employees) for 2014 and 2017 Manufacture: computers, electric &
optical, motor vehicles, transport equipment, furniture, repair 10+
Average use of I4.0 indicators (12) in the sector (% of companies with 10+
employees) for 2014 and 2017 Sector’s relative
importance
see above Total value added of the sector/Total
value added of the country (EU28) (m US dollar, current price)
for 2014 and 2016*
* 2017 data was not yet available at the time of manuscript preparation
5
First, to measure the level of digitalisation of sectors in different countries, we use the indicators relevant to Industry 4.0 from DESI. To carry out our research we have selected 12 indicators (see Table 2). Indicators (1-5) refer to the horizontal and vertical integration of processes and organisations. Indicators (6-7) and (12) represent the technological infrastructure of digitalisation, while indicator (11) grasps the human infrastructure.
Further items are related to novel technological tools to organize employees or processes (8, 10) and to manage customers (9, 10). We analyse and compare data from 2014 and 2017. There were many missing values for these two years. Missing values were replaced on sector level in each country using the data for the given indicators from nearby years.
For example, missing value for 2017 was replaced by the value from 2016 if that was available, or missing value for 2014 was calculated as an average of values from 2013 and 2015 etc. Altogether, we did not notice any systematic pattern in missing values.
Table 2 – Indicators used to measure Industry 4.0
Indicator Sub-
dimension
Definition (1) Integration of internal
processes
eBusiness Have in use an ERP-Enterprise resource planning software package, to share information between different functional areas (e.g.
accounting, planning, production, marketing) (2) Use of analytical CRM
software
CRM refers to the use of any software application used for the analysis of information about clients for marketing purposes (3) Electronic SCM The indicator refers to sending/receiving all type of information on
the supply chain (e.g. inventory levels, production plans, forecasts, progress of delivery) via computer networks or via websites, but excluding manually typed e-mail messages
(4) Enterprise sending e- invoices
The indicator refers to sending invoices in an agreed standard format (as EDIFACT, XML, etc) which allows their automatic processing, without the individual message being manually typed
(5) Website with sophisticated functionalities
Website having at least one of the following four functionalities:
product catalogues or price lists (webacc), possibilities for visitors to customise or design the products (webctm), order tracking available online (webot) or personalised content in the website for
regular/repeated visitors (webper) (6) Employees have remote
access to the IT system
Enterprises providing persons employed a remote access to the enterprise's e-mail system, documents or applications (7) Portable devices to more
than 20% of employees
The devices (portable computers, tablets, smartphones, PDA phones, etc.) should be provided for business use and the enterprises pay for all or at least up to a limit the subscription and the use costs (8) RFID use Use for person identification, for tracking of supply chain and
inventory or for after-sales product identification (9) Enterprises using social
media
Enterprises using at least one of the following social media: social networks, enterprise's blog or microblog, multimedia content sharing websites, wiki based knowledge sharing tools
(10) Cloud computing services (any)
Purchased ICT services that have all of the following characteristics:
are delivered from servers of service providers; can be easily scaled up or down; can be used on-demand by the user without human interaction with the service provider; are paid for, either per user, by capacity used, or they are pre-paid
(11) Enterprises employing ICT specialists
ICT specialist
Employees for whom ICT is the main job. For example, to develop, operate or maintain ICT systems or applications
(12) Enterprises having a fast fixed broadband connection
Broadband take-up and coverage
The maximum contracted download speed of the fastest fixed internet connection is at least 30 Mb/s
Second, based on Eurostat data we also take into consideration the contribution of each manufacturing sector to total value added at country level. Data are calculated at current prices. Data were collected for 2014 and 2016. The data were available for each country and for each sector. Due to the time lag in the publication of international economics data the year 2016 was selected since data for 2017 are still not available.
6 Results
Differences in digitalisation among manufacturing sectors
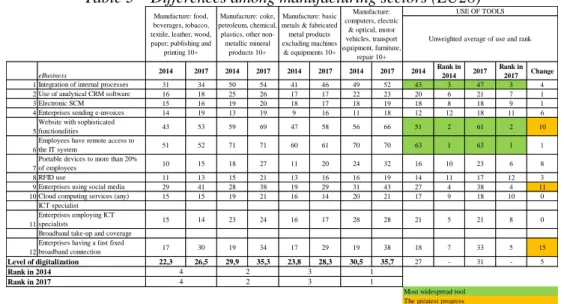
To answer RQ1 we compare the level of digitalisation of four manufacturing sectors relying on EU28 data. To show the progress, we also compare data on each variable.
The level of digitalisation of a sector equals the unweighted average of the selected 12 indicators where each indicator refers to the percentage of companies using the specific indicator in the country. Based on this assessment, we conclude that the computer and vehicle manufacturing sector is the most advanced sector in digital transition. This aggregate sector had the highest level of digitalisation already in 2014 and it has shown the second greatest progress (5.2 points) between 2014 and 2017. All four sectors have witnessed considerable and similar progress (4-6 points) during the time period considered. This also means that the sectors’ relative positions have not changed remarkably. The aggregated sector of chemical, petroleum and plastic has the second highest level of digitalisation, and this sector has shown the greatest progress (5.4 points).
These two sectors are clearly ahead in I4.0 in EU. The aggregated food, textile and paper sector has the weakest result, and this sector has shown the smallest progress as well. The metal sector kept its third position in both years.
Table 3 – Differences among manufacturing sectors (EU28)
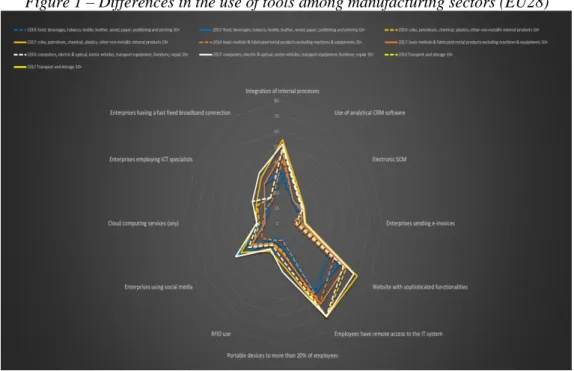
While there are remarkable differences among sectors in the level of digitalisation, the use of the selected tools shows similar patterns among sectors. Remote access to IT system, sophisticated website and integration of internal processes represent the top tools.
Broadband, website and social media have realized the greatest progress between 2014 and 2017. At the same time, RFID and cloud computing lag behind both in terms of absolute position among tools and progress. Furthermore, while internal process integration is among the top priorities, tools related to the external relations are among the least spread solutions. These results depict a transition in which novel technologies (RFID, cloud) and external relations have still rather future potential.
eBusiness 2014 2017 2014 2017 2014 2017 2014 2017 2014 Rank in
2014 2017 Rank in 2017 Change
1 Integration of internal processes 31 34 50 54 41 46 49 52 43 3 47 3 4
2 Use of analytical CRM software 16 18 25 26 17 17 22 23 20 6 21 7 1
3 Electronic SCM 15 16 19 20 18 17 18 19 18 8 18 9 1
4 Enterprises sending e-invoices 14 19 13 19 9 16 11 18 12 12 18 11 6
5
Website with sophisticated
functionalities 43 53 59 69 47 58 56 66 51 2 61 2 10
6
Employees have remote access to
the IT system 51 52 71 71 60 61 70 70 63 1 63 1 1
7
Portable devices to more than 20%
of employees 10 15 18 27 11 20 24 32 16 10 23 6 8
8 RFID use 11 13 15 21 13 16 16 19 14 11 17 12 3
9 Enterprises using social media 29 41 28 38 19 29 31 43 27 4 38 4 11
10 Cloud computing services (any) 15 15 19 21 16 14 20 21 17 9 18 10 0
ICT specialist 11
Enterprises employing ICT
specialists 15 14 23 24 16 17 28 28 21 5 21 8 0
Broadband take-up and coverage 12
Enterprises having a fast fixed
broadband connection 17 30 19 34 17 29 19 38 18 7 33 5 15
Level of digitalization 22,3 26,5 29,9 35,3 23,8 28,3 30,5 35,7 27 - 31 - 5
Rank in 2014 Rank in 2017
Most widespread tool The greatest progress
4 2 3 1
1 3
2 4
USE OF TOOLS
Unweighted average of use and rank Manufacture: food,
beverages, tobacco, textile, leather, wood, paper; publishing and
printing 10+
Manufacture: coke, petroleum, chemical, plastics, other non-
metallic mineral products 10+
Manufacture: basic metals & fabricated metal products excluding machines
& equipments 10+
Manufacture:
computers, electric
& optical, motor vehicles, transport equipment, furniture,
repair 10+
7
Figure 1 – Differences in the use of tools among manufacturing sectors (EU28)
Country level differences in the adoption of I4.0 – the case of computer and vehicle sector
To analyse country level differences, we have selected the sector of computer and vehicle manufacturing that has the highest level of digitalisation. To answer RQ2, we first present the level of digitalisation in 2014 of the selected sector and its change for the year 2017.
Then, as a second step, we develop an I4.0 index that calculates the sector’s relative performance in digitalisation in international context.
Figure 2 – Change in the level of digitalisation in the computer and vehicle manufacturing sector in 10 EU countries
Figure 2 indicates that the level of digitalisation of the aggregated computer and vehicle sector is the highest in Sweden in both years (40.47 and 46.52). Further top performers are Austria (34.82 and 43.20) and Germany (34.34 and 41.49). These top performers have presented the greatest progress (more than 6 points) together with France
SE AT DE CZ EU28 SK FR PL IT HU RO
Change from 2014 to 2017 6,06 8,38 7,15 5,71 4,01 4,84 6,06 4,20 1,91 6,36 2,38 I40 index in 2014 40,47 34,82 34,34 29,29 30,72 29,01 26,32 27,43 28,96 23,03 17,35
40,47
34,82 34,34
29,29 30,72 29,01 26,32 27,43 28,96 23,03
17,35 6,06
8,38 7,15
5,71 4,01 4,84
6,06 4,20 1,91 6,36
2,38
0,00 5,00 10,00 15,00 20,00 25,00 30,00 35,00 40,00 45,00 50,00
I4.0 index
8
in the midfield and Hungary from the tail-ender. Altogether, German-speaking and Nordic countries are ahead in the digital transition, two Central European countries (CZ and SK) perform around the EU28 average, while Latin nations and further Central European countries are struggling. Romania’s level of digitalisation is the lowest and this country shows the weakest progress during the analysed period.
A sector’s digital performance in international context can be assessed by the I4.0 index that is calculated as follows:
𝐼4.0 𝑖𝑛𝑑𝑒𝑥𝑖=
𝐿𝑒𝑣𝑒𝑙 𝑜𝑓 𝑑𝑖𝑔.𝑖− min
𝑗∈[1,𝑛]𝐿𝑒𝑣𝑒𝑙 𝑜𝑓 𝑑𝑖𝑔.𝑖𝑗
𝑗∈[1,𝑛]max 𝐿𝑒𝑣𝑒𝑙 𝑜𝑓 𝑑𝑖𝑔𝑖𝑗− min
𝑗∈[1,𝑛]𝐿𝑒𝑣𝑒𝑙 𝑜𝑓 𝑑𝑖𝑔.𝑖𝑗∙ 100 𝐿𝑒𝑣𝑒𝑙 𝑜𝑓 𝑑𝑖𝑔.𝑖𝑗: 𝑙𝑒𝑣𝑒𝑙 𝑜𝑓 𝑑𝑖𝑔𝑖𝑡𝑎𝑙𝑖𝑠𝑎𝑡𝑖𝑜𝑛 𝑖𝑛 𝑖 𝑠𝑒𝑐𝑡𝑜𝑟 𝑖𝑛 𝑗 𝑐𝑜𝑢𝑛𝑡𝑟𝑦
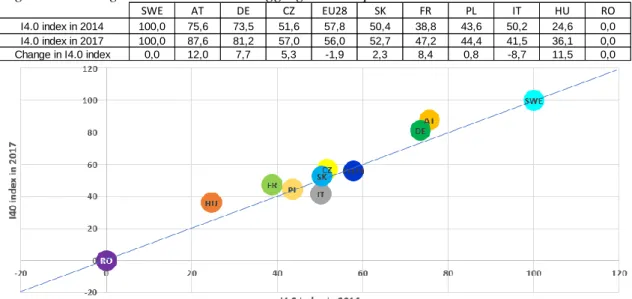
In a specific sector the I4.0 index positions a country between the best performing (100) and the weakest performing (0) country. Sweden was the best performer and Romania was the weakest performer in both years. The relative digital position of a country’s sector has not changed if it is around the blue line (Figure 3). It has improved if it is above the blue line, and it has become weaker if it is depicted under the blue line.
Austria and Hungary have improved their relative positions to the greatest extent.
Germany and France are also among the best developers. Interestingly, while Czech Republic, Slovakia and Poland are ahead in digitalisation if we compare them to Hungary, the relative progress of these countries is rather moderate compared to the Hungarian development. Finally, the negative relative decrease in the I4.0 index of EU28 (-1.9) warns that there is a widening gap among top and weakest countries in their digital efforts.
Figure 3 – Change in I4.0 index in the aggregated computer and vehicle sector in 10 countries
Progress in I4.0 and value added
According to the widespread belief, I4.0 bears the opportunity of remarkable productivity improvement and it can also contribute to higher value added (Blanchet, et al., 2014).
I4.0. might even lead to an increase in the share of manufacturing in total value added of an economy, and hence it could help to achieve the mid-term targets of EU (20%) (Smit, et al., 2016) and national reindustrialisation policies (HU: 30%) (NGM, 2016).
To answer RQ3, we compare the change in the vehicle sector’s (a) relative value added, (b) its I4.0 index in 2017 and (c) the change of the level of digitalisation from 2014
SWE AT DE CZ EU28 SK FR PL IT HU RO
I4.0 index in 2014 100,0 75,6 73,5 51,6 57,8 50,4 38,8 43,6 50,2 24,6 0,0
I4.0 index in 2017 100,0 87,6 81,2 57,0 56,0 52,7 47,2 44,4 41,5 36,1 0,0
Change in I4.0 index 0,0 12,0 7,7 5,3 -1,9 2,3 8,4 0,8 -8,7 11,5 0,0
9
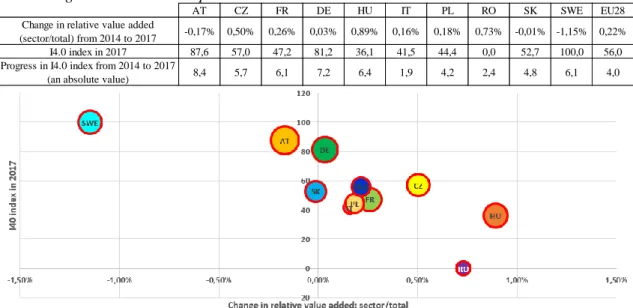
and 2017. We would expect that a higher I4.0 index and a greater change in the level of digitalisation lead to an increased share of sectoral value added. Thus, better performing countries should be in the top-right quadrant in Figure 4. Contrary to our expectations, Figure 4 shows that the investigated sector’s share in value added has not changed (DE) or has even decreased (SWE, AT) in countries with the highest I4.0 index. Countries (HU, RO) with the weakest I4.0 index were actually able to increase the relative importance of their sector. It is evident from the measures, that the change in the level of digitalisation has no direct relationship with the evolution of the sector’s relative share in value added.
Figure 4 – Relationship between the vehicle sector’s value added and I4.0 index
Remark: the size of the dots represents the change in level of digitalisation from 2014 to 2017
While our results do not support the link between digitalisation and increased share of sectoral value added, we do not know what would have happened without digitalisation.
Maybe, digitalisation has minimized losses in Sweden and the German-speaking countries. However, current trends rather show that digitalisation alone won’t lead to new comparative advantage in manufacturing. The increasing share of the sector in Hungary and Romania indicates that labour cost is still a more important comparative advantage.
Of course, cautious interpretation is required since according to our data we are currently in the pre-mature phase of digital transition.
We are rather sceptical of the promise of increasing share of manufacturing sectors due to I4.0 efforts, since this revolution assumes an industrial service ecosystem and in our opinion this service ecosystem will increase value added and number of employees, contributing to the growth of service sectors. Another aspect of digitalisation is the change in labour market which is not the topic of this paper. However, manufacturing jobs and especially low-skilled manufacturing jobs are at high risk, since they could be eliminated in few decades (Arntz, et al., 2016) (Rodrik, 2016).
Limitation and Future research
Our paper offers a sector-level assessment of digitalisation based on EU datasets.
However, our framework has many shortcomings. Future studies should incorporate further I4.0 concepts. Big data, use of robots or 3D printing are now among the items in the EU survey on digital transition, but unfortunately those data are not available for the past couple of years. We have selected 10 countries. Beside Central European countries we have dealt with the most important commercial partners of this region (Austria,
AT CZ FR DE HU IT PL RO SK SWE EU28
Change in relative value added
(sector/total) from 2014 to 2017 -0,17% 0,50% 0,26% 0,03% 0,89% 0,16% 0,18% 0,73% -0,01% -1,15% 0,22%
I4.0 index in 2017 87,6 57,0 47,2 81,2 36,1 41,5 44,4 0,0 52,7 100,0 56,0
Progress in I4.0 index from 2014 to 2017
(an absolute value) 8,4 5,7 6,1 7,2 6,4 1,9 4,2 2,4 4,8 6,1 4,0
10
Germany) and with some representatives of Latin and Nordic regions. We believe that this set of countries has not influenced our main messages, however a wider international outlook could provide some new insights. Unfortunately, EU datasets have limited geographical focus and do not cover countries which could play an important role in the digital transformation of manufacturing (China, US, Japan, South Korea).
Conclusion
Our paper aimed at providing empirical insight into I4.0 focusing on meso level and relying on EU data sources. Based on our results, there are differences among manufacturing sectors in digitalisation, with the computer and vehicle manufacturing sector ahead and the food/beverage sector behind. Each sector, however, progresses based on similar patterns (Figure 1). Country progress in I4.0, based on data from the most digitised computer and vehicles sector, does only partly depend on past I4.0 level: there are countries with lower original level and less (RO, IT) or more progress (HU) afterwards, but also higher original levels and more progress (SWE, DE, AT). Based on EU28 data, the gap between the best and worst seems to become slightly larger. We did not find convincing data for the relationship between I4.0 and sectoral level value added:
in the most digitised country (SWE) the sectors with high I4.0 index provide less value added to the total in 2017 than they did 3 years before. In some other countries (RO, HU) there is a clear increase in value added/total irrespective of the relatively low I4.0 index.
It means that other factors, like low wages or high subsidies are still more important factors in strategic manufacturing decisions than I4.0 technologies.
Acknowledgment
This research was supported by the project “Aspects on the development of intelligent, sustainable and inclusive society: social, technological, innovation networks in employment and digital economy” (EFOP- 3.6.2-16-2017-00007). The project has been supported by the EU, co-financed by the European Social Fund and the budget of Hungary.
References
Arntz, M., Gregory, T. & Zierahn, U., 2016. The Risk of Automation for Jobs in OECD Countries: A Comparative Analysis, Párizs: OECD.
Blanchet, M., Rinn, T., von Thaden, G. & de Thieulloy, G., 2014. Industry 4.0: The new industrial revolution - how Europe will succed, Munich: ROLAND BERGER STRATEGY CONSULTANTS GMBH.
Brettel, M., Friederichsen, N., Keller, M. & Rosenberg, M., 2014. How Virtualization, Decentralization and Network Building Change the Manufacturing Landscape: An Industry 4.0 Perspective. International Scholarly and Scientific Research & Innovation, 8(1), pp. 37-44.
DESI (2017): Digital Economy and Society Index 2017 (https://ec.europa.eu/digital-single- market/en/desi) (03.05.2018)
Goran, J., LaBerge, L. & Srinivasan, R., 2017. Culture for a digital age, s.l.: McKinsey&Company.
Huber, W., 2016. Indsutrie 4.0 in der Automobilproduktion. Ein Praxisbuch. Wiesbaden: Springer Vieweg.
Lasi, H. et al., 2014. Industrie 4.0. Business and Information Systems Engineering, 6(4), pp. 239-242.
NGM, 2016. Irinyi Terv: az innovatív iparfejlesztés irányainak meghatározásáról, Budapest:
Nemzetgazdasági Minisztérium.
Rodrik, D., 2016. Premature deindustrialization. Journal of Economic Growth, 21(1), pp. 1-33.
Schlechtendahl, J. et al., 2015. Making existing production systems Industry 4.0-ready. Production Engineering, 9(1), pp. 143-148.
Schwab, K., 2016. The Fourth Industrial Revolution. 1st edition ed. s.l.:Portfolio Penguin.
Smit, J., Kreutzer, S., Moeller, C. & Carlberg, M., 2016. Industry 4.0, Brussels: European Parliament.
Valenduc, G. & Vendramin, P., 2016. Work in the digital economy: sorting the old from the new, s.l.:
ETUI, Brussels.
Viharos, Z. et al., 2017. Non-comparative, Industry 4.0 Readiness. Budapest, 15th IMEKO TC10 Workshop on Technical Diagnostics.