Journal of Structural Geology 138 (2020) 104098
Available online 3 June 2020
0191-8141/© 2020 The Authors. Published by Elsevier Ltd. This is an open access article under the CC BY license (http://creativecommons.org/licenses/by/4.0/).
Potential formation mechanisms of early diagenetic displacive veins in the Permian Boda Claystone Formation
Ervin Hrabovszki
a,*, Emese T � oth
a, Tivadar M. T � oth
a, Zolt � an M � ath � e
b, F � elix Schubert
aaDepartment of Mineralogy, Geochemistry and Petrology, University of Szeged, 6722, Szeged, Hungary
bMecsek�erc Ltd., 7633, P�ecs, Hungary
A R T I C L E I N F O Keywords:
Solid inclusions Cone-in-cone structures Continuous vein growth Force of crystallisation Seepage forces Bedding-parallel veins
A B S T R A C T
The Boda Claystone Formation is the most promising host rock for the disposal of high-level radioactive waste in Hungary. The formation has several properties obstructing the migration of radionuclides; however, structural heterogeneities may nonetheless act as migration pathways. Therefore, understanding the tectonic evolution of the formation is vital. Previous research has identified four different vein generations in the BAF–2 well. This study deals with the generation of veins that contain characteristic microstructures, such as curved wall rock inclusions in bands, trails and cone-in-cone arrangements. Based on optical, cathodoluminescence and electron microscopy, together with X-ray fluorescence and Raman microspectroscopy, these veins appear to have potentially formed during early diagenetic processes. Vein development was continuous and occurred along horizontal surfaces. The abovementioned structural elements were formed by growing crystals; however, pri- mary crystal morphologies were presumably replaced during diagenetic and hydrothermal processes. A theo- retical model is described, which could be responsible for the horizontal and continuous vein opening and simultaneous crystallisation in sediments with high (but easily degraded) effective porosity. According to this model, compaction, pressure solution, elevated pore fluid pressures, seepage forces and the force of crystal- lisation can all play important roles in the formation of these types of veins.
1. Introduction
National screening (Konr�ad and H�amos, 2006) of geological forma- tions has revealed that the Late Permian Boda Claystone Formation (BCF) is a potential host rock for the deep geological repository of high-level radioactive waste in Hungary. The porosity and permeability of this 500–1000-m-thick claystone are ideally low for hazardous waste isolation (Fedor et al., 2008). Nonetheless, rocks with such properties are often characterised by significant fluid flow along planes associated with their structural inhomogeneities. For this reason, it is crucial to understand how the phases of structural evolution and palaeo-fluid flow history of the BCF are recorded by fractures and veins within.
As reported by Hrabovszki et al. (2017), most veins throughout the BCF can be classified based on the classical scheme of vein growth morphologies (Ramsay and Huber, 1983; Bons, 2000; Passchier and Trouw, 2005; Bons et al., 2012) into the following categories: 1) Syn- taxial veins—the vein-forming elongate blocky crystals grew from the wall rock towards the vein centres. 2) Antitaxial veins—the crystal fibres grew from the median zones of the veins towards the vein sides. 3)
Ataxial veins—the stretched crystals showed no systematic growth di- rection. However, the subhedral, mosaic, acicular and fibrous crystal morphologies of a unique, polytextured vein generation is not consistent with its microstructure. These kinds of veins contain curved wall rock inclusions (WRI), which are frequently aligned in inclusion bands, in- clusion trails and cone-in-cone (CIC; Cobbold and Rodrigues, 2007;
Cobbold et al., 2013) arrangements.
In this paper, microstructural characteristics of WRI-containing veins were presented, such as extremely variable sized host rock fragments, partially detached solid inclusions and diffuse WRI boundaries. These observations suggest that the studied vein generation does not relate to tectonic processes but were formed because of compaction, pressure solution, elevated fluid pressure, vertical fluid migration and force of crystallisation during early diagenesis. The inclusion bands, trails and CIC structures were formed by growing fibrous crystals that were replaced during a later stage of the vein evolution. These findings indicate that understanding the formation of microstructures and microscopic morphologies of veins contribute to the reconstruction of structural evolution and paleofluid flow history of such environments.
* Corresponding author.
E-mail address: ervin.hrabovszki@geo.u-szeged.hu (E. Hrabovszki).
Contents lists available at ScienceDirect
Journal of Structural Geology
journal homepage: http://www.elsevier.com/locate/jsg
https://doi.org/10.1016/j.jsg.2020.104098
Received 15 January 2020; Received in revised form 27 May 2020; Accepted 28 May 2020
1.1. Formation mechanisms of inclusion bands and inclusion trails Generally, two distinct types of inclusion arrangements in veins are distinguished in the literature (e.g. Ramsay, 1980): inclusion bands and inclusion trails. Inclusion bands are surfaces of solid (and fluid) inclusions reflecting the orientation and shape of the vein-wall interface (Fig. 1, Passchier and Trouw, 2005). Each band represents a single episode of the vein opening history; therefore, the distance between two bands is equal to the width of a single opening and sealing increment. Inclusion trails are also aggregates of solid (and fluid) inclusions; however, they occur along surfaces sub-perpendicular to the walls of the vein (Fig. 1, Passchier and Trouw, 2005). These surfaces usually connect corre- sponding points between adjacent inclusion bands and therefore the vein walls; as a result, they record the opening trajectory of veins (Ramsay and Huber, 1983; Cox, 1987; Koehn and Passchier, 2000;
Passchier and Trouw, 2005; Renard et al., 2005). There are two preferred mechanisms for the formation of both microstructures: a) the crack-seal mechanism and b) continuous opening and cementation.
The crack-seal process involves periodic opening and sealing events in a narrow cavity (Ramsay, 1980) due to hydraulic fracturing (Hubbert and Willis, 1957). In the case of elevated pore fluid pressure (Pf), the rock behaves as if the applied stress were lower by the amount Pf; the result being termed effective stress (σ0; Twiss and Moores, 1992). In other words, a Mohr circle of equivalent size shifts along the normal stress axis
towards smaller compressive stresses. If Pf exceeds the minimum compressive stress (σ3) by an amount equal to the tensile strength (T0) of the rock, fracturing can occur. Depending on the amount of differential stress extensional, mixed-mode (hybrid) or shear fractures can develop.
Due to fracturing, Pf decreases, and decreasing the solubility of the materials dissolved in the fluids filling these micro-cracks leads to the sealing of cracks by minerals (Van der Pluijm and Marshak, 2004). In addition to pressure reduction, fluids may become supersaturated due to changes in temperature, pH, Eh, evaporation, pressure solution or fluid mixing (Bons et al., 2012). After the sealing of fluid pathways, Pf in- creases again until the rock fails. This cycle can be repeated hundreds of times. Each time a new crack forms at the vein-wall rock contact, solid fragments can break off and be incorporated by crystals during the sealing process.
Veins can also form by continuous opening and cementation without the presence of any open fractures (Means and Li, 2001; Wiltschko and Morse, 2001; Hilgers and Urai, 2005; Hilgers et al., 2006). Solid inclu- sion bands and trails can develop during continuous vein formation caused by the force of crystallisation (Taber, 1916; Means and Li, 2001).
The pressure generated by crystal growth (Pfc) acts similarly to vein formation in terms of the pore fluid pressure involved in hydrofracture development (Fig. 2; Wiltschko and Morse, 2001). The magnitude of Pfc
is related to the level of supersaturation in the pore fluid (Dewers and Fig. 1. Solid (and fluid) inclusion arrangements within veins based on the work
of Passchier and Trouw (2005). Inclusion trails are usually parallel to the vein opening trajectory, whereas inclusion bands dominantly reflect the orientation of the vein walls.
Fig. 2.The effect of increasing fluid pressure (Pf) and crystallisation pressure (Pfc) on the stress field and fracture formation. The Mohr circle of constant size shifts left along the σn axis by the amount of Pf and Pfc. If the Mohr circle for effective stress touches the failure envelope in the tensile field of the Mohr space at one point on the σn axis, tensile fracture occurs. If no tectonic stress is present, the greatest (σ01) and least (σ03) effective stresses are vertical and horizontal owing to the lithostatic pressure; therefore, the fracture will be vertical.
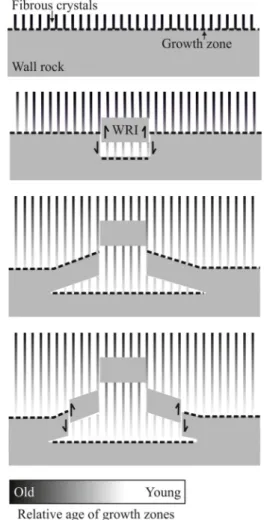
Fig. 3.The constant growth rate model of fibrous veins and the formation of sinusoidal inclusions based on the work of Hilgers and Urai (2005). According to this model, fibrous crystals grow at a constant rate along the vein-wall interface. As vein growth progresses, crystals precipitate with similar crystal- lographic orientations in the host rock. This might be possible only if the crystals precipitate before the separation of the wall rock inclusion (WRI).
During the process, there is no shear between adjacent fibrous crystals, only between the wall rock and the detaching WRIs.
Ortoleva, 1990; Wiltschko and Morse, 2001) given by Equation (1):
Pfc¼
�RT ΔV
�
lnΩ; (1)
where R is the gas constant, T is temperature, ΔV is the change of volume between a substance in solution and its precipitate, and Ω is the degree of supersaturation in the pore fluid. Therefore, an increase in supersat- uration increases the pressure generated by crystallisation (Pfc). By way of example, if the NaCl saturation level is ~1.5, pressures can reach 135 MPa (Desarnaud et al., 2016). In such cases, fluid advection is not required for vein growth, since diffusion can be a very effective mech- anism for material transport even in stagnant pore fluids (Bons, 2000).
Fibrous crystals can grow at the vein-wall rock contacts until supersat- uration of the pore fluid is sufficiently high (Wiltschko and Morse, 2001).
Based on the sinusoidal arrangement of solid inclusions within fibrous veins, Hilgers and Urai (2005) concluded that veins grew continuously according to their ‘constant growth rate’ model (Fig. 3).
The inclusion arrangements described in their study formed at least partly due to the force of crystallisation and not by the classic crack-seal mechanism.
1.2. Cone-in-cone structures within bedding-parallel veins
CIC structures are common in bedding-parallel fibrous veins, known as beef (Cobbold et al., 2013 and references therein), of low-permeability sedimentary rocks. They typically appear as fibrous crystals and conical WRI series between them. Such veins develop as horizontal planes with vertical openings and crystal growth directions (Selles-Martinez, 1994; Rodrigues et al., 2009). The mineral cement of CIC-containing veins is dominantly calcite, gypsum (satin spar) or quartz; however, other minerals may also develop with fibrous morphology depending on the suppression (or absence) of competition between the growing crystals (Bons, 2000; Hilgers et al., 2001). CIC structures comprise concentric interbedded cones of fibrous crystals with thin layers of host rock material, which is commonly mudstone, evaporite or, in rarer cases, carbonate. Host rock inclusions usually form boundaries between adjacent cones (Kolokol’tsev, 2002). The CIC structure was first described in the 19th century (Sorby, 1860), but several crucial concepts towards understanding its formation mecha- nism have emerged only in the last decades, including aragonite–calcite transformation (Tarr, 1922), volume shrinkage during dewatering (Shaub, 1937), convective heat and mass transfer (Kolokol’tsev, 2002), seismic wave propagation (Abalos and Elorza, 2011), displacive crystal � growth (Taber, 1916; Woodland, 1964; Franks, 1969) and fluid overpressure-induced fracturing (Meng et al., 2017), among others.
Nevertheless, most authors agree that the structure develops through the formation of fibrous crystals within partially consolidated sediments during early diagenesis.
Cobbold and Rodrigues (2007) provided a comprehensive explana- tion of how the greatest effective stress vector may become horizontal and thus how horizontal veins may develop in tectonically inactive sedimentary basins. The primary condition is that pore fluid migrates upward in response to a vertical gradient in fluid overpressure caused by mechanical compaction. Due to this migration, seepage forces act on the framework grains of the sediment. The vertical effective stress is reduced by the amount of fluid overpressure as shown in Equation (2) (modified after Cobbold and Rodrigues, 2007):
σ’1 ¼σ1 Pf (2)
Here, σ01 is the greatest effective stress, σ1 is the greatest applied stress and Pf is fluid pressure. Since there is no horizontal fluid migration, the horizontal effective stress (σ03) is not modified by seepage forces;
instead, it is proportional to the vertical effective stress as shown in Equation (3) (modified after Cobbold and Rodrigues, 2007):
σ’3 ¼keσ’1 ¼ ke σ1 Pf
�; (3)
where ke is an elastic constant of proportionality derived from Poisson’s ratio (ν):
ke¼
� ν
1 ν
� (4)
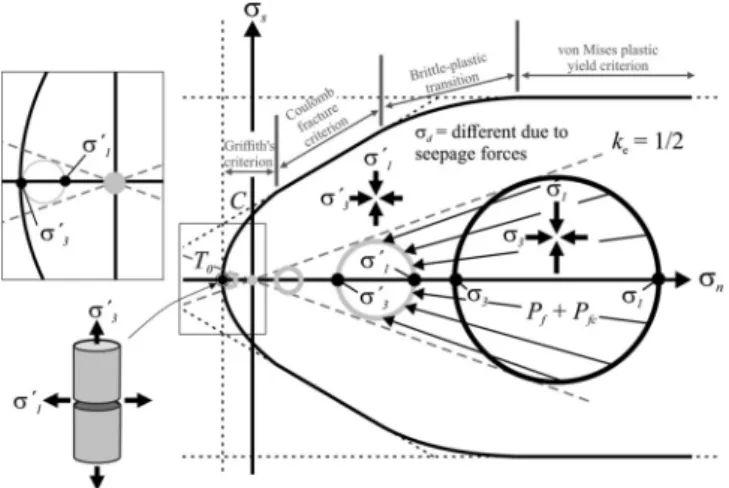
Accordingly, in cases of increasing overpressure, the Mohr circle decreases in size and shifts along the normal stress axis to the left. For the formation of bedding-parallel veins, the Mohr circle is required to touch the failure envelope in the tensile stress field. This is achievable when Pf exceeds the pressure resulting from the weight of the Fig. 4.The formation of horizontal fractures induced by fluid overpressure (Pf)
and crystallisation pressure (Pfc) in the presence of seepage forces based on Cobbold and Rodrigues (2007). The Mohr circle for effective stress (σ0) in the compressional field gradually shifts to the left and decreases in size as a result of growing Pf þPfc and seepage forces. Further increase in Pf þPfc results in an increased differential stress (σd) in the tensional field of the Mohr space. As a result, the least effective stress (σ03) becomes vertical. ke– is the elastic constant of proportionality.
Fig. 5.A–Location of the Mecsek Mountains within Hungary. B–Distribution of the Boda Claystone Formation (modified after Konr�ad and Sebe, 2010). Legend:
1–all Palaeozoic; 2–Upper Permian Boda Claystone Fm; 3–Late Permian Kov} �ag�osz}ol}os Sandstone Fm; 4–Triassic sediments (sandstones, carbonates, evaporites); 5–Jurassic and Cretaceous sediments and Cretaceous volcanic rocks; 6–Neogene sediments; 7–fault; 8–strike-slip fault; 9–thrust fault;
10–syncline and anticline; 11–well site.
overburden. In such cases, the former σ01 becomes larger in the tensile field and changes into the least effective stress (σ03), which acts verti- cally. Under these conditions (Pf >σ3), the horizontal effective stress is:
σ’1¼keσ’3 ¼ ke σ1 Pf
�; (5)
where σ01 is the horizontal effective stress, σ03 is the vertical effective stress and σ1 is the greatest applied stress. Thus, once Pf reaches the magnitude of the overburden pressure, a further increase in Pf generates vertical tension. Because the horizontal effective stress is proportional to the vertical one, as shown using Equation (3), the horizontal tension will be smaller (σ01) than the vertical tension (σ03) and it will increase at a lower rate. For this reason, the difference between the horizontal and vertical stresses, and therefore the size of the Mohr circle in the tensional field of the Mohr space, increases with increasing Pf. If the Mohr circle touches the failure envelope at a point on the σn axis (Pf ¼σ3 þT0), a horizontal tension fracture will open (Fig. 4; Cobbold and Rodrigues, 2007). Because Pf controls the hydrofracture development similar to the pressure exerted by growing crystals (Pfc) controlling the vein formation (Wiltschko and Morse, 2001; i.e. both shift the Mohr circle leftwards), it is reasonable for the magnitude of Pf to be supplemented by Pfc if the growth of the crystals occurs under elevated fluid pressure conditions.
2. Geological background
The study area is located in the Tisza Mega-unit (Haas et al., 2013, Fig. 5A), which forms the south-eastern basement of the Pannonian Basin. Many important outcrops are found in the Mecsek Mountains. The western part of the Mecsek is composed mainly of Paleozoic–Triassic sediments, including the Late Permian (Barab�as-Stuhl, 1981) BCF (Fig. 5B). The distribution of the formation covers approximately 150 km2, and its maximum thickness is nearly 1000 m (Konr�ad and H�amos, 2006). The entire sedimentary sequence has not yet been revealed by drilling; nevertheless, the formation presents its greatest thickness (900 m) at the BAF–2 well (Fig. 6). Based on acoustic borehole televiewer observations, the average dip angle of the bedding planes in the BAF–2 well is 40� (Bern�ath et al., 2014; S�amson, 2015). The BCF consists dominantly of reddish-brown albitic claystone interbedded with dolo- mite, siltstone and sandstone. The main rock-forming minerals are quartz, albite, illite–muscovite (dominant clay mineral), chlorite, calcite, dolomite and hematite (Arkai et al., 2000; � M�ath�e, 2015). In certain cases, the authigenic albite content exceeds 50 wt%; this un- common rock type is called albitolite. Mineralogical, petrographical, geochemical and sedimentological characteristics (Arkai et al., 2000; � Varga et al., 2005, 2006; Varga, 2009; Konr�ad et al., 2010; M�ath�e, 2015) indicate that the formation represents a shallow, alkaline lake sediment deposited on a playa mudflat (Konr�ad et al., 2010). The presence of carbonate and albite pseudomorphs after halite hopper crystals (precipitated in soft sediment during desiccation periods) in the rock matrix also supports the playa mudflat origin (M�ath�e and Varga, 2012).
The tectonic evolution of the study area is related to the Alpine orogeny (e.g. Horv�ath et al., 2006; Horv�ath et al., 2015); however, the effects of older tectonic events cannot be excluded. Several subsequent tectonic phases are indicated during the complex evolution of the area.
Fig. 6. The stratigraphical column of the BAF–2 well with the total measured depth (TMD) of the collected drill core samples (based on Konr�ad et al., 2016).
Legend: 1–soil, loess; 2–claystone with siltstone interbeds; 3–greenish-black reductive claystone; 4–claystone with siltstone and sandstone interbeds;
5–location of drill core samples investigated in this study.
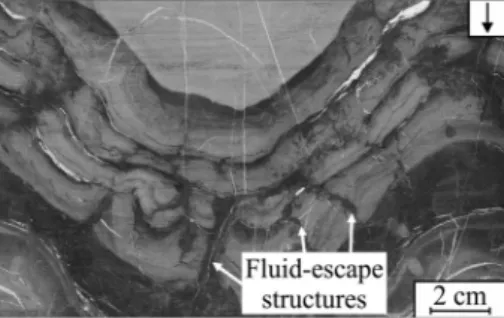
Fig. 7.Fluid-escape structures in a stitched core scanner image of the drill core sample from the depth interval of 548.40–548.66 m (TMD). Note that sinu- soidal bedding surfaces are artefacts instead of folds and represent inclined bedding on the cylinder wall. The arrow in the upper right corner indicates the axis of the core sample and the down direction.
The most important among these are the Late Cretaceous NE–SW shortening (Benkovics et al., 1997), tensional stresses and rotations in the Early Miocene (synrift phase of the Pannonian Basin; Beregart and Csontos, 1988; Csontos and Beregart, 1992; Fodor et al., 1999; Maros et al., 2004), (post-)Sarmatian compression (Sebe, 2017), post-rift thermal subsidence (Csontos et al., 2002; Maros et al., 2004) and
ongoing basin inversion, which started in the Late Pannonian (Csontos et al., 2002; Konr�ad and Sebe, 2010).
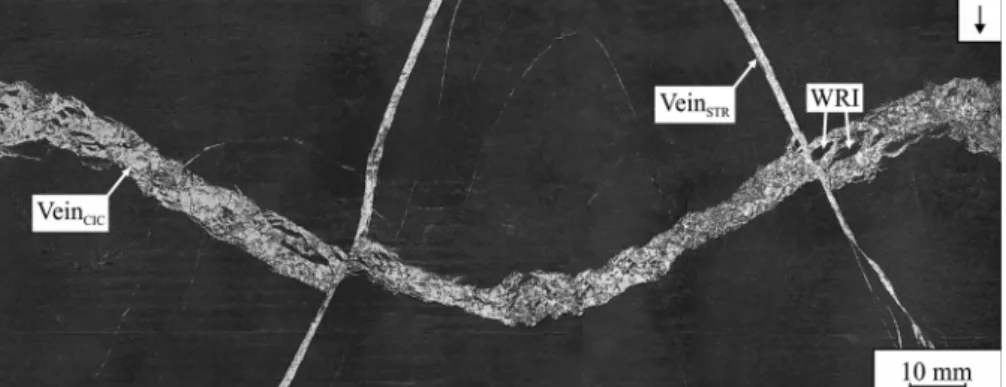
Interpretation of veins as evidence of multiple tectonic and/or diagenetic processes was considered in detail by Arkai et al. (2000), � Lenti et al. (2010), Hrabovszki et al. (2017) and T�oth et al. (2018). Based on their macroscopic appearance, mineral-filled structural elements in Fig. 8. The mutual relationship of intersecting cone-in-cone (VeinCIC) and so-called straight veins (VeinSTR) in a stitched core scanner image (662.10–662.40 m TMD). The arrow in the upper right corner indicates the axis of the core samples and the down direction. WRI–wall rock inclusion.
Fig. 9.Typical microstructure of cone-in-cone veins (VeinCIC; 251.56–251.73 m TMD). These veins contain wall rock inclusions arranged as cone-in-cone structures (CIC; B), as inclusion trails (ITs; B and E) and as inclusion bands (IB1–4; D). It should be noted that the highlighted inclusion trails (B) are missing their left ‘limbs’ to form a CIC, which can be observed in Figure A. The interlimb angle of the inclusions decreases piece by piece from the vein walls towards the centre of the vein (C and D). Figure D is the digitalised and interpretation version of Figure C;
darker colours indicate earlier inclusion separations from the vein wall. Relatively large WRIs are observed in the vicinity of trails consisting of small inclusions (E). Incompletely detached wall rock fragments are inclined from the vein walls towards the central part of the vein (E). The incomplete detachment process of a WRI is indicated by black arrows surrounded by black and white rectangle.
PPL–plane-polarised light.
the BAF–2 well have been classified into the following categories:
branched veins with WRIs, straight veins, en-echelon vein arrays and cemented breccias. In the BAF–2 well, the average dip of the veins appropriate for measurement is 42� (branched veins), 70� (straight veins) and 22� (en-echelon vein arrays). Based on cement minerals, calcite-, anhydrite-, calcite–barite- and barite–quartz-dominated veins have been distinguished; however, the proportion of these minerals varies between individual samples and locations. Based on fluid inclu- sion microthermometric properties and stable isotopic compositions, the parent fluids are known to be of meteoric (~70 �C; calcite-dominated veins) and hydrothermal (~150 �C; barite–quartz-dominated veins) origins (Arkai et al., 2000; � Lenti et al., 2010). Vein growth can be characterised by syn-, anti- and ataxial mechanisms (details in Hra- bovszki et al., 2017). Measuring primary aqueous fluid inclusions, K.
T€or€ok (unpublished data) obtained eutectic temperatures (Te) of 23.5
�C and 39.0 �C, and a minimum final melting temperature (Tm) from anhydrite-dominated veins of 17.7 �C, which corresponds to high-salinity (20.8 mass% NaCleq) H2O–NaCl–CaCl2 solutions, whereas
Lenti et al. (2010) determined homogenisation temperature of ~105 �C for barite–calcite veins, which were precipitated from low-salinity fluids (3.2–4.3 mass% NaCleq).
3. Methods
The petrographic description of samples was performed on polished thin sections of 30-μm thickness, using an Olympus BX41 microscope equipped with an Olympus DP73 digital microscope camera. Cath- odoluminescence (CL) images were obtained using a Reliotron VII CL instrument operating at 7 kV and 0.7 mA, mounted on an Olympus BX43 microscope. Raman spectroscopy was carried out using a Thermo Sci- entific DXR Raman microscope equipped with a 532-nm wavelength Nd:
Fig. 10. Cone-in-cone (CIC) microstructure composed of WRIs observed in the VeinCIC (251.56–251.73 m TMD). PPL–plane-polarised light.
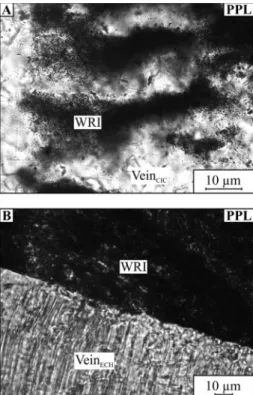
Fig. 11. A–Wall rock inclusions (WRI) with diffuse boundaries in VeinCIC
(251.56–251.73 m TMD). B–WRI with sharp boundaries in an en-echelon vein (VeinECH; 283.90–284.14 m TMD). PPL–plane-polarised light.
Fig. 12.A–Light-coloured siltstone lithoclasts on both walls of the VeinCIC
(251.56–251.73 m TMD). The detached parts of the host rock (WRI) can be matched across the whole vein in such a way that the lighter shaded area marked with a black dashed line correlates with the opposite vein wall. B–As a result, the vein walls fit almost perfectly together. C–The former, pre- fragmentation shape of the siltstone lithoclast is marked out with a white dashed line. Based on these observations, the direction of the opening can be defined, as indicated by the thick black arrow. PPL–plane-polarised light.
YAG laser. A laser power of 10 mW and pinhole confocal aperture of 25 μm were used for each measurement. Micro X-ray fluorescence (μXRF) mapping was performed on a Horiba Jobin Yvon XGT-5000 X-ray fluo- rescent spectrometer equipped with Rh X-ray source operating at 30 kV and 0.5 mA. Polarisation and CL microscopic observations, as well as the μXRF and Raman analyses, were performed at the Department of Mineralogy, Geochemistry and Petrology, University of Szeged. Scan- ning electron microscopic and energy-dispersive X-ray spectroscopic analyses were conducted using a Hitachi S-4700 field emission scanning electron microscope equipped with a Bruker (R€ontec) QX2 energy- dispersive X-ray fluorescence spectrometer operating at 15–20 kV and 10 μA, at the Faculty of Science and Informatics, University of Szeged.
4. Sample description
Drill core samples from the BAF–2 well are available for interval between depths of 251.56–831.30 m within the total measured depth (TMD). They represent claystone interbedded with siltstone and sand- stone. Meso- and micro-scale observations were performed on a total of 30 drill core samples (Fig. 6).
4.1. Host rock
The highly homogeneous, reddish-brown host rock contains only a few sedimentary textural elements; in most cases, even bedding planes cannot be distinguished. Sedimentary structures, such as parallel lami- nations or fluid-escape structures, are observable only in sandstone interbeddings (Fig. 7). Our petrographic observations are thus consistent with previous studies (Arkai et al., 2000; M� �ath�e, 2015) in as much as the main rock-forming minerals are authigenic feldspars (both plagioclase and K-feldspar), clay minerals, carbonate minerals, hematite and detrital quartz (�feldspars and micas) with a range of grain sizes from silt to coarse sand. Occasionally, the authigenic feldspar and carbonate crys- tals appear in larger quantities within irregular to angular pores in the groundmass.
In the clayey–hematitic matrix, uneven, conchoidal fractures, branched veins enriched with CIC structures (VeinCIC, the subject of the present study), straight veins (VeinSTR), en-echelon vein arrays con- sisting of sigmoidal tension gashes (VeinECH) and cemented breccias can be observed (Hrabovszki et al., 2017). Although the absolute age of the veins is unknown, the VeinCIC is probably the oldest based on its cross-cutting relations (Fig. 8).
4.2. Microstructures and vein-filling minerals of the VeinCIC
The maximum aperture of the VeinCIC is 15 mm in the observed core samples. The most characteristic feature of these veins is that they contain a high amount of WRIs (Fig. 9). In this study, the terms ‘solid inclusion’ and ‘host rock fragment’ are used interchangeably with ‘wall rock inclusion’. WRI reach lengths of up to 10 mm and a maximum width of 2 mm. They have a curved, elongated shape and commonly form both inclusion trails (Fig. 9B) and inclusion bands (Fig. 9C and D).
Occasionally, solid inclusions of extremely variable sizes can be observed in adjacent spatial configurations (Fig. 9E). Furthermore, WRIs frequently occur in such unique arrangements as nested cones pointed towards the centre of the veins (CIC; Figs. 9B and 10). Each cone consists of individual, regularly spaced host rock fragments. In some cases, solid inclusions are partially split off from the vein walls and fold slightly towards the central part of the vein (Fig. 9E). The rims of solid inclusions are mostly diffuse (Fig. 11). Occasionally, on both vein walls, siltstone lithoclasts, located exactly opposite one another, can be observed with a lighter, reddish-yellow colour. The adjacent parts of these lithoclasts can be matched, as is the case for the vein walls (Fig. 12).
The major vein-forming mineral phase is calcite; however, smaller quantities of feldspar, barite–celestine, anhydrite, chlorite, pyr- ite–chalcopyrite and galena can also be observed. Based on Fig. 13. Minerals and their microtextures in the VeinCIC (622.80–622.97 m
TMD). A–Mosaic calcite (CalMOS) texture of anhedral crystals with amorphous, interpenetrating grain boundaries. Wall rock inclusions (WRI) and fine-grained feldspar (Ab �Kfs) crystals can also be observed. B–Acicular barite–celestine (Brt-ClsACC) crystals within a pore (Φ) and subhedral calcite (CalSHR2) crystals along the pore walls with surrounding WRIs and feldspar crystals. C–Fine- grained feldspar lining WRIs among mosaic and fibrous calcite (CalFIB) grains.
The red rectangle indicates the position of Figure C within the VeinCIC. XPL–crossed-polarised light; GP–gypsum plate. (For interpretation of the ref- erences to colour in this figure legend, the reader is referred to the Web version of this article.)
microtexture, the calcite phase can be classified into three categories:
mosaic, subhedral and fibrous calcite. 1) Mosaic calcite has a poly- crystalline structure (Dong et al., 1995; CalMOS; Fig. 13A). Its anhedral crystals of ~30-μm size have amorphous, interpenetrating grain boundaries mostly close to the vein walls. 2) Subhedral calcite grains are located along the vein walls (CalSHR1) and on the pore walls (CalSHR2;
Fig. 13B). Grain sizes vary between 20 and 170 μm. 3) Fibrous calcite crystals have high (>10) length/width ratios (CalFIB; Fig. 13C), and the length of individual fibres is between 7 and 90 μm. Most carbonate phases (CalMOS, CalSHR2, CalFIB) show dull orange cathodoluminescent (CL) colours (Fig. 14A), however, the CalSHR1 phase exhibits a distinct, relatively bright orange CL colour (Fig. 14B and C).
Feldspar occurs in unique textural positions as a thin selvedge zone on the vein walls and around WRIs (Fig. 14C). This rim is composed of subhedral albite and K-feldspar grains, where albite is dominant (Ab � Kfs; Fig. 14D). The μXRF maps presented in Fig. 15 show the occurrence of the feldspar cement around WRIs within the CalSHR1 calcite mineral phase. Albite crystals range in size up to around 30 μm. Frequently, these crystals show zoned microfabrics. The clear rims of the crystals surround darker, solid inclusion-rich cores (Fig. 14E). The feldspar cement often encloses pyrite–chalcopyrite (Py-Ccp) grains and chlorite (Chl) flakes.
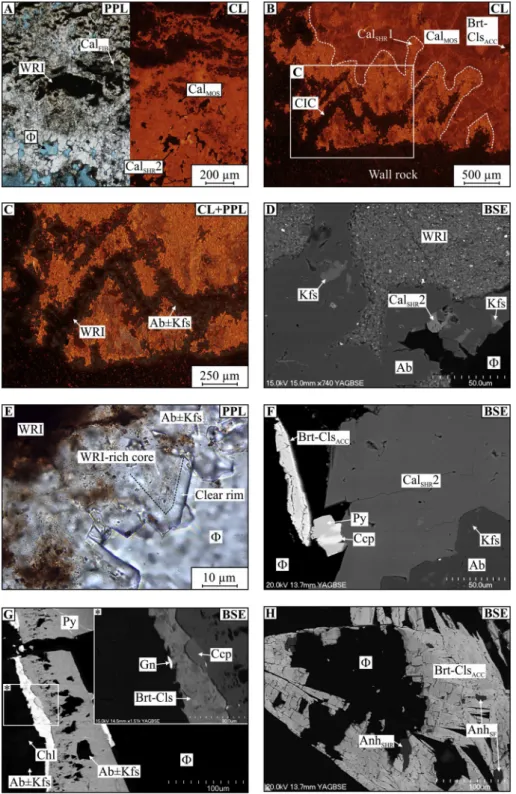
Barite–celestine crystals associated with euhedral pyrite–chalcopyrite crystals of 25-μm size (Fig. 14F) and small galena grains (Fig. 14G) are located within pores of 50-μm to 3-mm size. In most cases, these crystals Fig. 14.Minerals and their microtexture in the VeinCIC from 622.80 to 622.97 m (A, D–G); from 251.56 to 251.73 m (B, C) and from 831.14 to 831.30 m (H) TMD. The fibrous calcite (CalFIB) between wall rock inclusions (WRI), the mosaic calcite (CalMOS) and the subhedral calcite (CalSHR2) crystals along the pore (Φ) walls exhibit uniform orange cath- odoluminescence (CL) colour (A). Different CL char- acteristics in the calcite phase (CalSHR1; B, C) occur around the WRIs and along vein walls with a rela- tively bright orange CL colour. The straight grain boundaries of this phase are indicated by white dashed lines in Figure B. Feldspar (Ab �Kfs) rims around the WRIs arranged as cone-in-cone (CIC) mi- crostructures exhibit no detectable CL colour, as observed in Figure C. Feldspar rims around WRIs contain a small amount of K-feldspar (Kfs) and calcite of subhedral morphology (CalSHR2) in addition to albite (D). The grains of the rims have solid inclusion- rich cores followed by clear mineral zones; the boundary between the two zones is indicated by black dashed lines (E). The pores are surrounded by sub- hedral calcite crystals (CalSHR2), and there are acic- ular barite–celestine (Brt-ClsACC) crystals associated with euhedral pyrite–chalcopyrite (Py-Ccp) grains (F). In certain cases, small domains of galena (Gn) can be observed in association with Brt-ClsACC and Py-Ccp crystals. In order to emphasise the presence of Gn, the contrast–brightness parameters were modified during image acquisition of the inset (G). Within intra- crystalline pores of the barite–celestine crystals, sub- hedral (AnhSHR) and space-filling anhydrite (AnhSF) phases can be observed (H). PPL–plane-polarised light; BSE–backscattered electron. (For interpretation of the references to colour in this figure legend, the reader is referred to the Web version of this article.)
have an acicular habit (Brt-ClsACC; Fig. 13B) and lengths from 50 to 550 μm. Barite–celestine is also associated with the dull orange CL CalMOS
phase (Fig. 14B). Dissolved portions of barite–celestine crystals can be partially (or completely) cemented with 5–15-μm subhedral to anhedral anhydrite crystals (AnhSHR; Fig. 14H). In some cases, this anhydrite phase also fills the remaining pore space (AnhSF).
5. Discussion
5.1. Possible formation mechanisms of the VeinCIC
The geometries of individual WRIs within inclusion bands, inclusion trails and CIC microstructures, as well as the occurrence of fibrous crystals (Figs. 1, 9 and 13C), allows the proposition of two different vein formation mechanisms: a) crack-seal process or b) continuous vein growth (Means and Li, 2001; Wiltschko and Morse, 2001; Hilgers and Urai, 2005; Cobbold and Rodrigues, 2007; Cobbold et al., 2013). Most individual WRIs within the veins have folded shapes (Fig. 9). Some connect to vein walls with thin necks and bend towards the centre of the veins (Fig. 9E). These solid inclusions are surrounded by vein-filling minerals, suggesting that partial separation of the WRIs occurred coevally with vein mineralisation. Moreover, if these WRIs had deformed after vein formation, they should have bent uniformly and would show identical shapes. This has not been observed in our samples;
the inclusions instead exhibit various grades of deformation. According to these observations, the solid inclusions have folded and detached from vein walls simultaneously with the opening of the veins.
The interlimb angle of the folded WRIs decreases gradually from the vein walls towards its central zone (Fig. 9C and D). Such continuous solid inclusion deformation (Fig. 9C–E) is problematic to be explained by the crack-seal mechanism. Considering that many small inclusions are the result of small opening increments, whereas relatively large in- clusions indicate larger openings, the adjacent emergence of inclusions
with very different sizes (Fig. 9E) also cannot be explained by the crack- sealing mechanism.
Based on the fold geometry of WRIs, the presence of CIC micro- structures, and the partial separation of solid inclusions from the vein walls, the generation of the solid inclusions appears to be related to continuous deformation (Rutter, 1986; Fossen and Cavalcante, 2017) instead of the episodic crack-seal mechanism. Diffuse WRI boundaries (Fig. 11) suggest that the sediment was poorly consolidated during vein development and that the force of crystallisation was capable of breaking fragments away from the vein walls, deforming them contin- uously during the detachment process and separating the WRIs into individual solid inclusion grains. As there are no signs of plastic defor- mation (e.g. undulose extinction, deformation twinning or low-temperature grain boundary migration of detrital quartz and feld- spars) of WRIs, the mechanism of ductile-style deformation is presum- ably brittle (frictional), which typically occurs in poorly consolidated porous rocks and sediments (Fossen, 2010).
In summary, continuous vein growth appears to have been the most important mechanism of vein formation and satisfactorily explains the formation of characteristic WRI arrangements and the folded shape of the solid inclusions (Hilgers and Urai, 2005). The ductile-style defor- mation of the WRIs (and the vein formation itself) possibly occurred within a low-cohesion sediment.
5.2. Interpretation of microstructures and crystal morphologies in the VeinCIC
As shown above, curved solid inclusions or inclusion trails, inclusion bands and CIC-like arrangements of WRIs (Figs. 9 and 10) suggest continuous vein growth mechanism. Continuous deformation results in the constant growth of crystals, or vice versa: the constant growth of crystals causes continuous deformation. Owing to the constant growth and lack of open space during crystallisation, growth competition Fig. 15. Representative element distribution across a VeinCIC-wall rock boundary zone. Micro X-ray fluorescence (μXRF) maps show the distributions of Ca, Fe, Al, Si and Ba within the selected boundary domain. Due to the co-occurrence or anti-correlation of certain elements, a quasi-phase distribution map was constructed using the Ca–Fe–Si element maps sandwiched together (F). From this composite image, it is obvious that cone-in-cone domains of the VeinCIC consist of WRIs surrounded by albite �K-feldspar rim (251.56–251.73 m TMD).
between the crystals is suppressed and crystals precipitate with fibrous morphology (Bons, 2000; Hilgers et al., 2001). The fibrous habit does not depend on the chemical composition and specific crystal structure of minerals (Passchier and Trouw, 2005).
The observed fibrous calcite crystals (CalFIB) with smooth grain boundaries can be associated with continuous vein growth (Hilgers and Urai, 2005; Bons et al., 2012). However, based on textural relations (e.g.
gradual transition from fibrous to mosaic grains; Figs. 13C and 14A) and uniform CL characteristics (Fig. 14A and B), the CalFIB is cogenetic with CalSHR2 and associated mineral phases, which were formed after the Ab
�Kfs, Chl, Py-Ccp and CalSHR1 crystals postdating the formation of CIC structures. Consequently, CalFIB is presumably not synkinematic with the development of the vein microstructure. Thus, it is necessary to hypothesise an early fibrous phase that is no longer present in the veins.
CalFIB is potentially the pseudomorph of this earlier, fibrous mineral phase that characterised the entirety of the vein before replacement processes occurred. Based on these considerations, vein development
can be divided into four stages:
(1) WRIs were detached from the vein walls (Fig. 9C, D, E), and CIC microstructures were formed (Figs. 9B and 10) because of growing fibrous crystals that filled the veins completely (Fig. 16A and B).
(2) Fibrous crystals were replaced (Fig. 16C and D) by albite �K- feldspar (Fig. 14D, G), chlorite, pyrite–chalcopyrite (Py-Ccp;
Fig. 14G) and subhedral calcite (CalSHR1) crystals (Fig. 14B and C). The relatively early, cogenetic precipitation of these minerals is evidenced by their close contact with WRIs and textural relations.
(3) The subhedral (CalSHR2) and fibrous calcite (CalFIB; Fig. 13C) with dull orange CL colour (Fig. 14A), associated with acicular barite–celestine (Brt-ClsACC), Py-Ccp and galena (Gn; Fig. 14F and G) precipitated on CalSHR1 crystals (Fig. 14B) replacing the remaining fibrous vein-filling crystals (Fig. 16E and F).
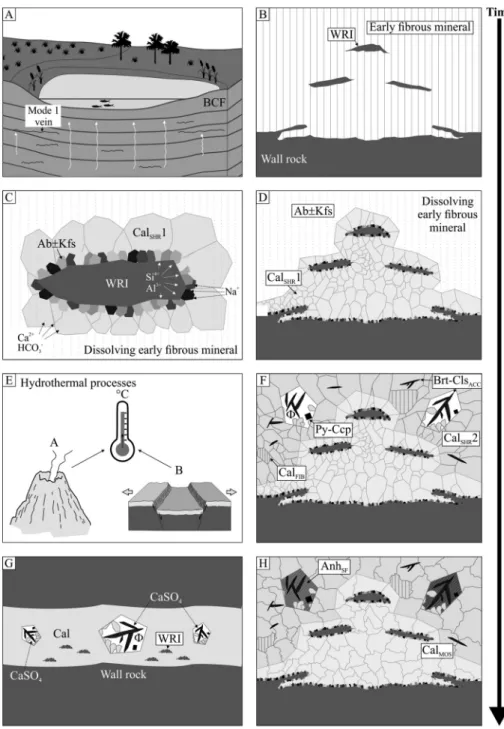
Fig. 16.The potential evolution of the CIC- containing veins in the Boda Claystone Formation (BCF). A and B–Due to compaction, pressure solution, vertical fluid movement and force of crystallisation, veins were formed in the siliciclastic sediment. Dur- ing the continuous vein formation process, fragments were detached from the wall rock (WRI) and cemen- ted by fibrous crystals. C and D–In a later stage of vein evolution, the early fibrous mineral phase simulta- neously dissolved with the precipitation of feldspar (Ab �Kfs), chlorite, pyrite–chalcopyrite and calcite (CalSHR1) around the WRIs and along the vein walls.
Possible sources of Si4þand Al3þare clay minerals and detrital feldspar. The source of Naþis potentially the dissolving early fibrous mineral phase or hopper halite crystals in the wall rock, whereas Ca2þcould have arrived from dissolved evaporite minerals in the wall rock and/or from detrital plagioclase grains. The HCO3content of the pore fluid reacted with the Ca2þ, forming the calcite mineral phase. E and F–As a result of hydrothermal processes (elevated thermal activity due to magmatic processes or tectonic depression), barite–celestine (Brt-ClsACC) and pyrite–chalcopyrite
� galena (Py-Ccp) precipitated syngenetically with younger calcite (CalSHR2; CalFIB) phases. G and H–During the last evolution stage, anhydrite (AnhSF) filled the remaining pores of the veins and in certain cases replaced the barite–celestine and calcite phases.
A potential source of anhydrite is the dissolution of evaporite minerals from the wall rock.
(4) Anhydrite crystals filled any remaining pore spaces (AnhSF; Fig. 16G and H) and partially replaced Brt-ClsACC crystals (AnhSHR), as observed on subhedral anhydrite crystals within secondary intracrystalline pores of Brt-ClsACC (Fig. 14H).
Feldspar crystals may have precipitated in VeinCIC as a result of albitisation, a process known to have affected the entire BCF during its early diagenetic evolution (Arkai et al., 2000; Varga et al., 2005). The � small WRI particles observed within feldspar crystals (Fig. 14E) suggest that the sediment was still not fully consolidated during this process.
K. T€or€ok (unpublished data) determined the minimum final melting temperatures (Tm) of 17.7 �C and eutectic temperatures (Te) of 23.5
�C and 39.0 �C for primary fluid inclusions in anhydrite–calcite veins of the BCF, which were precipitated from high-salinity (20.8 mass%
NaCleq) H2O–NaCl–CaCl2 solution. Because the presence of an early halite phase in the BCF is proved by pseudomorphs after hopper halite crystals (M�ath�e and Varga, 2012) and the salinity of the fluid inclusions in the vein-forming calcite phase is relatively high, it is possible that the hypothetical early fibrous phase was a highly soluble salt. However, no direct evidence is available, and the high salinity of the fluid inclusions may result from other sources, such as the dissolution of the mentioned hopper crystals or migration of brine along the fractures.
Land and Prezbindowski (1981) proposed a reaction for the origin of saline water in carbonates, which may be responsible for the dissolution of the early halite phase and the precipitation of an albite phase in the VeinCIC, namely, halite þdetrital plagioclase þquartz þwater → albite þNa–Ca–Cl brine.
The mosaic texture (or ‘jigsaw-puzzle’ structure) of calcite was probably formed during the recrystallisation of CalFIB and CalSHR2 crystals (Fig. 16H; Lovering, 1972; Dong et al., 1995). Based on both the euhedral appearance of Py-Ccp crystals and the presence of Gn, the third vein-forming stage could be related to hydrothermal processes (Fig. 16E). A potential Late Triassic–Jurassic sulphidic hydrothermal mineralisation in Permian and Early Triassic lithologies of this region was reported by Fazekas and Vincze (1991), specifically in the southern foreland of the BAF–2 well.
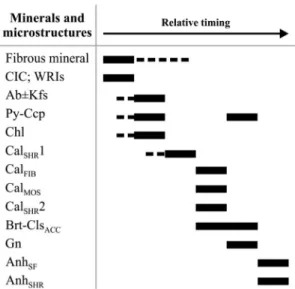
The paragenetic sequence of the observed and inferred vein-filling minerals in the VeinCIC is detailed in Fig. 17.
5.3. Orientation and failure mode of the VeinCIC
In some drill core samples, the members of VeinCIC generation are observed to be sub-parallel (difference <5�) to bedding. Nevertheless, in
most cases, the bedding cannot be determined at macroscopic scales.
According to acoustic borehole televiewer observations in the BAF–2 well, the average dip angle of the strata is 40� (Bern�ath et al., 2014;
S�amson, 2015), which is roughly equal to the average 42�dip angle of the CIC-containing veins (Hrabovszki et al., 2017). This suggests that the investigated veins formed nearly parallel to bedding; thus, the original direction of the vein planes was horizontal.
Based on the orientation of solid inclusion trails and CIC micro- structures (Figs. 9 and 10), and furthermore, on the relative position of lithoclasts on the vein walls (Fig. 12), VeinCIC can be characterised as cemented Mode I type fractures (e.g. Twiss and Moores, 1992; Van der Pluijm and Marshak, 2004; Fossen, 2010). Accordingly, vein widening occurred perpendicular to the vein walls and under negligible shear stress. The fracture plane was parallel to the maximum effective stress (σ01) and perpendicular to the minimum effective stress (σ03) directions.
Under these circumstances, tensional fractures may develop such that the Mohr circle touches the failure envelope only at one point on the σn axis in the tensional field of the Mohr space. For this situation, the effective and differential stresses (σd) must be relatively low. Low effective stresses can exist in the case of elevated Pf and/or elevated Pfc, whereas small σd is generally found near the surface according to Equation (6):
σd�0:5ρ⋅ g ⋅h; (6)
where ρ is density (representative crustal value of 2700 kg/m3), g is acceleration due to gravity (9.8 m/s2) and h is depth (Van der Pluijm and Marshak, 2004). Small σd can also be achieved in deeper environments owing to seepage forces (details in Chapter 1.2.).
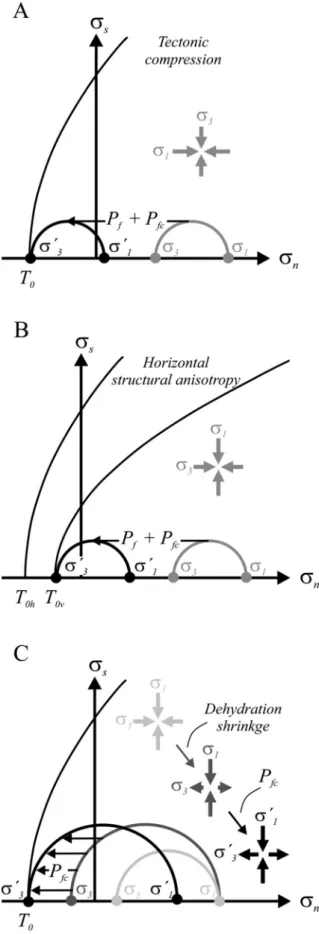
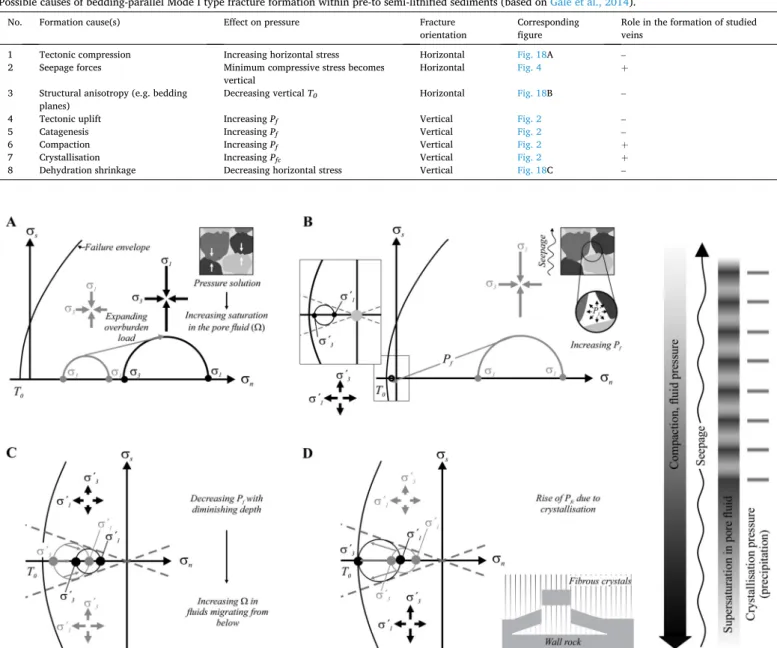
According to Gale et al. (2014), in addition to seepage force mech- anism (Fig. 4), tectonic stresses (Fig. 18A) and tensile strength anisot- ropy (e.g. bedding planes; Fig. 18B; Lash and Engelder, 2005) may engender bedding-parallel vein orientation if elevated Pf and/or Pfc are present. Stress reduction (tectonic uplift; El Tabakh et al., 1998), hy- drocarbon generation during catagenesis (Rodrigues et al., 2009), compaction (Terzaghi et al., 1996), crystallisation pressure (Taber, 1916; Meng et al., 2018a) and dehydration shrinkage (Fig. 18C; Plum- mer and Gostin, 1981), as well as their combinations, can also contribute to vein development (Table 1). The high pore fluid supersaturation required for significant crystallisation pressures can result from evapo- ration close to the surface (Means and Li, 2001; Wiltschko and Morse, 2001) or pressure solution at higher burial depths (Fowler and Yang, 1999; Yang, 2000; Meng et al., 2018b).
Considering that the presently investigated vein generation is the earliest one in the BAF 2 well (Fig. 8; Hrabovszki et al., 2017) and that it was potentially formed within a poorly consolidated sediment by continuous vein opening with contemporaneous crystallisation (details in Chapter 5.1.), it is plausible that CIC veins formed in a tectonically inactive environment. Hydrocarbon generation during catagenesis can also be ruled out because solid and liquid hydrocarbon residues have not been detected in the BCF.
5.4. Processes responsible for continuous vein formation
Based on microstructural observations (e.g. WRI geometries, ar- rangements, boundaries) it can be concluded that VeinCIC was formed by continuous vein growth processes. During vein formation, crystals precipitated synchronously with the opening, and crystal growth was the main reason for vein development by displacive widening. Previous theories explain the origin of horizontal vein orientation, fibrous crystal morphology and CIC microstructure formation, but none of these models satisfactorily explains these features collectively, as is observed in the present case. For this reason, we propose two models that describe possible processes responsible for continuous vein formation along horizontal surfaces at different burial depths in the BCF:
Fig. 17.Paragenetic sequence of the observed and inferred microstructures and vein-filling minerals based on textural relations.
1) Close to the surface (<15 m; Plummer and Gostin, 1981), the dehydration of sediments during evaporation and desiccation pe- riods of the playa mudflat may lead to the concentration and su- persaturation of pore fluid components. This may be supplemented by tensile stress exerted by dehydration shrinkage. The increasing saturation of the pore fluid (Means and Li, 2001; Wiltschko and Morse, 2001) and tensile stress (Plummer and Gostin, 1981) may result in mineral precipitation from the supersaturated pore fluid. As a result, subvertical microveins may develop in the sediment, because the greatest effective stress (σ01) is vertical while the least effective stress (σ03) is horizontal based on the overburden pressure (Fig. 18C). In the presence of horizontal weakness planes (e.g.
bedding), horizontal veins may also develop, i.e.
horizontally-oriented clay mineral flakes along the bedding planes may result in considerably lower tensile strength (T0) normal to bedding than parallel to it (Lash and Engelder, 2005). For example, tensile strength normal to bedding (T0v) in shales may be one-quarter higher than parallel (T0h) to it (Schmidt, 1977). As a result, the growing crystals must exert less pressure vertically along horizontal planes than they would grow horizontally along vertical planes, because σ3 þT0v ≪ σ3 þT0h (Fig. 18B). The fibrous morphology of the crystals may result from suppressed growth competition caused by a lack of open space during crystallisation (Bons, 2000; Hilgers et al., 2001). As a result of precipitation, the saturation of the fluid decreases; however, ongoing evaporation may increase pore fluid saturation again. As long as these processes operate simultaneously (the fibrous crystals are in contact with a supersaturated solution in the wall rock pores), vein opening and crystal growth also operate simultaneously. In the BCF, carbonate and albite pseudomorphs after halite hopper crystals (M�ath�e and Varga, 2012) indicate desiccation periods during sediment deposition. This suggests that the conditions necessary for vein growth according to the outlined model were available. Because the average dip angle of the observed veins (Hrabovszki et al., 2017) is approximately equal to that of the bedding planes (Bern�ath et al., 2014; S�amson, 2015), crystals had an opportunity to grow along these weakness planes as described above.
However, the discussed veins are observed to cut across light-coloured siltstone lithoclasts (Fig. 12), which suggests that tensile strength anisotropy did not play a significant role in their formation. This indicates that their opening did not occur along the former weakness planes.
2) In deeper environments, due to the increasing overburden load, sediments are continuously compressed. This compression does not occur immediately but rather reaches a final value corresponding to the amount of the overburden during a relatively long timescale (Terzaghi et al., 1996). The expanding load enlarges the effective stress in the sediment (Fig. 19A). The increasing effective stress el- evates the degree of pressure solution since the solubility of minerals (caption on next column)
Fig. 18.The influence of tectonic compression (A), horizontal structural anisotropy (B) and dehydration shrinkage (C) on the stress field and thus on the fracture orientation in the presence of elevated fluid (Pf) and/or crystallisation pressures (Pfc). A–As a result of tectonic compression, the horizontal applied stress becomes larger. The elevated Pf þPfc shifts the Mohr circle to the left. If the difference between σ01 and σ03 is low, horizontal tensile fracture forms when the failure envelope is touched by the Mohr circle at a point on the σn axis.
B–The failure envelops pertain vertical (T0v) and horizontal (T0h) tensile strengths in the presence of horizontal structural anisotropy (e.g. bedding planes; based on Vernik, 2016). Due to increasing Pf and/or Pfc, the Mohr circle for effective stress touches the failure envelope for vertical tensile strength as T0v is lower than T0h. If the difference between σ01 and σ03 is low, horizontal tensile fracture forms. C–In response to the ongoing dehydration, tensile stress is exerted increasing the size of the Mohr circle, which enters the tensional field of the Mohr space. Due to Pfc, the Mohr circle of the same size shifts leftwards.
Again, if the difference between σ01 and σ03 is small, tensile fracture occurs, now in the vertical direction.
at grain contacts intensifies with increasing effective stress (e.g.
Fowler and Yang, 1999; Yang, 2000). Minerals with a low stress coefficient of solubility (Weyl, 1959; Obika et al., 1992) dissolve most intensively, particularly at greater depths where the sediment is sufficiently compacted. At a later stage, the growing overburden results in developing Pf. The distribution of the Pf is not uniform in the sediment, and potential differences may cause fluid movement.
Highly saturated pore fluid can be squeezed out of the underlying sediments, commonly upward as a result of vertical pressure gradi- ents. A vertical pressure gradient can readily develop in sediments, in which the primary porosity is relatively high (>60%) but degrades
readily with growing burial depth (Dewhurst et al., 1998; Rutter et al., 2017). Because of this fluid movement, seepage forces act on the framework of the sediment (Cobbold and Rodrigues, 2007); the vertical effective stress decreases by the amount of Pf (Figs. 4 and 19B). Because there is no horizontal seepage, horizontal effective stress is unaffected; rather it correlates with the vertical effective stress as shown using Equation (3). As soon as Pf exceeds the amount of pressure generated by the overburden weight, the horizontal effective stress becomes larger than the vertical one. In other words, the greatest effective stress (σ01) becomes horizontal and the least effective stress (σ03) becomes vertical (Figs. 4 and 19B). The Table 1
Possible causes of bedding-parallel Mode I type fracture formation within pre-to semi-lithified sediments (based on Gale et al., 2014).
No. Formation cause(s) Effect on pressure Fracture
orientation Corresponding
figure Role in the formation of studied veins
1 Tectonic compression Increasing horizontal stress Horizontal Fig. 18A –
2 Seepage forces Minimum compressive stress becomes
vertical Horizontal Fig. 4 þ
3 Structural anisotropy (e.g. bedding
planes) Decreasing vertical T0 Horizontal Fig. 18B –
4 Tectonic uplift Increasing Pf Vertical Fig. 2 –
5 Catagenesis Increasing Pf Vertical Fig. 2 –
6 Compaction Increasing Pf Vertical Fig. 2 þ
7 Crystallisation Increasing Pfc Vertical Fig. 2 þ
8 Dehydration shrinkage Decreasing horizontal stress Vertical Fig. 18C –
Fig. 19. Conceptual model of displacive vein formation along horizontal surfaces induced by the effects of pressure solution, fluid overpressure, seepage forces, and crystallisation pressure. The relevant largest and smallest principal stress values are expressed as σ1 and σ3; while grey colour represents the early state of the processes in the subfigures. A–Due to expanding overburden load the sediment is compressed. The size of the Mohr circle increases with the increasing greatest (σ1) and least applied stresses (σ3). At greater depths (i.e. higher stresses) minerals dissolve at grain contacts increasing the saturation in the pore fluid (Ω). B–As the compaction progresses, the fluid pressure (Pf) significantly increases. Because the sediment is anisotropically compacted, a vertical gradient in the Pf induce upward fluid migration (seepage). Seepage forces act against the weight of the overburden, initially reducing the effective stresses and later engendering tensile effective stress. Accordingly, the Mohr circle shifts to the left and decreases in size. The maximum effective stress (σ01) becomes horizontal and the minimum effective stress (σ03) becomes vertical. C–The saturation in the upward-migrating pore fluid increases, while the size of the Mohr circle decreases with decreasing Pf. D–When the pore fluid becomes supersaturated enough, crystals precipitate. In this state, the growing crystals exert pressure (Pfc) equal to σ3 þT0 – Pf. The Mohr circle touches the failure envelop at a point on the σn axis that results in the formation of horizontal veins. The supersaturation in the pore fluid decreases with crystallisation. After precipitation, the supersaturation in the upward-migrating pore fluid increases again, as shown by Figure C.