International Journal of Computing and Digital Systems
ISSN (2210-142X) Int. J. Com. Dig. Sys. 9, No.1 (Jan-2020)
Multiview Visualization of Software Testing Results
Maen Hammad1, Ahmed Fawzi Otoom1, Mustafa Hammad2, Nadera Al-Jawabreh3 and Rawan Abu Seini1
1 Department of Software Engineering, The Hashemite University, Zarqa, Jordan
2Department of Computer Science, University of Bahrain, Sakhir, Bahrain
3 Department of Software Engineering, University of Szeged,Hungary
Received 25 May 2019, Revised 18 Nov. 2019, Accepted 30 Dec. 2019, Published 01 Jan. 2020
Abstract: Software visualization can play a vital role in reducing testing efforts. It can be utilized to help testers in understanding the testing status of the code. This paper proposes a visualization technique to model the results of test cases that applied on object oriented code elements. The proposed visualization help testers to understand and to keep track on test cases and their tested code elements. Five views are proposed to cover different code levels; method, class, package, UML and system. A tool has been developed to automatically manage the software testing process and to generate the data model for the proposed visualizations. The evaluation results showed that the proposed views are useful and helpful in understanding the testing results.
Keywords: Software testing, software visualization, program comprehension.
1. INTRODUCTION
The Software development life cycle (SDLC) guides the project and provides a reliable path for building a successful project that meets customer needs. An important stage in any SDLC is testing which is important for reducing costs associated with defects and for building a quality product. Testing is essential to verify that the software meets its requirements with no hidden bugs.
Software testing is done by large number of test cases.
Almost each method in the project needs to be tested by one or more test case. A set of test cases are generated to cover all combination of requirements and ensuring the code statements are executed correctly. As a result, test cases and their results become difficult to comprehend [1].
Testers consume time and effort to determine the resulting status for all test cases. For example, they need to know the number of failed/passed test cases for each method and to identify the names of classes/packages that have at least one failed method. Moreover, it is not easy for them to keep track on classes and methods that are not tested so far.
Many research approached utilized visualization to model testing information. For example, Cornelissen et al.
[2] visualized testing information based on UML sequence diagram. Another example is the work done by Jones et al. [3]. They visualized tested code statements.
But, there is a need to visualize test cases with their object oriented code elements. Visualizing testing results
combined with tested code elements help testers to quickly understand testing results and locate code components that passed and failed testing. Visualizing the results of test cases as well as the tested code elements supports testers in understanding testing results.
In this paper, we extend and revise our work in [4].
We propose a visualization technique to model test cases and their tested code elements. The proposed visualizations provide useful information about test cases, their results and their locations. Different views are presented to provide information about classes and packages that have been tested. Testers can easily identify the testing status of classes and packages. The proposed views also help testers to determine tested and untested code elements. Five views are proposed. The first view visualizes the tested methods and the number of test cases for each method. The result of each testing case is also shown. The second view is on the class level. It visualizes the testing information for all methods in specific class.
Package view is the third proposed view. It shows all test cases that cover the all package’s classes with their methods. Another view is proposed to provide a summary about testing results in UML compatible way. This view visualizes testing results in the UML class diagram of the class. The fifth view is the system view. It visualizes the information of test cases for all packages and classes.
An automated process, supported by a tool, is also proposed to generate the data model for the proposed http://dx.doi.org/10.12785/ijcds/090105
visualizations. The proposed process can be realized as a testing integrated environment to automatically extract object oriented components, generate test cases, applying testing and visualizing testing results. We utilized the JUnit tool to run the generated testing cases.
The main research contributions of this paper are:
1. A useful and easy to comprehend visualizations.
The goal is to help in understanding and keeping track the results of test cases and their locations in code.
2. A semi-automated and lightweight approach to generate the data model for the proposed visualizations.
3. A tool that realizes the proposed approach to generate the data model by extracting methods, apply testing and connecting them with their test cases.
This paper is organized as follows. Section 2 summarized the main related work in the area. The proposed visualizations are presented in Section 3.
Section 4 presents the automated process for the proposed technique followed by a detailed example in Section 5.
The developed supported tool is presented in Section 6.
The evaluation is presented in Section 7. Section 8 concludes our findings and summarizes our future work.
2. RELATED WORK
Muto et al. [5] suggested an approach to visualize the quality of the software. The proposed approach focuses on visualizing the compatibility between source-code’s implementations and software’s specifications with respect to normal testing, which means unit testing, and static checking. Furthermore, a visualization framework has been proposed in [6]. In this framework, the goal was to help software developers and testers in determining the test-suite’s location, its relationship with the produced source-code, and software artifacts identification that covered by test cases. In a recent work, Urata and Katayama [7] proposed a method to generate testing diagrams. These diagrams are set to visualize all test cases that test the software projects. The proposed method is implemented by combining test case descriptions with UML diagrams.
There are many tools for visualizing software testing data. For example, TeCReV [8] is a graph-based tool that visualizes information related to software test coverage and test redundancies. This tool can be used in many software validation processes, such as fault localization and expanding tests coverage. Moreover, TestQ [9] and ӼSuds [10] tools are also focused on fault localization purpose. Tamisier et al. [11] proposed a tool to visualize test results and uncovered code segments information.
Another tool is presented in [12], which is named ChronoTwigger. This tool generates 2D and 3D
visualizations based on the Beyer’s algorithm converge.
ChronoTwigger targets to visualize co-evolution of software and test files to better understand the relationship between the software development and testing processes.
Dershem et al. [13] proposed a java based tool to visualize class’s components with their relationships. The goal was to simplify the comprehension of the object- oriented models. Moreover, Kang and Bieman [14] used a similar idea and introduced a visualization approach that focuses on visualizing classes and their relationships. The proposed approach can be used to visualize individual class or clustered classes with more attention to classes that are continuously changed. Other examples of similar works can be found in [15][16][17] [18][19].
Jones et al. [3] presented a visualization technique, which is implemented by Spectrum-based color and statement coverage criteria. The target source code is colored based on the test cases execution results. The proposed technique maps the program's statements with passed and failed test cases using colors. A similar method has been proposed by Renieris and Reiss [20]
where the authors suggested a program spectrum-based method for fault localization. In order to consider the execution of the program in a similar runtime context, they match a failing test case with the most similar passing test case.
In other works, visualization techniques are used to visualize the software faults. For example, D'Ambros et al. [21] proposed an approach to visualize the software bugs history with two views; the system radiography and bug watch. The first view is set to identify the most affected areas in the system, while the second one focuses on visualizing the different status of a specific bug.
Oliveira Neto et al. [22] showed that the visualization of diversity information helps in the maintenance and optimization activities.
3. THE PROPOSED VISUALIZATIONS
The proposed visualizations aim to model the results and locations of test cases in classes, methods and packages. Software testers should be able to quickly comprehend the results of their testing, locations of pass/fail test cases, and untested methods.
There are five different views for the proposed visualizations. These views are:
1. Method view. This view visualizes the testing information for a single method. The following information is displayed in this view; method’s name, names and number of test cases, and the result of each test case.
2. Class view. This view visualizes classes in addition to the Method view visualizations.
3. Package view. This view visualizes packages in addition to the Class view visualizations.
4. UML view: this view visualizes testing results by using the UML class diagram of the code.
5. System view: this view provides high level summary about the testing results of all packages in software projects.
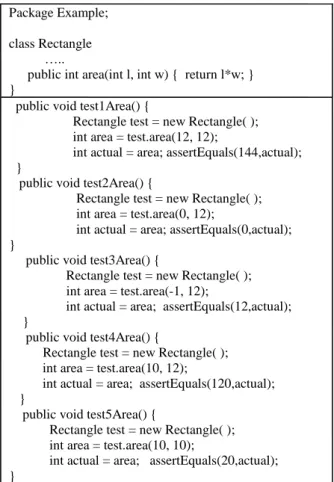
Figure 1. Five test cases for method area in Rectangle class
To clarify the idea, consider the implementation of the area( ) method in Fig. 1. This method calculates the area of a rectangle. Five test cases are designed to test the area() method. These test cases are the five methods;
test1Area(), test2Area(), test3Area(), test4Area() and test5Area(). After running the five testing methods, three of them will pass and the other two will fail. Testing results are reported as in textual format and separated from the area() method. In this paper, the proposed visualizations model the number of applied test cases for each method, their results and the tested code element.
A. Method View
The level of this view is single methods. Testers may need to visualize information about a single method that they are working on. A single column with number of rectangles is displayed that corresponds to a single method. The method’s name is displayed in the first rectangle at the bottom of the column. The remaining
rectangles model the number of test cases. So, the number of rectangles above the method name corresponds to the number of test cases for that method. The name of each test case is also shown in each rectangle. This is necessary to help developers in quick locating the failed test cases.
Fig. 2 shows the proposed method view visualization for the area() method shown in Fig. 1. The method is tested by five test cases. These test cases are the five methods; test1Area(), test2Area(), test3Area(), test4Area(), and test5Area(). Rectangles with red colors indicate failed test cases where passed ones are filled with green color.
test5Area test4Area test3Area test2Area test1Area Method area
Figure 2: Method view visualization of test cases shown in Fig.1 B. Class View
This view shows all test cases for all the class methods. Testers can view the testing status of all methods on the class level. The Class view includes all the visualized information of the Method view but on class level.
Fig. 3 shows an example for a class named C that has four methods named; M1( ), M2( ), M3( ) and M4( ).
Method M1( ) is tested by three methods (i.e. test cases).
The results of two test cases TC1( ) and TC2( ) were passed and it was failed for the third test case TC3( ).
Method M2( ) is tested by three test cases with passed result; TC2( ), TC3( ) and TC5( ). Test cases TC1( ) and TC4( ) failed for method M2( ). Method M3( ) is also tested by the two passed test cases; TC1( ) and TC2( ) in addition to the two failed test cases TC3( ) and TC4( ).
Finally Method M4( ) has no test cases. This means it is not been tested. The color of each rectangle reflects the testing result for each test case. Method M4( ) has no rectangles above it to indicate zero test cases. All the methods of class C are shown above the class name in separate columns.
TC5
TC4 TC4
TC3 TC3 TC3
TC2 TC2 TC2
TC1 TC1 TC1
Method M1 Method M2 Method M3 Method M4 Class C
Figure 3. An example of the Class view visualization Package Example;
class Rectangle …..
public int area(int l, int w) { return l*w; } }
public void test1Area() {
Rectangle test = new Rectangle( );
int area = test.area(12, 12);
int actual = area; assertEquals(144,actual);
}
public void test2Area() {
Rectangle test = new Rectangle( );
int area = test.area(0, 12);
int actual = area; assertEquals(0,actual);
}
public void test3Area() {
Rectangle test = new Rectangle( );
int area = test.area(-1, 12);
int actual = area; assertEquals(12,actual);
}
public void test4Area() {
Rectangle test = new Rectangle( );
int area = test.area(10, 12);
int actual = area; assertEquals(120,actual);
}
public void test5Area() {
Rectangle test = new Rectangle( );
int area = test.area(10, 10);
int actual = area; assertEquals(20,actual);
}
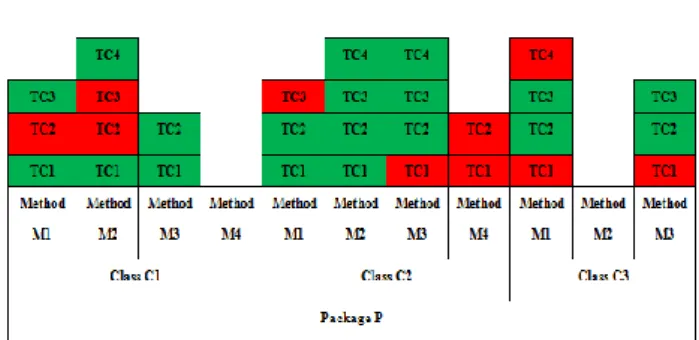
Figure 4. An example of the package view visualization C. Package View
The testing information is visualized on the package level. All the classes of the package are viewed. This view includes both Method and Class views.
Fig. 4 shows an example for the proposed package view visualization. The figure shows the testing information for a package named P. This package has three classes C1, C2, and C3. As shown in the figure, the name of the package is displayed at the first rectangle at the bottom. The classes of the package are displayed in the next above level of rectangles. Next, the methods of each class are displayed. All the three classes are visualized with all their methods and test cases. Methods C1.M4( ) and C3.M2( ) have no colored rectangles to indicate that they have not been tested by any test case.
D. UML View
The UML view visualizes testing results by using the UML class diagram of the code. The name of the method under testing is colored based on testing results. Method names that are colored by red have not passed all test cases. Green color represents methods that are successfully tested by all test cases. Methods that have not been tested are colored by black.
For example, Fig. 5 shows a UML class diagram for a class named Rectangle with three methods. The red color for method area means it failed in testing. Green color for method circumference indicates that this method passed all its test cases. Black color represents incomplete or untested methods.
Figure 5. The UML view for class Rectangle
The class name is also colored based on the testing results of its methods. In case all the methods of a class are successfully tested, the class name is colored by green.
Otherwise, the red color is used to indicate that at least
one of the class's methods did not pass any test case.
Black color means that not all methods have been tested.
Another example, consider the three classes;
Calculation, Calculation1 and Calculation3. The Calculation class has the method findMax that returns the maximum number in an array. The second class Calculation1 has one method called squareNumber. The Calculation3 class has two methods; cube and reverseWord. Suppose that methods findMax and cube passed all test cases generated for them. Also, suppose that the squareNumber method has failed in at least one test case from all the test cases designed for it. Method reverseWord has not been tested yet or its testing is not completed yet. The UML view visualization for the above classes is shown in Fig. 6.
Names of methods that passed all testing results are colored in green (findMax and cube). On the other hand, the names of methods that failed in at least one test case are colored with red (squareNumber). Black color refers to untested methods. The color of the class name is colored with green in case all its methods passed all test cases. In this case, Calculations is shown in green. The black color of Calculations3 means that not all its methods have been tested.
Figure 6. UML view example for three classes
The UML view has the advantage of showing the testing results in a format that is familiar to developers.
Developers are very familiar with UML class diagrams.
They can directly locate tested and not tested methods in one picture. Moreover, they can identify classes that have methods with no successful testing results the names of these methods.
E. System View
System view visualization provides as summary about the testing results for all the packages of the project.
Packages are visualized as UML package diagrams. Sub- packages are also modeled. The name of the package is colored based on the testing results of all methods in the classes of that package. Red color means incomplete or fail test cases in some methods in the package. If all methods in the package have been successfully tested, the package name is colored with green.
As an example, Fig. 7 visualizes the testing results for the three packages; Loans, Accounts and Operations.
Loans is a sub-package for Accounts. Both their names are colored with red to indicate incomplete or fail testing
for at least one of their methods. On the other hand, the red color of the Operation name indicates all its methods have been tested successfully.
Figure 7. An Example for the system view visualization
4. THE AUTOMATED PROCESS
The proposed visualizations need to be automatically modeled and generated to be utilized and applied by testers. So, we propose a lightweight technique to generate the proposed visualizations for the source code under testing. The proposed automated process can be summarized in the following steps:
1. The source code under testing is analyzed to extract methods and their locations
2. The testing process is applied on the extracted methods
3. The testing results are linked to the methods 4. The data model is generated based on the
previous three steps
5. The visualizations for the proposed five views are generated based on the data model
Fig. 8 shows the detailed block diagram for the proposed process and its main components. These components are detailed in the subsections below.
A. The Input
The automated process begins by analyzing the Java source code under testing. The code can be single class, package of classes or a complete project with many packages. The amount and level of input code is determined by testers. Classes with no methods and abstract methods are filtered out.
Figure 8. Block diagram for the proposed automated process
B. Methods Extractions
The code is parsed to extract all methods for testing purposes. To do this, we transform the source code into the XML representation srcML. In srcML [23], each code element is tagged with its syntactic information. srcML can be generated automatically from source code by using the srcML tool from (http://www.srcml.org/). Since srcML is XML format, a set of XPath queries are applied on it to extract all methods for all classes or selected number of classes. This technique has the advantage of parsing and extracting large number of methods with all its related information that may be useful for testing. For each method, the following data are extracted:
The package and class names.
Types for its formal parameters.
Type of its return value.
Method names that it calls.
The following information are also extracted from the source code:
o Packages hierarchy
o Full path for each class (packages/class) This information is stored in a database for possible future use by testers. A set of predefined queries was designed to ease the process of data querying by testers.
For example, they can query about the number of methods, classes and packages. They also can query about code specific code elements as the number of conditional statements in specific method.
C. Generating Test Cases
Testers have the option to select specific classes and methods from the generated database in the previous step.
A list is shown to them that have the names of classes and methods. For each selected method, preliminary test cases are generated using JUnit. The resulted templates of test cases are shown to developers so they can manually update or/and add more test cases. The traceability links between test cases and methods are preserved. Each method is connected to its test cases. Test cases can also be generated by using the unit test generator tool for java Randoop (https://randoop.github.io/randoop). The generated test cases are also shown to developers for manual checking and updating.
D. Running Test Cases
By using the generated test cases, each method is tested and the testing result is recorded as pass or fail.
JUnit (https://junit.org/) is used to run the testing suites on methods under considerations. The obtained result of the testing process is the names of passed and failed test cases for each method. The database of the extracted methods is updated to save the testing results for each method. The database has now important information about the number of test cases for each method, their names and their results as passed or failed. This information is necessary for generating the data model for the views.
Code Methods
Extraction Methods
Test Cases Generator
Test Cases Views
Modeling
Apply Testing Data Model
Models
E. Views Modeling
This component is responsible for generating the data model for the proposed five views. This data model is used to visualize the proposed views. The testing results from running test cases and the database generated from the method extraction step are used to generate the data model. The generated data model is saved in well organized database. So, it can easily accessed by any specialized visualization tool to generate the views. The data model has the following main information:
The dimensions and filling information for rectangles.
The locations and the order of the rectangles needed to represent methods, classes, packages and test cases.
The names and colors for packages, classes and methods that are used to model the UML view.
5. DETAILED EXAMPLE
A detailed example is discussed in this section to clarify the proposed visualizations. The visualized example is a Java package named Shapes that has the classes: Circle and Rectangle.
The Circle class has four methods to be tested;
setRadius, getRadius, getDiameter, and getArea. Method getDiameter has been written incorrectly for the testing purposes. The Rectangle class is the second class in the Shapes package. It has class seven methods that need to be tested. These methods are; getH, getW, getArea, setH, setW and toString.
For testing purposes, two test classes are generated.
One test class for Circle named CircleTest and another one named RectangleTest for the Rectangle class. The CircleTest class has five methods that represent five test cases for the Circle class. Method Circle.getDiameter is tested by two methods; testGetDiameter1 and testGetDiameter2.
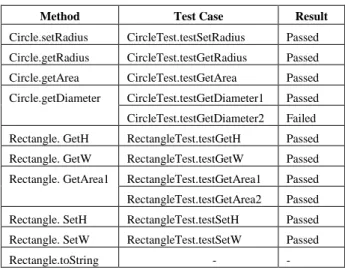
All methods of Rectangle are tested by the methods of RectangleTest except method Rectangle.toString. This method has no test cases. Method Rectangle.getArea is tested by the two test cases; testGetArea1 and testGetArea2. Table 1 lists all methods in both classes
with their generated test cases and the result of running these test cases.
The next step is to run the test cases to get their results as pass or fail. JUnit was used to run apply the test cases.
The execution results of tests are shown in Table 1. All methods passed test cases except the getDiameter method.
The second test case, testGetDiameter2, caused the testing of getDiameter to fail. The package view for the two classes in the package Shapes is shown in Fig. 9. The view includes both; the method and the class views.
TABLE I. METHODS OF CLASSES CIRCLE AND RECTANGLE WITH THEIR TEST CASES.
Method Test Case Result
Circle.setRadius CircleTest.testSetRadius Passed Circle.getRadius CircleTest.testGetRadius Passed Circle.getArea CircleTest.testGetArea Passed Circle.getDiameter CircleTest.testGetDiameter1 Passed CircleTest.testGetDiameter2 Failed Rectangle. GetH RectangleTest.testGetH Passed Rectangle. GetW RectangleTest.testGetW Passed Rectangle. GetArea1 RectangleTest.testGetArea1 Passed RectangleTest.testGetArea2 Passed Rectangle. SetH RectangleTest.testSetH Passed Rectangle. SetW RectangleTest.testSetW Passed
Rectangle.toString - -
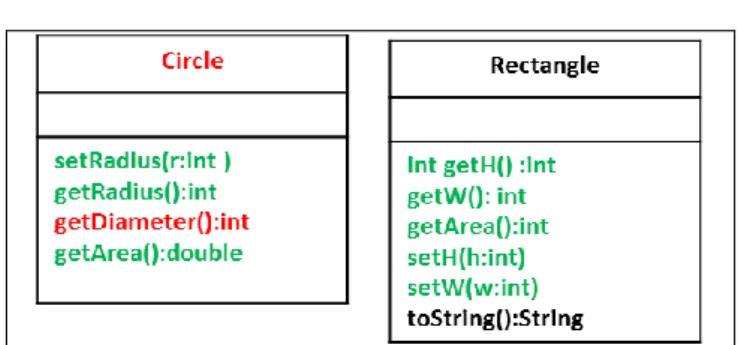
The UML views of the two classes are shown in Fig.
10. The name of Rectangle is shown in black color to indicate incomplete testing for the class. Method Rectangle.toString was not tested. The other class Circle in red to indicate failing testing results in at least one method in the class. Method Circle.getDiameter failed in one test case and hence it is colored in red. The system view of the two classes is shown in Fig. 11. The name of the package Shape is shown in red color to indicate a failing test case in at least one of its classes.
Figure 9. Package view visualization for the package Shapes
testGetDiameter2 testGetArea2
testSetRadius testGetRadius testGetDiameter1 testGetArea testGetH testGetW testGetArea1 testSetH testSetW Method
setRadius
Method getRadius
Method getDiameter
Method getArea
Method getH
Method getW
Method getArea
Method setH
Method setW
Method toString
Class Circle Class Rectangle
Package Shapes
Figure 10. UML views for classes Circle and Rectangle.
Figure 11. The system view for package Shapes
6. TOOL SUPPORT
A tool has been developed to implement the proposed process in Section 4. The tool mainly performs the following tasks:
Extracting methods and their related information from the source code as discussed in Section 4.2.
Providing statistical information about analyzed code as of number of classes and methods.
Generating template testing methods.
Preserving the traceability links between test cases and methods.
Keeping track on the testing results.
Generating the data model of the proposed visualizations.
The input of the tool is a java package or project. The output is the data model for five views. The generated data model is well formatted and organized to make it easy to be read and then rendered by any visualization tool. At this point, the tool generates the data model and does not render the views.
7. EVALUATION
We conducted an experiment to test some hypotheses about the proposed visualizations. In the experiment, we asked programmers to evaluate the usefulness and the effectives of the proposed views in terms of understanding testing results. The hypotheses that were investigated are:
Hypothesis 1: Programmers identify failed/passed testing methods more quickly using the views than not using the views. If the time needed to identify failed
methods using the view is less that the time without the views, then the hypothesis is confirmed.
Hypothesis 2: Programmers identify classes/packages of failed/passed testing methods more quickly using the proposed views than not using them. If the time needed to identify locations using the proposed views is less that the time without the views, then the hypothesis is confirmed.
Hypothesis 3: Programmers identify names and locations of not tested methods more quickly using the views than not using the proposed views. If the time needed to identify names and locations using the proposed views is less that the time without the views, then the hypothesis is confirmed. The experiment was conducted in the following steps:
1. Three java packages were selected from a Java project. The total number of classes in these packages is 5 with 25 methods.
2. 60 test cases were generated for 20 methods. We intentionally designed some test cases to fail for evaluation purposes.
3. The developed tool was used to generate the data model.
4. The proposed views were drawn using a drawing tool based on the generated data model.
5. Four programmers, who are familiar with Java and testing, were selected. They were also divided into two groups, two per group.
6. Group 1 was given the code and the testing results in textual format.
7. Group 2 was given the code and the testing results in graphical format as method, class, package and system views.
8. A set of identical questions were asked to each programmer in both groups and the response time is recorded.
9. For each group, the average response time for the hypothesis related questions was calculated.
Each programmer was asked to answer eight questions that are related to understanding the testing status and results. These questions are:
1. What are the names of all methods that passed all their test cases?
2. What are the names of all methods that failed in at least one test case?
3. What are the names of all methods that were not tested?
4. What are the names of all classes that have at least one failed method?
5. What are the names of all packages that have at least one failed method?
6. What are the names of all classes that have at least one method with no testing?
7. What are the names of all packages that have at least one untested method?
8. What are the names of all packages that completely passed testing?
Table 2 shows the distribution of the eight questions on the hypotheses. Fig. 12 shows the average time in minutes it took the two programmers in each group to answer the questions of each hypothesis. Based on the average time comparison, the three hypotheses were confirmed. The group who has the views answered the questions more quickly than the other group who has only the textual results.
Using the views has reduced the average time for the first two questions related to the fist hypothesis (H1) to one minute. It was two minutes for the other group. For questions four, five and eight (H2), the average time was one and half minutes. Without using the views, it was four minutes.
Answering questions three, six and seven that are related to third hypothesis (H3) took much more time with textual results only. The average time was six minutes.
This is because there are no direct answers for these questions. Developers have to browse the code and test cases to identify and locate methods that have no testing results. With the views, the average time was only two minutes.
TABLE II. DISTRIBUTION OF QUESTION ON HYPOTHESES
Hyp. Questions
Q1 Q2 Q3 Q4 Q5 Q6 Q7 Q8
H1 X X
H2 X X X
H3 X X X
Figure 12. Average time in minutes for each group. Darker column for the group with textual data.
8. CONCLUSIONS AND FUTURE WORK
A visualization approach has been proposed to support the comprehension of testing results. Test cases are shown
together with the tested methods. The proposed visualizations help testers to identify untested methods and their locations in source code. The number of test cases and their testing results are also visualized. Different views are visualized to help in exploring the distribution of test cases over the different levels on the program. The evaluation of the views showed they reduce the comprehension time of understanding the testing results of the code. Our future work aims to include more code elements that are useful for testers as the number of branches and loops.
REFERENCES
[1] Kamimura, M., Murphy, G. C., "Towards generating human- oriented summaries of unit test cases", Proc. of the IEEE 21st International Conference on Program Comprehension (ICPC’13), 2013, pp. 215-218.
[2] Cornelissen, B., van Deursen, A., Moonen, L., and Zaidman, A.,
"Visualizing test-suites to aid in software understanding", Proc. of the 11th European Conference on Software Maintenance and Reengineering, 2007.
[3] Jones, A., Harrold, M. J., Stasko, J., “Visualization of test information to assist fault localization”, Proc. of the 24th International Conference on Software Engineering (ICSE’02), 2002, pp. 467-477.
[4] AF Otoom, M. Hammad, N Al-Jawabreh, RA Seini, "Visualizing Testing Results for Software Projects", in Proc. of the 17th International Arab Conference on Information Technology (ACIT'16), Morocco, 2016.
[5] Muto, Y., Okano, K., Kusumoto, S., "A Visualization Technique for the Passage Rates of Unit Testing and Static Checking with Caller-Callee Relationships ", Proc. of the 2011 9th IEEE International Symposium on Parallel and Distributed Processing with Applications, 2011, pp. 336-341.
[6] Van Rompaey, B., Demeyer , S., "Exploring the composition of unit test suites ", Proc. of the 23rd IEEE/ACM International Conference on Automated Software Engineering (ASE’08), 2008, pp. 11-20.
[7] Urata, S., Katayama, T., "Proposal of Testing Diagrams for Visualizing Test Cases", Proc. of the IEEE 6th International Conference on Software Testing, Verification and Validation (ICST), 2013, pp. 483-484.
[8] Koochakzadeh, N., Garousi, V., "Tecrevis: a tool for test coverage and test redundancy visualization", In Testing–Practice and Research Techniques, Springer Berlin Heidelberg, 2010, pp. 129- 136.
[9] Breugelmans, M., Van Rompaey, B., "TestQ: Exploring structural and maintenance characteristics of unit test suites", Proc. of the 1st International Workshop on Advanced Software Development Tools and Techniques, 2008.
[10] Agrawal, H., Alberi, J. L., Horgan, J. R., Li, J. J., London, S., Wong, W. E., Ghosh, S., and Wilde, N., "Mining system tests to aid software maintenance", Computer, vol. 31, no. 7, 1998, pp.
64–73.
[11] Tamisier, T., Karski, P., Feltz, F., "Visualization of Unit and Selective Regression Software Tests", Cooperative Design, Visualization, and Engineering, Springer Berlin Heidelberg, 2013, pp. 227-230.
[12] Ens, B., Rea, D., Shpaner, R., Hemmati, H., Young, J. E., Irani, P.,
"ChronoTwigger: A Visual Analytics Tool for Understanding Source and Test Co-evolution", Proc. of the Second IEEE Working Conference on Software Visualization (VISSOFT), 2014, pp. 117-126.
[13] Dershem, H. L., Vanderhyde, J., "Java class visualization for teaching object-oriented concepts", ACM SIGCSE Bulletin, Vol.
30, No.. 1, 1998, pp. 53-57.
[14] Kang, B. K., Bieman, J. M., "Using Design Cohesion to Visualize, Quantify, and Restructure Software", SEKE, 1996, pp. 222-229,
[15] Kleyn, M. F. and Gingrich, P. C., “Graphtrace–understanding object oriented systems using concurrently animated views", ACM Sigplan, vol. 23, no. 11, pp. 191-205, 1988.
[16] Knight, C., Munro, M., "Virtual but visible software", Proc. of the IEEE International Conference on Information Visualization, 2000, pp. 198-205.
[17] Pinzger, M., Gall, H., Fischer, M., Lanza, M., "Visualizing multiple evolution metrics", Proc. of the 2005 ACM symposium on Software visualization, 2005, pp. 67-75.
[18] Mustafa Hammad and Adnan Rawashdeh, “A framework to measure and visualize class coupling”, International Journal of Software Engineering and Its Applications, Vol. 8, No. 4, 2014, pp. 137-146.
[19] Maen Hammad and Fatima Abu-Zaitoun, “Visualizing the Evolution of Subsystems”, International Review on Computers and Software, Vol.10, No.8, 2015, pp. 875-882.
[20] Renieres, M., Reiss, S. P., “Fault localization with nearest neighbor queries”. Proc. of 18th IEEE International Conference on Automated Software Engineering, pp. 30-39, 2003.
[21] D'Ambros, M., Lanza, M., and Pinzger, M. “ “A Bug's Life"
Visualizing a Bug Database”. Proc. of 4th IEEE International Workshop on Visualizing Software for Understanding and Analysis, VISSOFT 2007, pp. 113-120, 2007.
[22] Francisco Gomes De Oliveira Neto, Robert Feldt, Robert Feldt, Linda Erlenhov,José Benardi de Souza Nunes, José Benardi de Souza Nunes, “Visualizing Test Diversity to Support Test Optimisation”, Proc. of the 25th Asia-Pacific Software Engineering Conference (APSEC’18), 2018.
[23] Collard, M. L. , Kagdi H. H., Maletic, J. I., “An XML-based lightweight C++ fact extractor,” Proc. of 11th IEEE International Workshop on Program Comprehension (IWPC'03), pp. 134-143, 2003.
Maen Hammad is an Associate Professor in the Software Engineering Department at The Hashemite University, Jordan. He completed his Ph.D. in Computer Science at Kent State University, USA in 2010. He received his Master in computer science from Al- Yarmouk University- Jordan and his B.S.
in Computer Science from The Hashemite University-Jordan. His research interest is Software Engineering with focus on Software Evolution and Maintenance, Program Comprehension and Mining Software Repositories.
Ahmed F. Otoom is currently working as an Associate professor in the Software Engineering department at The Hashemite University, Jordan. He has a PhD degree in Computer Science from the University of Technology, Sydney (UTS), Australia, 2010.
He received his BS in Computer Science from Jordan University of Science and Technology, Jordan, and an MS in Software Engineering from the University Western Sydney, Australia, in 2002 and 2003, respectively. His main research interests include Pattern Recognition Techniques and its applications in the areas of Software Engineering and Image Analysis.
Mustafa Hammad is an Associate Professor in the Department of Computer Science at the University of Bahrain and Mutah University. He received his Ph.D. in Computer Science from New Mexico State University, USA in 2010. He received his Masters degree in Computer Science from Al-Balqa Applied University, Jordan in 2005 and his B.Sc. in Computer Science from The Hashemite University, Jordan in 2002. His research interests include machine learning, software engineering with focus on software analysis and evolution.
Nadera Aljawabrah is a PhD student in the Software Engineering Department at Szeged University, Hungary. Her doctoral research investigates the visualization of software testing. She holds a master’s degree in Software engineering from the Hashemite University, Jordan. She authored the article “Understanding Test-to-Code Traceability Links: The Need for a Better Visualizing Model”, co-authored the article
“Visualizing Testing Results for Software Projects”, and co-authored the article “Towards a comprehensive survey of the requirements elicitation process improvements”.
Rawan Abuseini received her B.Sc.
degree in Computer Information Systems and the MSc degree in Software engineering from the Hashemite University, Zarqa, Jordan, in 2009 and 2015, respectively. In 2011, she joined the Quality Assurance department in Aspire Services in Amman - Jordan as a QA Analyst. In 2016 she held a lecturing position in Computer Science department, Princess Nora University in Riyadh Saudi Arabia. Her current research interests are in software quality and software testing.