User activity recognition on mobile clients for Smart Public Transport Services ∗
Ádám Zsolt Nagy
ab, Gábor Fehér
abBalázs Lajtha
ab, Tamás Szincsák
baBudapest University of Technology and Economics Department of Telecommunication and Media Informatics
feher@tmit.bme.hu,adam.zsolt.nagy@gmail.com lajtha.balazs@tmit.bme.hu
bInter-University Centre for Telecommunications and Informatics sztamas89@gmail.com
Abstract
In the field of smart city mobile applications based on crowdsourced data, the automation of the data collection process is a substantial requirement.
Continuous user interaction can not be expected and feedback heavy solu- tions can discourage the masses from participating. Luckily, the currently available mobile devices already carry the sensors we need and large number of developer tools are at our disposal to overcome this issue. Mobile sensors can provide two important information we can benefit from: the user’s lo- cation and the user’s activity. On a large scale the sensory data may vary due to the diversity of the devices, thus reassurance from the user and strict supervision of collected information can not be neglected. Although a great number of solutions already had come to realization regarding user activity recognition, they usually serve as stand-alone solutions as they are not bind to solve a specific problem. In urban environments these solutions carry a great potential. In this paper we would like to share our experiences in user activity recognition, present a sensory module implemented using the latest Google API-s for Android platform and how can it function as a valuable asset of a Smart Public Transport Service.
Keywords:Smart Cities, Public Transport, Crowdsensing, Participatory Sens- ing, User Activity Recognition
∗Held on the hosted workshop: “Workshop on Smart Applications for Smart Cities”.
Eszterhazy Karoly University of Applied Sciences and Bay Zoltán Nonprofit Ltd. for Applied Research Eger, Hungary, November 5–7, 2014. pp. 135–142
doi: 10.17048/FutureRFID.1.2014.135
135
1. Introduction
In the era of Internet of Things, the penetration of crowd-sourcing applications is increasing. The spread of wearable computing devices open new horizons in the field of pervasive computing. Crowdsourcing systems offer new solutions to problems that otherwise would be resolved by building costly infrastructure or by deployment of information systems. That is the reason why crowd-sourcing plays an important role in Smart City applications. Building on the power of the crowd extends our possibilities. Through smartphones, citizens can contribute to the system thus shape their urban environment. It is a win-win situation for both the urbanites and the city administration[7]. For instance, in public transportation, dynamic timetables, schedule informations, live transit informations, user-reviews, status informations could extend the basic service purely based on participatory sensing (mobile sensing), while the transport agency receives valuable feedbacks and information for the further improvement of the system.
Such a Smart City transportation service intends to collect information through smartphones used as data-collecting agents. Due to the advancements in the mobile industry, today’s devices carry a variety of sensors ranging from position- to several types of environment sensors. As smartphones became commonly used accessories that no ones likes to leave at home, they can provide precious sensory information reflecting traffic conditions. The user’s position, acceleration and speed can only be put to good use if we are also aware of the context: we can connect our mea- surements to specific traffic events. Such context can be obtained automatically by recognizing the user’s current activity: user is on foot, user is not moving, user is in a vehicle, etc. We would like to show that evaluating the chain of detected activities, major traffic events such as stops can be recognized.
In mobile environment this process must be done in an energy-efficient way through the analysation of movement patterns and acceleration data. Several re- searches already have been conducted on this subject with promising results[6, 5, 8].
However, they mostly put the emphasis on the recognition process itself. Our study focuses more on practical approaches and the building-in of the results. Instead of analysing raw acceleration data we started to work on our solution using existing developer API-s for Android platform upon which we developed our own sensory module. This module is created to fit our social public transport information sys- tem, responsible for the recognition of user activity and the gathering of other sensory information. The main goal of this service is to create a city’s complete transit timetable based on user feedbacks.
The rest of the paper is structured as follows. In the first section we present the architecture of our proposed Smart Public Transport Service. It is followed by our implementation of the sensory module, finally by the procession of user context information on server side.
2. The architecture of the Smart Public Transport Service
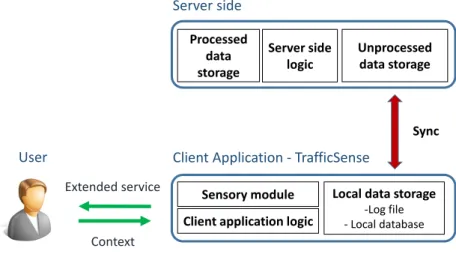
The scheme of aforementioned service can be found on Figure 1. It consists of a server side and client applications (TrafficSense) running on smartphones. We focus on the role of this client application which is responsible for gathering context information from the user. Gathered data is then written into simple text files in csv (comma separated values) format, finally, these logs are sent to the server for evaluation.
Client Application - TrafficSense
Client application logic
Sensory module Local data storage -Log file - Local database
Server side
Unprocessed data storage Server side
logic Processed
data storage
Sync
Extended service
Context User
Figure 1: Scheme of our proposed Smart Public Transport Service
3. TrafficSense
3.1. Acquisition of user activity data
In order to exploit available best practices, the sensory module has been created using Activity Recognition API and Location API included in the GooglePlaySer- vices library[3]. As it provides the input upon which the detection logic is built, it’s purpose is to collect all the related sensory information available on the user’s device. Upon further investigation of technical constraints and possibilities pro- vided by the API-s, we concluded that the following attributes are valuable for automatic detection of traffic events: the user’s physical activity, user’s location and the detection of a significant motion.
Recognized user activity is the most precious information we can acquire through the sensors. The best and most energy efficient approach to do this is to analyse
acceleration data. However, with the User Activity Recognition API evaluation of raw sensor data is not necessary because processed results are sent through a registered Google client object. The received data object contains the result of the evaluation procedure, which is hidden from the developers. The API allows us to distinguish 8 types of clearly detectable user activities (including “activity unknown” and “user is tilting the phone”), amongst which 4 is in the focus of our interest as they are reflecting the movement-activities of a travelling person:
• User is walking
• User is running
• User is in a vehicle
• User is still (not moving)
In the received result object a set of detected activities are present as they could also fit the same movement pattern with a certain probability. To increase the utility of the detected activity events for our service, we break down the results to 2 components:
• User activity: detected activity with the highest probability
• User state: is user moving or not (still or moving?)
Determining whether the user is moving or not comes from examining the prob- ability of “user is still” activity in the set of results. As these 2 states exclude each other, the probability of moving is simply calculated 1−Pstill. Certain traffic events can be evaluated relying only on this chunk of information. As shown in another section of this document, a great number of physical public transportation stops can be located based only on this attribute.
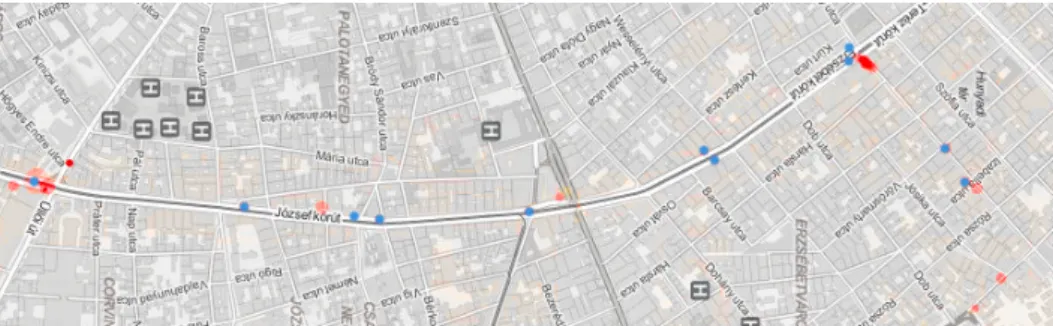
Paired with geolocation data, the phases of a travelling session can be observed and tracked on a map, for example: the user is walking, then stops, gets in a vehicle, then multiple stop/in vehicle events change one another, then user starts to walk etc.. This way, user activities are bonded to physical locations making it capable to detect stops, possible trips, line interconnections even real-time traffic informations. In crowded cities the distances of public transport related events happen close to one another thus the confidence of the measured location data should not exceed a couple of meters in order to be able to separate them. Other- wise, the uncertainty of measured data (detected activities for example) is too big and can not be accurately pinpointed on the map. Examples for user activitis with different accuracies are presented on Figure 2. GPS is the only location sensor that can provide such accuracy, if the connection with the satellites is not disrupted.
This issue still persists in heavily urbanized environments because GPS signal gets lost too often which is caused by tall buildings or underground travelling. Wifi/cell based positioning is also used, however their accuracy may vary. Another setback of always querying the sensor for the best available location (via GPS for example) is the issue of power consumption.
(a) Located user activities
with bad accuracy (b) Located user activities with high accuracy
Figure 2: Visualized log files
Above Android level 4.3 a composite sensor called significant motion sensor is available[4]. Being a one shot-sensor (trigger), it goes off when the user makes a movement that can lead to a change in the user’s location. It is mostly used for improving battery life in location based services by turning off sensors during idle states. However it can be used as a stop detector as well. If a certain amount of time passes after setting the trigger and it still does not fire off possibly means the user is not moving. Most often in this case the mobile phone is away from the user. This method provides better results for stop detection than the one based on the Activity API yet we decided not to use this approach in our service. On the distribution chart about 35% of the Android operation systems are above 4.3 which means most of the users would not be able to participate[1].
The way participants use their phones also affects the quality of activity recog- nition. Previous studies already proved that phones held in trouser pockets produce more accurate activity results than phones carried in hand[5, 6, 8]. Most of the time users only take out their phones to do something actively with it: browsing, chatting, playing, calling etc. Thus we presume that annotating the activity data with “screen on” and “screen off” events could separate these two cases and give a better understanding of the results.
3.2. Energy consumption of the application
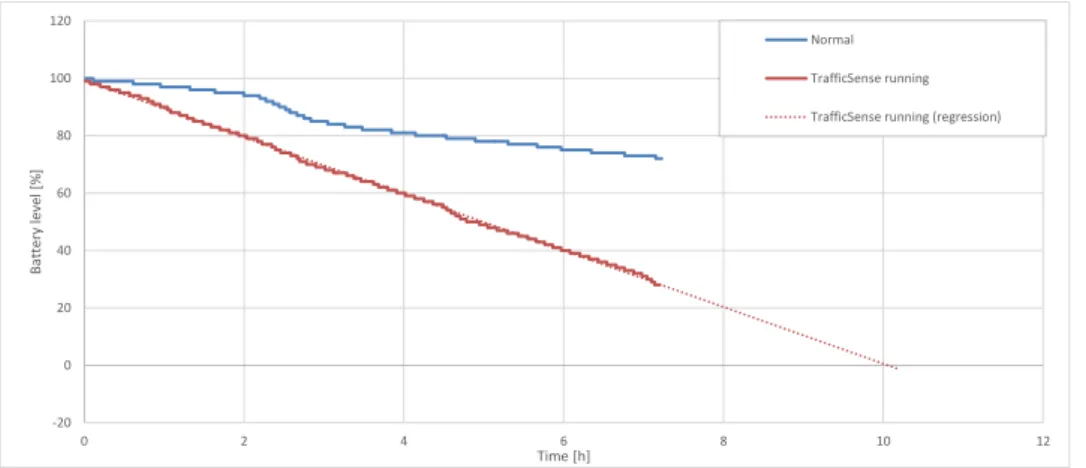
We experienced a minor setback in battery life when letting continuously run the client application in the background. All sensors operate with the highest sam- pling rate, using GPS location whenever it is possible to produce the most accurate results for baseline measurements. Even if the most recent Android systems im-
plement impressive power saving strategies (turning off sensors when idle, or user is still) battery drainage is still significant. The measured battery life is about 10 hours which leads to a very unpleasant user experience. The battery life is depicted on Figure 3. As a solution we automatically tune sensors based on battery level thresholds.
-20 0 20 40 60 80 100 120
0 2 4 6 8 10 12
Battery level [%]
Time [h]
Normal TrafficSense running TrafficSense running (regression)
Figure 3: The application’s impact on battery life. Tool: Trepn profiler plugin for Eclipse. Device: Nexus 4, Android 5.0 “Lollipop”
4. Procession of activity related data on server side
The set of activity data that come from users are processed on server side. As the continuously sent data contains always just a tiny piece of information on the examined area, it means they are only worth to be processed batched with other ones. The storage of incoming reports is taking place continuously, while processing only happens periodically. At the moment we are trying to identify the position of the stations from the data. For this purpose, the detected user activity is being used as well as the coordinates and the accuracy of the measurements. The received log files containing the results are annotated with timestamp, however, the records are not necessarily written in historical order so they have to be sorted. In order to detect possible stations/stops, we are looking for transitions in the activity,
“activity edges”, which are the following:
• transition between still - in vehicle
• transition between walking - in vehicle
• transition between running - in vehicle
The states or the “user is still” activity itself is not enough because during quick transfers it may happen that the passenger does not stop at all. As the deter- mination of user location also happens by cell/wifi, in order to prevent distortion
of results caused by inaccurate inputs, there is an accuracy limit (which is now set to 100 meters), above which measurements are discarded. Entries satisfying the criteria are put into the database by the following method: the probability that a circle (represented by a center of latitude and longitude and the radius as the accuracy in meters) marks a station/stop is inversely proportional to its area.
These “circles” may overlap each other and the more frequently they occur in a place, the more certain that those places are real stations or other stop locations (for example: crossroad). In order the system to be reliable, a sufficiently large user-base is required, whose daily communal activities cover as much segment of the city as possible.
The task which is estimated to be the most resource-requiring is the recognition of the potential stations amongst the collected “station-circles”. In order to decrease the number of calculations required, we decided to rasterize the area (segment of the city) which needs to be observed. The raster points are square-shaped in ideal case and they are big enough so that the error of the procedure is still moving between acceptable limits (comparable to the mistake of a good GPS sign). The mapping of coordinates to grid points have been made by EPSG 3857 projection, which is an approximation of the Mercator projection[2]. The zoom level can be adjusted, we set it to 15 based on the tests. The size of the tile is256×256, according to the industrial standard. This fulfils our earlier criterion in the territory of Hungary:
one grid point is around3.8×3.8 meters big. We store two values per grid point:
the chance a station can be found at that point (32 bit float), and the number of measurements used to calculate the probability (32 bit integer). In this manner, the size of a tile is exactly 512 kB. One of the main advantage of the solution is that the area which needs to be processed is not required to be defined in advance, the tiles can be created as needed. Another advantage is that the results can be projected one-to-one onto any layers of publicly accessible maps (Google Maps, OpenStreetMap, etc.) without doing any additional processing. An example for mapping is preneted on Figure 4.
Figure 4: Results for a single trip with one transfer. Estimated location of stops (red) compared to the real location of stops (blue)
5. Conclusion
We came to conclusion that the detection of stops and transits is possible, however further evaluation of results is necessary. The perfect trade-off between acceptable sensor information and low battery consumption is yet to be determined in order to maximize user experience and increase the everyday-usability of the application.
The development of a “reassurance” module is in sight, which actively involves the user in the data collection process, thus manual reassurance of events greatly increase the detectability of stops or transits. Our client application is already publicly available for download so the collection of real data has begun. For the implementation of our client we only used tools which are freely available and easy- to-use, demonstrating a very practical approach. As of today, the communication between the server and client only goes one way. We hope that if enough partici- pants contribute and share information, we can provide an unremarkable extended public transport service and create online timetables for any city.
Acknowledgment
The publication was supported by the TAMOP-4.2.2.C-11/1/KONV-2012-0001 project.
References
[1] Android version distribution. https://developer.android.com/about/dashboards/
index.html?utm_source=ausdroid.net#Platform. Accessed: 2014-12-06.
[2] Epsg 3857. http://spatialreference.org/ref/sr-org/6864/. Accessed: 2014-10- 06.
[3] Google api-s. https://developer.android.com/google/play-services/location.
html. Accessed: 2014-12-06.
[4] Significant motion sensor. http://source.android.com/devices/sensors/sensor- types.html#significant_motion. Accessed: 2014-12-06.
[5] Ling Bao and Stephen S. Intille. Activity recognition from user-annotated acceleration data. InProc. Pervasive (2004), pages 1–17, 2004.
[6] Jonathan Lester Tanzeem Choudhury Gaetano Borriello. A practical approach to recognizing physical activities. InProc. Pervasive 2006, pages 1–16, 2006.
[7] R. Szabo K. Farkas M. Ispany A.A. Benczur N. Batfai P. Jeszenszky S. Laki A. Vagner L. Kollar Cs. Sidlo R. Besenczi M. Smajda G. Kover T. Szincsak T. Kadek M. Kosa A. Adamko I. Lendak B. Wiandt T. Tomas A. Zs. Nagy G. Feher. Framework for smart city applications based on participatory sensing. In CogInfoCom 2013, 4th IEEE International Conference on Cognitive Infocommunications, 2013.
[8] Jennifer R. Kwapisz Gary M. Weiss Samuel A. Moore. A practical approach to rec- ognizing physical activities. SIGKDD Explorations, 14:74–82, 2010.