Agricultural labour force in the Southern Great Plain1
Erika Weber, PhD student, University of Pécs Faculty of Business and Economics, Doctoral School in Regional Policy and Economics
Abstract
Aim of the research is to uncover and present the operational features and possibilities of the Southern Great Plain region’s agriculture. Regarding to this in my lecture I will analyse the changes of the agricultural labour force from 1990’s till present. In 1980 20 % of employees, in 2012 only 5,2 % worked in agriculture. Before the change of the regime, the large-scale farms used to have significant employment potential, but nowadays they have changed or eliminated , so a significant part of previous workers have become unemployed, inactive, or they are looking for working places in other sectors of the economy. In many cases the former workers are still related to the sector in form of a part-time job, thus the analysis of their agricultural activities is an important part of the research as well. In the study I present the changes of the agricultural labour force in this region based on statistical databases and revealed data from a questionnaire survey.
Key words: agriculture, Southern Great Plain, agricultural labour force
Introduction
The analysed area is located in the periphery of the country, it belongs to the least developed regions of the European Union, so its purpose is to move forward and increase the competitiveness and employment by taking into consideration the living conditions of the population. The Southern Great Plain region is basically a rural region. Out of the Hungarian regions this is the region where the share of agriculture in the GDP is the highest and the agricultural employment rate is thehighest as well.
The employment and unemployment are important economic indicators, roots of which are in the basic economic assumptions that the production is determined by three factors: capital, labour and natural facilities. For this reason, the indicators are carrying important information about the economic system. It is important to examine in particular the composition of employment in the agrarian sector, because in spite of the decreasing share of agriculture, it will be a dynamic factor in the growth of national income as other sectors. [Schultz 1983].
Aim of the study is to uncover the problems and possibilities of the change of the agricultural labour in the region after the change of the regime, compared to the region’s settlement, population density and education of the population. Regarding to this in my lecture I will analyse the changes of the agricultural labour force from 1990’s till present. I am looking for the answer for which economic and social factors had the greatest impact on the production of the small-scale farmers after the transformation or elimination of the purchasers after the change of the regime and what market opportunities are remained or formed. A questionnaire survey is also part of the research, in which participants are small-scale farmers from the Southern Great Plain Region, who are directly experiencing the changes and their effects.
In the study I present the changes of the agricultural labour force in this region based on statistical databases and revealed data from a questionnaire survey. The importance of the
1 This research was supported by the European Union and the State of Hungary, co-financed by the European Social Fund in the framework of TÁMOP 4.2.4. A/2-11-1-2012-0001
‘National Excellence Program’.
research is emphasized by the fact that the Southern Great Plain possesses good conditions regarding agricultural production factors and the agriculture and the related industries are playing also a great part in economic and social life of the region nowadays, so this region is important areas from the point of view of agricultural labour force analyse.
Facilities of the Southern Great Plain region
The Southern Great Plain region has few, but large settlements, from 254 settlements 53 are towns. There are not clearly established centres apart from the county seats and some big cities, the sub-region centres with low population have only a town status. These towns often have no urban functions, with the exception of administrative tasks. In addition homesteads have a significant impact in the Great Plain being integral part of the settlements, thus they cannot be developed separately from them.
The inter-relationships of the settlements have been transformed in the region after the change of the regime. The relationship between the towns and the surrounding settlements became more important in the development of the regional processes. The Southern Great Plain region has a rare settlement network, but a thick urban one. The urban network with catchment area cannot be clearly identified, because there are no significant differences between the settlements. [Csatári, 2004.]
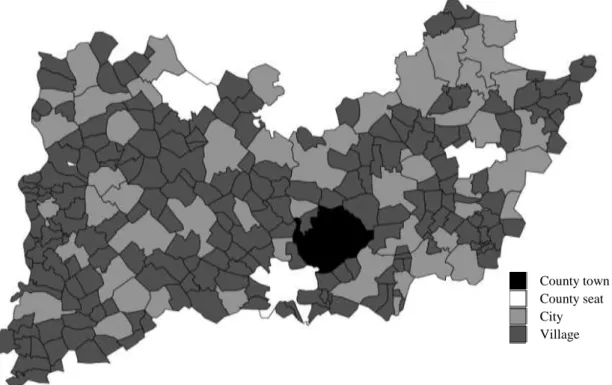
Figure 1: The urban network of the region (2013)
Source: Own editing, based on KSH data
However, the central role of the cities is not only influenced by the spatial structure, but it has a significant impact on the employment. The labour migration is directed from the rural, mostly agricultural areas to urban regions, which have significant effects on the number of agricultural employment in the villages. In the case of county seats and major cities it can be observed that they distract the workers from the neighbouring villages majority of the population is commuting, so they do not participate in the local production. The population density also significantly affects the land use. The importance of land management is bigger
County town County seat City Village
in the more densely populated areas. While in the lower population density areas the extensive nature utilization dominates, in these areas significant regional differences may occur due to the potential concentration of the population and the economy. [Korompai, 2013.]
The Southern Great Plain region has a low population density next to its dense settlement network. The population density was lower than the national average in case of both analysed years. In 2001 the national average was 109.6 km2, which approached mostly the population density of Csongrád, but this was lower than the county average, too. In 2011 the average population density was 107.3 people per km2 in Hungary, which also did not achieve any analysed county. The largest decrease was in Békés County in the analysed 10 years.
Table 1: The area, total population and population density of the regions (2001-2011)
Source: Own editing and calculations, based on KSH data
It can be concluded from the low – the less than national average – population density of the analysed region that the sectors which space requirements for the productivity is higher play a major role in the area. The agriculture may have a higher economic potential in the areas with low population density if the natural conditions are given, too.
Table 2: Rate of the educational attainment of the population in the regions (1990-2011)
Source: Own editing, based on census data
Beside the spatial characteristics the qualification of the population and labour force plays an essential role from the point of view of the working capacity and work efficiency. The qualification of the population in the analysed region was under the national average. If the counties were examined separately, Csongrád County is keeping the national level. However,
Area (km2) Population (people)
Population density (people per
km2)
Area (km2) Population (people)
Population density (people per
km2)
Bács-Kiskun 8445,15 547954 64,88 8444,83 524841 62,15
Békés 5631,05 401919 71,38 5629,72 361802 64,27
Csongrád 4262,68 430514 101,00 4262,71 421827 98,96
Southern
Great Plain 18338,88 1380387 75,27 18337,26 1308470 71,36
2001 2011
not completed the first year
of elementary
school
minimum 8 completed
year of primary school
Minimum graduation
College/
university not completed the first year
of elementary
school
minimum 8 completed
year of primary school
Minimum graduation
College/
university not completed the first year
of elementary
school
minimum 8 completed
year of primary school
Minimum graduation
College/
university
Bács-Kiskun 1,5% 73,2% 21,6% 7,0% 0,8% 85,8% 28,9% 9,0% 0,6% 93,5% 38,9% 13,6%
Békés 1,1% 72,6% 23,4% 6,6% 0,6% 85,4% 30,1% 8,1% 0,6% 93,6% 40,6% 12,9%
Csongrád 1,0% 77,6% 28,6% 9,4% 0,4% 89,4% 38,6% 12,5% 0,5% 95,6% 49,9% 18,7%
Southern Great Plain average
1,2% 74,5% 24,5% 7,7% 0,6% 86,9% 32,5% 9,9% 0,6% 94,2% 43,1% 15,1%
Hungary 1,2% 78,1% 29,2% 10,1% 0,7% 88,8% 38,2% 12,6% 0,6% 95,1% 49,0% 19,0%
1990 2001 2011
the country-specific changes can be observed in the case of region and counties. Compared to the 1990’s level more than 90% of the population completed primary school. The rate of the people with a college or university degree is the highest in Csongrád County, but still this rate is under the national average, and the lowest is in Békés County. The greatest improvement occurred in case of the university and college degree.
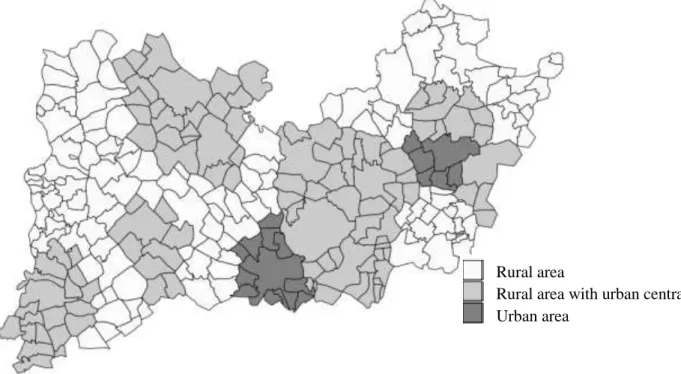
The foregoing data also shows that the region is basically a rural area, with low population density and population with lower educational qualification than the national average. Based on the region's settlement network and the population density of the sub-regions there are only two urban sub-regions, the other 23 sub-regions are rural areas out of which there are ten which do not have urban centre.
Figure 2: Rural character of the sub-regions in the Southern Great Plain
Source: Own editing, based on Regional Development Operational Programme of the Southern Great Plain
Changing the number of the agricultural employments in the analysed region after the change of the regime
In Hungary and also in the analysed region the agriculture played a major role in employment for a long time. In 1990 15,5 % of employees worked in agriculture in Hungary, but in the Southern Great Plain region this rate was higher. Nowadays the share of agricultural employment is decreasing: 9,87 % is its rate in the Southern Great Plain region, which is higher compared to national average and the other counties’ share.
Rural area
Rural area with urban central Urban area
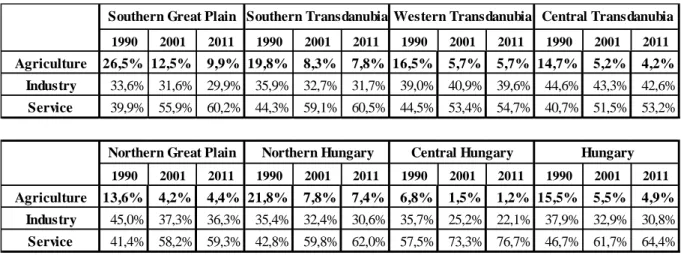
Table 3: Rate of the employments according to sector of the national economy (2011-2011)
Source: Own editing, based on KSH and census data
The change of the regime has left a track in agricultural production and employment, which came from the transformation of the producer organizations and the lost markets. The production capacities are mostly maintained, but the devices of the large-scale production could not infuse their original function by moving to the new owners. In addition, a serious problem was the loss of eastern markets, which have significantly decreased the domestic agricultural export opportunities. [Székely, 2012.]
Before the change of the regime, the large-scale farms (state farms and cooperatives) used to have significant employment potential, but nowadays they have changed or eliminated due to the privatization processes, so a significant part of previous workers have become unemployed, inactive or they are looking for working places in other sectors of the economy.
The real losers of the agricultural structural change were the previous workers with low educational qualification, because most of them did not have appropriate knowledge and skills to find a job in industrial or service sector. [Nagy, 2004.]
After 1990 a structural transformation occurred. The small industrialist and retailers who became self-employed by the evolved difficult situation became completely vulnerable. For the peasants separated from the cooperatives posed a serious threat to perform the supplier- seller tasks in the new market conditions, because there was no protection against the purchaser, mostly foreign interested companies. [Fekete, 2009] The new operators were less competitive alone; they had few resources and were less fluent. Most of the agricultural producers have a slight market share which does not allow the wide range of applications of the self product development, the price influence and the sales promotions. [Lehota – Tomcsányi, 1994.]
The agricultural stakeholders were transformed, formed similar to the country trend in the analysed region. In the past few years, the number of individual entrepreneurs has started to rise. This was partly due to the separation from the cooperatives and on the other hand because of the change of the law regulations. Most of the individual entrepreneurs were previously employed in cooperatives, therefore the decrease in the number of main workers does not give an accurate picture of the social role of the agricultural sector. In addition, the loss of agricultural jobs did not necessarily mean the termination of their relationship with the sector. In many cases the former workers are still related to the sector in form of part-time jobs. The fact should be taken into consideration that the family members do not always show up in the statistics regarding the individual and family holdings. [Székely, 2012.]
1990 2001 2011 1990 2001 2011 1990 2001 2011 1990 2001 2011 Agriculture 26,5% 12,5% 9,9% 19,8% 8,3% 7,8% 16,5% 5,7% 5,7% 14,7% 5,2% 4,2%
Industry 33,6% 31,6% 29,9% 35,9% 32,7% 31,7% 39,0% 40,9% 39,6% 44,6% 43,3% 42,6%
Service 39,9% 55,9% 60,2% 44,3% 59,1% 60,5% 44,5% 53,4% 54,7% 40,7% 51,5% 53,2%
1990 2001 2011 1990 2001 2011 1990 2001 2011 1990 2001 2011 Agriculture 13,6% 4,2% 4,4% 21,8% 7,8% 7,4% 6,8% 1,5% 1,2% 15,5% 5,5% 4,9%
Industry 45,0% 37,3% 36,3% 35,4% 32,4% 30,6% 35,7% 25,2% 22,1% 37,9% 32,9% 30,8%
Service 41,4% 58,2% 59,3% 42,8% 59,8% 62,0% 57,5% 73,3% 76,7% 46,7% 61,7% 64,4%
Northern Great Plain Northern Hungary Central Hungary Hungary Southern Great Plain Southern Transdanubia Western Transdanubia Central Transdanubia
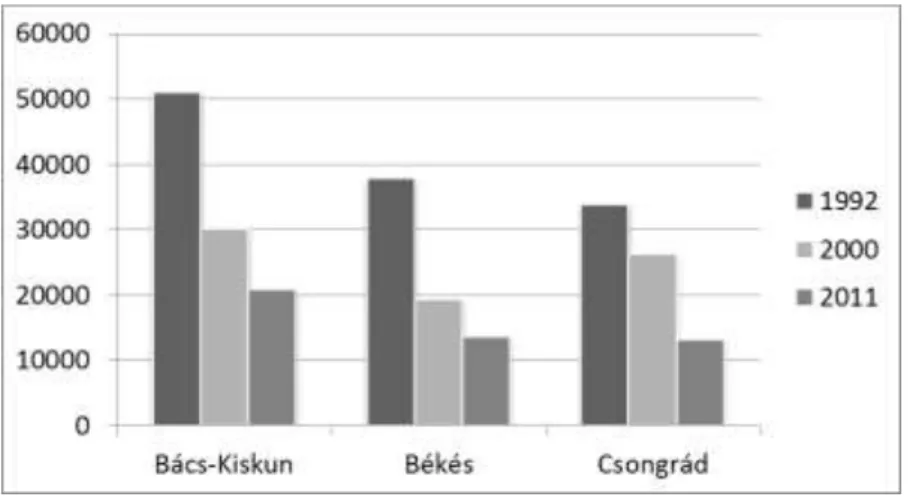
In the analysed region the number of agricultural workers decreased substantially according to national trends. In 1992 more than 50 thousand people, in 2011 only 20 thousand people worked in agriculture in Bács-Kiskun County. The largest decrease was in this county based on the nominal data, however, here is still the highest the number of the agricultural workers.
The less problem occurred in Csongrád County after the change of the regime, while in Békés County by the year 2000 the number of employed decreased by half. However, in the 2000’s the agricultural employment also in Csongrád County decreased drastically.
Figure 3: The number of the agricultural employees in the region (1992-2011)
Source: Own editing, based on TEIR data
The share of the agricultural employees in the working-age population was also significantly reduced in the analysed period. In the Millennium their proportion was 7,9 % in the Southern Great Plain region, while after eleven years it was only 5,19 %. Significant changes can be observed in the region. While in the millennium Csongrád had the highest share of the agricultural employment in the working-age population (8.71 %), in 2011 the county already had the smallest share (4.38 %).
Table 4: The number of the agricultural employment according to age group, their share of the working age population (1992-2011)
Source: Own editing, based on KSH yearbooks and TEIR data
In the region, the decrease of the number of agricultural employees follows the trends in Hungary and even in Europe, but this region is the highest proportion in Hungary. In other words, despite the downward trend, the sector plays an important role in employment in this region. Therefore, the agricultural labour force can pose a significant economic potential for the future of the region.
15-64 25-54 15-74 15-64 25-54 15-74 15-64 25-54 15-74
1992 2000 2011 Bács-Kiskun 48559 38203 51057 28821 21947 30043 20217 15691 20814 7,80 5,64 Békés 35608 29008 37795 19191 16326 19219 13406 9934 13591 7,15 5,48 Csongrád 34837 25093 33806 25650 21024 26164 12758 9677 13141 8,71 4,38 Southern
Great Plain 119004 92304 122658 73662 59297 75426 46381 35302 47546 13,0802 7,90 5,19 Share of agricultural employment in the working-age population (%)
1992 2000 2011
In addition to the change of the number of employees it is also important to analyse the wage of the workers in this sector. The average of the gross wage of the employment in agricultural enterprises which employed more than 20 people is less than the average of the gross wage in Hungary (in 1992 was 267 528 Ft, in 2010 was 2 430 300 Ft). Compared to other sectors it shows a less favourable picture. For example, in processing industry the income wage was 2 484 048 Ft in 2010, while the agricultural wage was 1 726 332 Ft. If the counties are separately examined, both women’s and men’s gross average wage was in Csongrád County the highest in 1992; in 2010 Békés County would be the first place in this respect. In the average wage of women a greater growth has occurred in the analysed 18 years than in the average wage of men.
Table 5: Gross earnings average of the counties (1992-2010, 1000 Ft)
Source: Own editing, based on KSH yearbooks and TEIR data
Wage differences between the agricultural and other sectors may partly explain the move away from agriculture. The extent of the wage greatly influenced the employment of the sector and the region. The basis of migration is often the possibility of higher wages and better living opportunities. Therefore, maintenance and increasing the role of agriculture in employment is indispensable condition for salary increase.
Analyses of the position of the small-scale farmers - selection of target area
A decrease in the number of main workers in agriculture shown by the statistical data does not give an accurate picture of the social role of the agricultural sector. On the one hand some of the previous workers became individual entrepreneurs in the last few years so they are removed from the statistics, on the other hand more people moved away from the sector looking for working places in other sectors of the economy, but in many cases the former workers are still related to the sector in form of part-time jobs. Therefore, it was necessary to use primary research method to reveal the characteristics of the agricultural labour force. Thus for getting a precise picture missing from the labour basis but important for the sector a questionnaire survey was carried out.
The region is large, consequently, it would have been difficult to completely cover it in the survey, so the field is narrowed to a sub-region. To ensure that the analyses of the position of the agricultural small-scale farmers in the selected sub-region could be interpreted to other rural regions in Hungary as well, it is important to analyse such area which is essentially rural, with high agricultural proportion and there is no specific potential focusing on specific problems not appearing in case of others (for example special raw material inventory, positive agglomeration location, disadvantaged position, etc.).
The sub-region of Kalocsa is selected for the subject of further studies. It was an important aspect that the sub-region belongs to the rural sub-region due to the previous classification.
Table 6 shows the characteristics of these sub-regions, apart from those which belong to the most disadvantaged sub-regions in Hungary. The most disadvantaged sub-regions were not examined, because there are specific problems which would distort the results.
woman men woman men
Bács-Kiskun 153,83 Ft 185,16 Ft 1 600,48 Ft 1 843,50 Ft Békés 145,52 Ft 192,70 Ft 1 692,63 Ft 1 884,35 Ft Csongrád 158,38 Ft 199,81 Ft 1 548,45 Ft 1 769,42 Ft
1992 2010
Six from the remaining thirteen sub-regions are in Bács- Kiskun County, after the selection the choice was limited to this county. The choice of the county was also confirmed by the fact that out of the region’s counties the highest share of agriculture from the GDP and the agricultural employment rate is the highest in this county. From the rural sub-regions which do not belong to the most disadvantaged sub-regions, the sub-region of Kalocsa has the most settlements, and only there are also towns, large villages and small villages in Bács-Kiskun County. Based on this the sub-region Kalocsa shows several opportunities for special diversification of the questionnaire survey.
Table 6: Characteristics of rural sub-regions in the Southern Great Plain (2011)
Source: Own editing, based on KSH and TEIR data
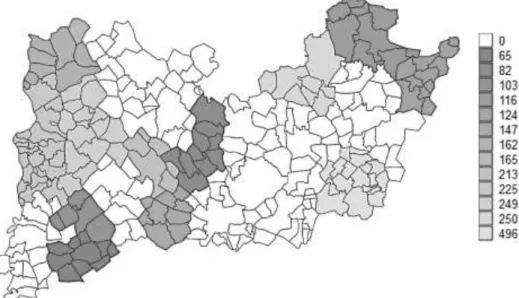
Figure 4: Number of the small-scale farmers in the Southern Great Plain (2011)
Source: Own editing, based on TEIR data
Number of
settlements City Large village Population Number of employed
Area (hectare)
Small- scale farmers
2011
Small-scale farmers share
of the population
Number of private
farms
Number of economic entities engaged
in agricultural Bács-Kiskun
Bácsalmási 8 1 0 16148 4 946 38109 65 0,40% 2432 19
Jánoshalmai 4 2 0 15991 5 022 39910 103 0,64% 2296 41
Kalocsai 20 3 2 50847 18 714 102929 225 0,44% 4546 102
Kiskőrösi 15 4 0 55115 21 336 113033 249 0,45% 9121 96
Kiskunmajsai 6 1 0 19206 7 115 48513 213 1,11% 3888 28
Kunszentmiklósi 10 3 0 30087 11 258 80279 162 0,54% 3114 32
Békés
Mezőkovácsházai 18 4 2 40608 12 783 88149 496 1,22% 6862 67
S arkadi 11 1 0 23228 6 585 57097 124 0,53% 3323 42
S zarvasi 8 2 3 42909 16 437 82157 250 0,58% 5020 96
S zeghalomi 9 5 0 39366 14 690 100973 116 0,29% 4381 51
Csongrád
Csongrádi 4 1 0 22697 8 267 33924 82 0,36% 2989 27
Kisteleki 6 1 0 18429 6 836 41020 85 0,46% 3332 23
Mórahalomi 9 1 0 25377 9 651 53482 147 0,58% 6529 18
The sub-region Kalocsa is on the second place in population and the size of the area; in the number of settlements, the number of agricultural enterprises it is on the first place out of the selected sub-regions. Regarding the number of small-scale farmers it is on an average level compared to other sub-regions in the region. (Figure 4)
Based on these factors and on the basis of personal ties the sub-region Kalocsa became the target area of the survey. In my opinion due to the agricultural potential and the economic structure of the area it was appropriate to carry out the survey. Its results are presented in the next section.
Analyses of the situation of the small-scale farmers in the Southern Great Plain
In the structure of the questionnaire it was important to get more accurate picture of regional specificity of the sector due to the information from the activity of the agricultural small-scale farmers which are important for the agricultural activity and which are rarely in statistical surveys.
The questionnaire was made up of three parts; the first five questions are about the respondent’s data, the part two deals with the agricultural activity, which would explore the respondent’s relationship with the agriculture. The third group of questions assessed the production and sales opportunities nowadays and 15-20 years ago. 51 small-scale farmers filled the questionnaire in paper and electronic form in 6 different settlements.
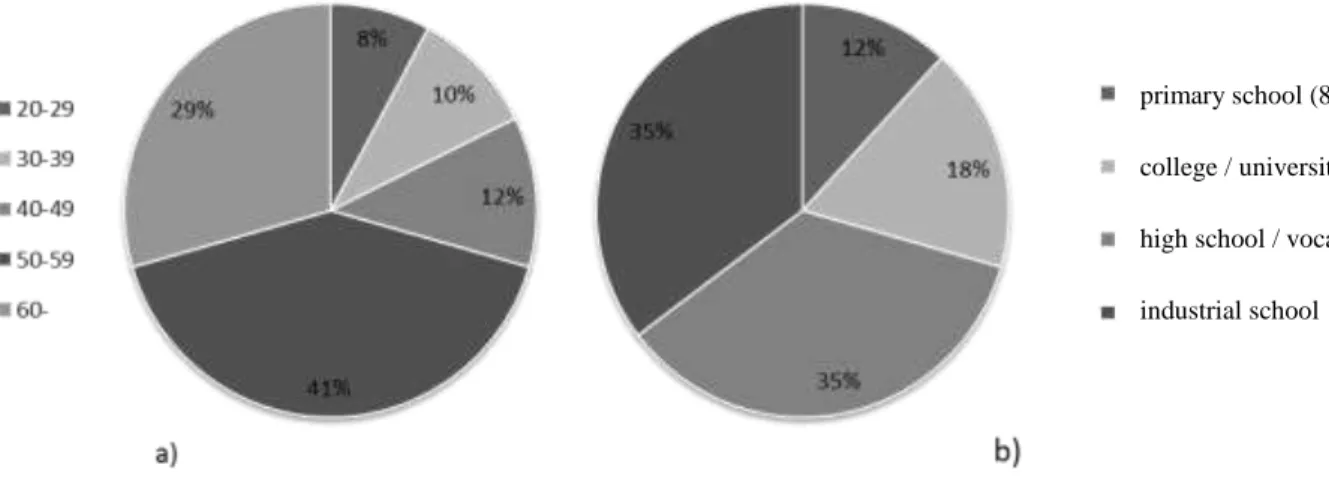
Figure 5: The age and educational qualification of the respondents
Source: Own editing, based on questionnaire survey data
Based on the age and qualification the respondents highly differ. Based on the age- distribution of respondents more than 70% are over than 50 years old, which is consistent with the assumption that the small-scale farmers are mainly in their older ages, being in previously close relationship with the sector. (Figure 5/a) Based on the educational attainment more than 70% of the respondents have secondary qualification and more than 17% of the respondents have college degree (Figure 5/b.). Two-thirds of the respondents have been dealing with agriculture for more than 15 years due to the age distribution of the respondents.
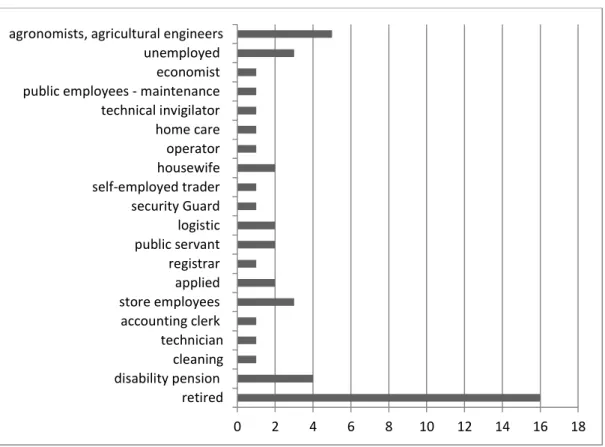
Among the answerers only 31 replied to the question having a primary or secondary relation with the agricultural sector. Six are related to the agricultural sector in form of full-time job, 25 in form of part-time job out of these. Most of the part-time workers are retired. In addition, public officials, business professionals and other professionals were in the sample. It can be
primary school (8 classes) college / university
high school / vocational school industrial school
clearly seen in Figure 6 that the small-scale farmers do not work in the same economic sector, so their information and expectations about the future of the sector may be different.
Figure 6: The occupation of the respondents
Source: Own editing, based on questionnaire survey data
The last questions of the second part was regarding the use of the support system. 18 small- scale farmers have used at least one type of support, 16 of these avail oneself of Single Area Payment Scheme – SAPS. They knew or have used a few about the relatively broad support spectrum. Partly this may be due to that in part-time job the understanding and evaluation of the support scheme is not primary. On the other hand the information about the support opportunities do not at all or only partly reach the small-scale farmers.
The third part of the questions focused on information about the production and sales, especially on the small-scale farmers’ aspects of the changes of the agriculture in the last 15- 20 years. Respondents related to the sector for less than 15 years could provide information about the current habit and opportunities of the production and sales, while the small-scale farmers who are related to the sector longer could provide information about the previous and the current production and sales at the same time.
The survey investigated four areas in connection with the production: kitchen garden, crop production, livestock breeding and special local products. There has not occur a significant change regarding kitchen garden. In case of the crop production it can be observed that most of the respondents produce more types of crop than previously, but in less quantities. Thus some kind of diversification can be obsereved. The most important varieties of plants: wheat and corn, as well as sunflower, that has a greater importance compared to the previous period which can be connected to the built of the sunflower oil factory in Foktő. By livestock breeding a significant decrease can be observed. The small farmers, who dealt with animal husbandry earlier are not terminated the activities but a significant decrease occurred. In the case of special local products the red pepper (paprika) is emerging, which has had a decisive importance in the region for a long time.
0 2 4 6 8 10 12 14 16 18
retired disability pension
cleaning technician accounting clerk store employees applied registrar public servant logistic security Guard self-employed trader housewife operator home care technical invigilator public employees - maintenance economist unemployed agronomists, agricultural engineers
Based on the answers in case of sales it is outstanding that the role of the local and big market sales decreased, the wholesale sales emerged. Only one small-scale farmer of the respondents is producing for export as well (to Italy). Between the wholesale sales and production there is a close relationship. Producers who produce in larger quantity sell their products primaly with help of the wholesale chains, while the smaller producers sell their products in the local markets.
The questionnaires provided useful information, but raised several new questions. Due to the survey we can get an accurate picture about the situation and characteristics of the agriculture in this region.
Discussion
After the change of the regime the importance of the agriculture decreased in the Hungarian economy, thus the level of the employment became lower than previously. This was not only due to the change of the regime but also the following legal and social changes played an important role in this process. The change and elimination of the cooperatives has made difficult to perform agricultural activity, which shows not only in decrease of the productivity, the increase of the prices, but also in the significant increase of the agricultural unemployment. The statistical data do not provide a complete picture about the sector, in rural areas the self-productivity is significant and the self-sufficiency as well.
In the analysed region between an inverse relationship can be observed between the agricultural employment and the population density that can be explained by the significant needs of area of the agricultural productivity and the development of the deficient agglomeration zones.
The highest average gross income was in Csongrád in 1990’s while today in Békés County.
The analysis of these data can be particularly important because the additional statistics do not prove the changes in the counties. It can be worth for further analysis what kinds of companies are founded there and what other reasons exist regarding the change of the gross wage. However, the wage growth is lower than in other sectors, which contribute greatly to a decrease of the sector’s role in employment.
During the survey I also discussed the transformation of consumer preferences which occurred due to the crisis, namely to what extent came to the fore the self-sufficiency of the small-scale farmers. The majority emphasized regarding this question that in the current economic situation appreciates the self-sufficiency.
In the previous market selling system were clear and well-defined catchment areas which changed or eliminated due to the wholesale chains. Analysing the territorial aspects of these processes can provide a more accurate picture about the market sales opportunities of the small-scale farmers that can be a further research area.
References
1. Bács-Kiskun megye Statisztikai Évkönyve (1991): Központi Statisztikai Hivatal Bács- Kiskun Megyei Igazgatósága. Kecskemét.
2. Baranya megye Statisztikai Évkönyve (1992): Központi Statisztikai Hivatal Baranya Megyei Igazgatósága. Pécs.
3. Békés megye Statisztikai Évkönyve (1991): Központi Statisztikai Hivatal Békés Megyei Igazgatósága. Békéscsaba.
4. Csapóné Riskó Tünde (2005): Agrárfoglalkoztatási helyzet Magyarországon, illetve az észak-alföldi régióban. Competitio folyóirat. A Debreceni Egyetem Közgazdaság- és Gazdaságtudományi Karának periodikája. 2005. május.
5. Csatári Bálint (2004). A területfejlesztés és vidékfejlesztés kapcsolata, (Kutatási zárójelentés) Kecskemét: MTA RKK Alföldi Tudományos Intézete
6. Csongrád megye Statisztikai Évkönyve (1991): Központi Statisztikai Hivatal Csongrád Megyei Igazgatósága. Szeged.
7. DARFÜ KHT. (2008). Dél-Alföldi Régió Területfejlesztési Operatív Programja 2009- 2010. DARTOP-1.6. 2009. Szeged
8. Fekete József (2009) (szerk.): A szövetkezetek szabályozása Magyarországon: (1875- 2008). Szövetkezeti Kutató Intézet. Budapest.
9. Korompai Attila (2013): A népesség mint gazdaságföldrajzi tényező, In: Jeney– Kulcsár–
Tózsa (szerk.) Gazdaságföldrajzi tanulmányok közgazdászoknak. BCE Gazdaságföldrajz es Jövőkutatás Tanszék. Budapest
10. Központi Statisztikai Hivatal honlapja: http://www.ksh.hu/ - Letöltés ideje: 2014. január 15.
11. Lehota József – Tomcsányi Pál (1994) (szerk.): Agrármarketing. Mezőgazda Kiadó.
Budapest.
12. Nagy Pongrác (2004): A rendszerváltás gazdaságpolitikája. Akadémia Kiadó. Budapest.
13. Népszámlálás 2011 honlapja: http://www.ksh.hu/nepszamlalas/teruleti_adatok - Letöltés ideje: 2013. október 10.
14. Országos Területfejlesztési és Területrendezési Információs Rendszer honlapja:
https://www.teir.hu/ - Letöltés ideje: 2014. január 15.
15. Somogy megye Statisztikai Évkönyve (1992): Központi Statisztikai Hivatal Somogy Megyei Igazgatósága. Kaposvár.
16. Székely Csaba (2012): A magyar agrárágazat a rendszerváltás után. Közép-Európai Közlemények 5: (1) 174-185. old.
17. Theodore W. Schultz (1983): Beruházás az emberi tőkébe. Közgazdasági és Jogi Könyvkiadó. Budapest.
18. Tolna megye Statisztikai Évkönyve (1992): Központi Statisztikai Hivatal Tolna Megyei Igazgatósága. Szekszárd.
Erika Weber
e-mail: w.erika87@gmail.com