Fizar Ahmed
Matching future job requirements with educational
portfolio
DEPARTMENT OF INFORMATION SYSTEMS
Supervisor: Ildikó Borbásné Szabó Ph.D.
© Fizar Ahmed
CORVINUS UNIVERSITY OF BUDAPEST
DOCTORAL SCHOOL OF BUSINESS INFORMATICS
Matching future job requirements with educational portfolio
Doctoral dissertation
Fizar Ahmed
Budapest, 2018
5
CONTENT
1 OVERVIEW ... 11
1.1 Introduction ... 11
1.2 Higher education and job management ... 13
1.3 Scope of research ... 14
1.4 Subject of research ... 16
1.5 Research questions ... 17
1.6 Methodology of the research ... 19
1.7 Benefits and importance of the research ... 20
2 STATE OF THE ART ... 21
2.1 Research background ... 21
2.2 Beyond the state of the art ... 23
2.3 Competences ... 25
2.4 Stakeholders /interested parties ... 26
3 LITERATURE REVIEW ... 27
3.1 Research for future jobs ... 27
3.2 Economic models for future jobs ... 28
3.3 Output model in economy ... 29
3.4 Educational portfolio for future jobs ... 32
3.5 Technology affects future jobs ... 33
4 BUSINESS CASE STUDIES ... 35
4.1 Reasons why labour markets are in disequilibrium ... 38
4.2 Company cases ... 39
4.2.1 Faurecia: Sweden to the Czech Republic ... 39
4.2.2 IBM Germany to Poland ... 40
5 MODELING ECONOMY ... 41
5.1 Input-Output (I/O) concept and its origins ... 41
6
5.2 Application of Input-Output Approach ... 41
5.3 Acceptance of input-output model ... 43
6 INPUT-OUTPUT COEFFICIENT ... 44
6.1 Input coefficients ... 44
6.2 Inverse matrix coefficients ... 45
6.3 Labour input-output analysis coefficients ... 46
7 BASIC ASSUMPTIONS OF INPUT-OUTPUT ANALYSIS ... 47
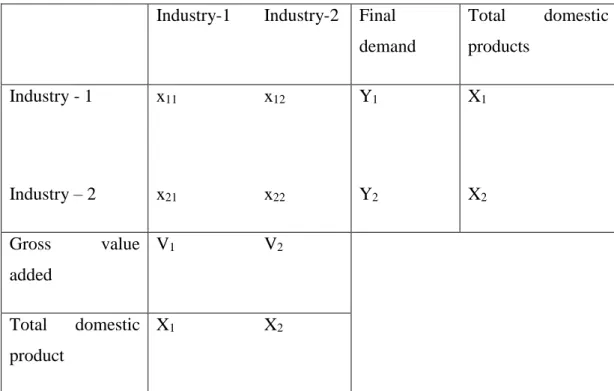
7.1 Basic transaction table ... 48
7.2 Input coefficient table ... 49
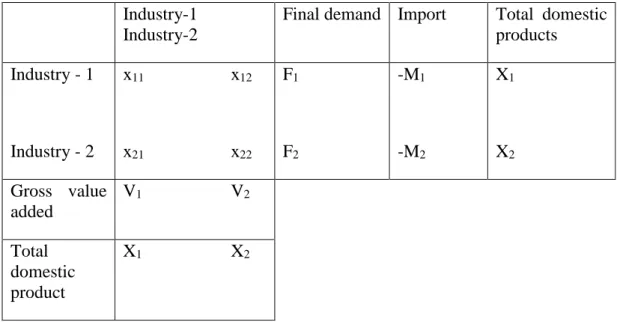
7.3 Inverse matrix coefficients (handling of imports) ... 51
8 DATA COLLECTION ... 53
8.1 Data sources - Open Data / Open Government Data / GOD ... 53
8.1.1 Central Statistical Office (CSO), Hungary... 53
8.1.2 Eurostat ... 53
8.1.3 OECD ... 54
8.1.4 World Input-Output Database (WIOD) ... 54
8.1.5 Concluding to demand ... 55
8.2 Data Pre-Processing ... 55
8.2.1 Input-Output (IO) Table Data in Excel Format... 55
8.2.2 Input Coefficient from the I/O table... 56
8.2.3 Import coefficient from the IO table ... 57
8.2.4 Labour coefficient from the Hungarian Statistical Data ... 57
8.2.5 Occupation coefficient from the ISCO dataset ... 57
8.2.6 Competences from ESCO ... 58
9 EXPERIMENT RESULT AND ANALYSIS... 66
9.1 Modelling expected changes ... 66
9.2 Analysis with business scenarios ... 72
7
9.3 Time horizon / preference selection ... 72
9.3.1 The growing economy (Foreign Direct Investment) ... 72
9.3.2 Changing the requested labour force (productivity, unchanged structure) ... 73
9.3.3 Changing the requested labour force (technology, different structure) 74 9.3.4 Other internal and external factors ... 76
9.4 ReSUlT of selected business scenario: E-car manufacturing ... 79
9.5 Changes in the importance of managerial competences... 85
9.5.1 General managerial competences ... 87
9.5.2 General competences before and after changes in coefficients ... 92
9.5.3 Sector-specific managerial competences ... 93
9.6 Validation of the model ... 94
9.7 Conclusion and future works ... 94
10 REFERENCES ... 98
11 ANNEXES ... 108
11.1 Table-1 Supply and Use Table ... 108
11.2 Table-2 Input Coefficient Table ... 110
11.3 Table-3 Import Coefficient Table ... 112
11.4 Table-4 Labour Coefficient Table ... 114
11.5 Table-5 Occupation Coefficient Table ... 116
11.6 Table - 6 Sector wise Competence Chart for manager ... 118
11.7 General Competence Chart for manager ... 126
11.8 Program code ... 130
8 FIGURES
Figure 1 the relation between HEI and World of Labour ... 14
Figure 2 Unemployment rate in Hungary, Source: CSO ... 16
Figure 3 Research steps ... 20
Figure 4 The “Big picture” ... 23
Figure 5 Technological drivers ... 34
Figure 6 Drivers of change (Source: Future of Jobs Survey, World Economic Forum, 2016) ... 34
Figure 7 Illustration of a labour shortage (Source: Barnow, Trutko & Piatak, 2013). ... 36
Figure 8 ESCO framework (Source- http://euhap.eu)... 58
Figure 9 Common terminology provided by ESCO ... 62
Figure 10 Shows the number of workforces on production (thousand Euros) of the products broken down by the sections of the industries classification the NACE Rev. 2, in thousand persons. ... 67
Figure 11 Changes in labour output ... 69
Figure 12 Occupation input coefficient... 70
Figure 13 Sector-wise number of labour for manager ... 70
Figure 14 Coefficients ... 71
Figure 15 Thousand number of position change as follows the coefficient value ... 71
Figure 16 Number and distribution of managerial position by sectors ... 74
9
Figure 17 Number and distribution of managerial position by sectors in 5 years ... 75
Figure 18 Changing coefficient values between two industries... 83
Figure 19 Total domestic product after changing coefficient. ... 83
Figure 20 Total no of labour in thousand ... 84
Figure 21 Occupation based labour like no of manager in a particular industry ... 84
Figure 22 Plot shows labour changes after changing coefficient. ... 84
Figure 23 The distribution of general competences among the selected occupations 86 Figure 24 The graph of changes labour according to general competences ... 89
Figure 25 Difference between new situations ... 92
Figure 26 the distribution of sector-specific competences among the selected occupations ... 93
10 TABLES
Table 1 Studies about future competences ... 22
Table 2 Basic Transaction Table ... 48
Table 3 Input Coefficient Table ... 49
Table 4 Inverse Matrix Coefficient Handling of Imports ... 51
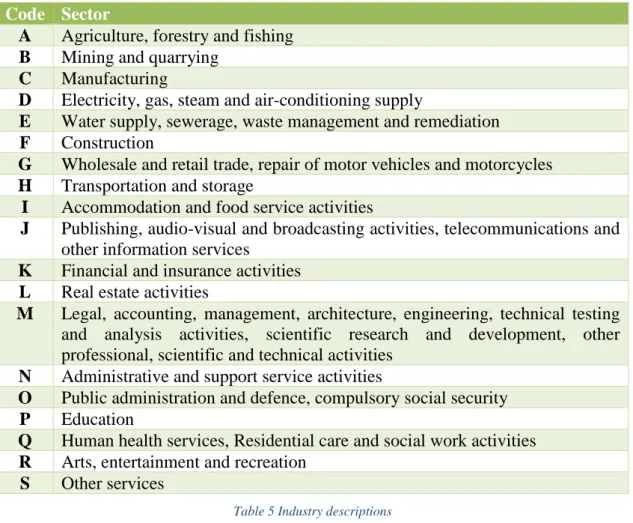
Table 5 Industry descriptions ... 56
Table 6 Occupation coefficient Table. See Annex... 57
Table 7 Occupation coefficient changes in percentages ... 68
Table 8 Sector-wise occupations ... 85
Table 9 General competence list with total labour both before and after changing coefficient values ... 88
Table 10 Competences in three groups ... 90
11
1 OVERVIEW
1.1 Introduction
Labour market is changing continually because of various environmental factors.
Major influencing factors like expanding promising economies, an increasingly global labour market and new technology are all having a significant impact on the demand and required supply of skilled labours as well as prospect for new employment area. Therefore, uncovering the future job trends based on several economic indicator with the required skills in the industrial sector particularly in European industries are utmost important, this is in the main focus of this research.
Along with the other factors, economic growth of a country is affected by job creation. Creating jobs and income opportunities are vital for development. At present, most of the European countries are struggling with the problem of unequal employment situation, characterized by unemployment and manpower shortage at the same time. Consequently, creating new jobs, together with improving working conditions and the level of income from existing jobs are extremely important. To this end, the development of global trade and foreign direct investment can smooth the progress of this process. In addition, innovations and technologies contribute to economic growth and employment, where it is important to incorporate technologies to improve environmental protection.
In the coming years, changes of industrial production process impact profoundly on the generation of employment opportunities. Many of the major drivers of transformation currently affecting global industries are expected to have a major impact on jobs, ranging from significant job creation to job displacement, and from labour productivity to widening skills gaps. The present scenario in the industrial sectors was not available in many industries and countries just about ten years ago.
The pace of such changes is accelerating continuously. It is expected that students entering universities today will ultimately end up working in completely new job types that do not yet exist. In such a rapidly growing employment landscape, the ability to anticipate and organize for future skills needs, job content and the
12
aggregate impact on employment is ever more critical for businesses, governments and individuals in order to fully grab the opportunities presented by these trends to diminish undesirable outcomes.
To get a clear view of the situation we need to model the economy in its full complexity. There are many options for modelling. For the sake of this research Input-Output model proved to be suitable to take many dimensions into consideration. Input-Output Tables describe the sale and purchase relationships between producers and consumers within an economy. They can either show flows of finished or intermediate goods and services as defined in industry outputs (industry × industry ) tables or according to product outputs (product × product) tables. These tables are made on the basis of input-output analysis that allows us to study the structural changes in an economy. It provides the tools necessary to assess industries, including their relationships to the other branches of the economy and the effects of final requirement for production on those relationships. Application of the input-output method in empirical study requires the availability and accessibility of basic statistical information. The most important economic applications, as dissimilar from engineering and business-management applications, have been made in such fields as economic demand, output, employment, and investment for the individual sectors of entire countries and of smaller economic regions. In addition, study of technological change and its effect on yield; analysis of the effect of remuneration, turnover, and tax changes on prices; and study of international and interregional economic relationships, consumption of natural resources, and developmental planning also made use of input-output tables.
In the present study, the primary focus is to find the future job requirement trends based on the input-output table data with the utilization of several valuable components of the table. EUROSTAT table data have been used to calculate the result. The data in input-output tables are available in EUROSTAT database for the reference years up to 2011 based on ESA 1995 and grouped by NACE Rev. 2. By the end of December 2014, national supply and use tables transmitted according to the ESA 2010 methodology. Supply, use and input-output tables provide detailed information for a given year on production activities, the supply and demand of goods and services, intermediate consumption, primary inputs and foreign trade. For
13
economic analysis, country-based regional input–output tables are used here. For the employment data in different sectors, Hungarian statistical data are used for the same year. It can be used for further analysis in different countries in long-term context.
Competences are used to model job requirements. The newest version of ESCO (European Skills, Competences, Qualifications and Occupations) were released a few month ago, hence this multilingual classification of competences and occupations serves as a basis for analysing future competence needs. These future competences can be matched with actual learning outcomes derived from an educational portfolio with using a system mentioned in (Borbásné Szabó, 2014) and its improved version applied in SMART (2012-1-ES1-LEO05-49395) and SMART-PLUS (2016-1-ES01- KA202-025304) projects.
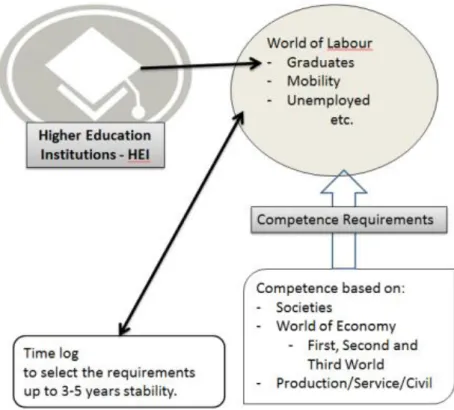
1.2 Higher education and job management
Job seekers can be classified in different groups. For instance, graduates from different Higher Education Institutions (HEIs), mobility worker, skilled unemployed who are searching for another job etc. HEIs are responsible for graduates only who passed immediately from there. These graduates have to be competent for different job types. Industry based competence is most important of them. There are lots of variation of competences in first, second or third economy, also have the variations in production, services and civil works.
For dramatic changes of technologies and other nature of jobs, stability time of competences need to be maintained by HEI. 3-5 years’ time long is important for HEI to maintain the competence graphs. To minimize the gap in technology and other relevant issues between Member States of the European Union, they launched the Strategies for Smart Specialisation Platform (S3 Platform)1 in June 2011 to provide professional advice to EU member states and regions for the design of their research and innovation strategies for smart specialisation. In this research, many
1 http://s3platform.jrc.ec.europa.eu/
14
economicalerimeters of EU Member States can be used for suggesting competence building as follows the present needs of industries.
Figure 1 the relation between HEI and World of Labour
1.3 Scope of research
This research shares some goals stated by the EUROPE 2020 strategy. "EUROPE 2020: A strategy for smart, sustainable and inclusive growth" - in which the European Union defines their goals by 2020. The European Commission proposes the two headline targets with others, these targets are: 75 % of the population aged 20-64 should be employed and 3% of the EU's GDP should be invested in R&D.
Employment generation is one of the most important factors for the development of a country (Borbás, 2012). However, for the development of sector-specific employment, it is compulsory to develop sector-specific skilled manpower.
Countries, enterprises and persons all recognize skills development as strategic goal, and consequently seek to investment opportunities into skills. In aspiring to realize the potential of skills development, they face common challenges.
15
European labour market is now recovering from a very critical situation. According to the "Labour Market and Wage Developments in Europe 20152" reports, after two years of consecutive declines, in 2014 the hours worked per person employed have slightly increased. The reduction in the number of hours worked has been a key adjustment mechanism following the 2008 crisis and 2011 recession. EURES -The European Job Mobility Portal also shows that in late summer 2015, trends on the labour market continued to be favourable3. According to the Federal Employment Agency, after allowing for seasonal fluctuations, both unemployment and under- employment fell in August, and employment continued to grow. There is still solid demand on the labour market.
Developing the condition of labour industries it is now important to analyse the situation of skilled labour in EU area. The report on "Labour market shortages in the European Union-20154" shows that in several regions there are qualitative shortages, particularly relating to skills shortages and mismatch by sectors and occupations, even though there are no quantitative shortages at EU-28. In this report they also found that there is simultaneously a large share of unfilled vacancies and a high unemployment rate, caused by qualitative inconsistencies between supply and demand. These qualitative characteristics first and foremost refer to existing/missing skills, but may also be related to work experience, age, gender and work preferences.
According to the National Employment Service of Hungary at the end of August 2015, more than half of the registered job-seekers were unqualified. Employers continue to report difficulties in finding enough workers with the appropriate skills.
(Eurofound, 2017).
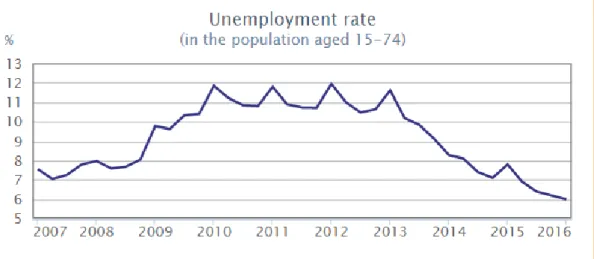
Looking the details, there were 339,000 registered job-seekers in Hungary at the end of August 2015, 15.6% down on the previous year. However, more than half of them were unqualified, while only 6% had a degree from higher education. At the same
2 Directorate-General for Employment, Social Affairs and Inclusion, Directorate A — Analysis, Evaluation, External Relations, Unit A.5 — Labour Market Reforms
3 European Commission. Directorate-General for Employment, Social Affairs and Inclusion, 2015 4 Directorate General For Internal Policies, Policy Department A: Economic And Scientific Policy, Http://Europarl.Europa.Eu/Studies
16
time, employers reported 50,100 vacancies, 53.5% fewer than the previous year.
They also reveal "the level of recruitment difficulties varies by sector. For example, in the ICT sector, there have been more than 10,000 positions unfilled for decades.
This sector, providing 10–12% of Hungarian GDP, has been expanding by 4.5% annually since the economic crisis, according to the Central Statistics Bureau (KSH), and the labour supply has not been able to keep up". (Source: www.ksh.hu)
Figure 2 Unemployment rate in Hungary, Source: CSO
1.4 Subject of research
The goal of this research is to develop a system that is capable of predicating the future trends of jobs in different industries by following different economic scenarios and investigating the need for the development of core competencies in curricula. It is difficult to accurately predict which jobs and consequently which occupations will be demanded in the future, and how many jobs will be created in these occupations.
Economic conditions, technological developments, demographics, consumer behaviours and many other factors are influencing labour market, occupational composition, and different type of future job opportunities.
17 1.5 Research questions
The research area has led to the following research questions:
1. What will be the future jobs according to technological and economic changes of a country, or more precisely, a region?
2. What is the macro-economic impact of future job trends?
Changes in demand and supply in different segments of labour market will affect the labour market position of workers with an educational background in a related field of study. Traditionally such discrepancies between supply and demand are thought to lead to unemployment in the case of excess supply and to unfilled vacancies or skill shortages in the case of excess demand (Wieling and Borghans, 2001).
The forecasting results identified the future job trends and have inspired additional research questions:
3. How can be balanced the employment supply and demand geographic- and sector wise?
4. Is higher education developing manpower for the future?
5. Is it essential to update the academic curricula for ensuring the competencies for future jobs?
Answering the research questions we need a unified view to discover skills needed by future jobs. Assuming manpower demand in large extent depend on the production/services volume and structure, first, we need to model, what is the expected production of the national or regional economy, what is the structure of the total production and how the structure is changing in time.
Input-output analysis facilitates the forecasting of number and composition of jobs in different industries. Because the goal is to develop a dynamic tool that can monitor changes continually, hence open (government) data (e.g. tables about factors influenced economic growth) will be used as input for input-output analysis. Based on the result of input-output analysis, the most important sectors will be highlighted.
Different classification frameworks (like NACE, ISCO) help to connect occupational
18
groups to sectors. ESCO contains competences required by occupations in a very structural manner. Competences extracted from ESCO are connected to sectors via occupational groups. The system integrated these methods and data provides opportunities to run business scenarios reflecting future economic changes affected by different factors (like economic or technological factors) in the system in order to analyse how the importance of different competences will change in the future. We are living in the era of the 4th revolution and it is not enough just hear the prophecies about future jobs, but the educational sector have to detect the important competences in the future in order to fit the students for the future labour market needs.
Using the output of this system as an input of the SMART system (Castello et al., 2009), the compliance of educational and/or training programs with future job requirements can be analysed and reported in a meaningful and clear form.
19 1.6 Methodology of the research
The goal of this research was to develop a system which is capable of predicating the future trends of jobs in different industries by following different economic scenarios and investigating the need for the development of core competencies in curricula. It does not fit into the world of social science research, because it did not aim to discover rules and connections that explain interferences among people (Babbie, 2001). That’s why research questions and not hypotheses determine the research directions. This research aimed to create a prototype in order to help in investigating and answering these questions.
General economic rules were modeled in this prototype, hence this research required deductive thinking method (Babbie, 2001). But the analysis of the domain were data- centric, so quantitative research was executed as well (Newman and Benz, 1998).
The following steps have been performed in order to investigate applications of economic model focusing on employment.
1. First, an input-output economic model has been set up in order to be able to contextualize sector wise and occupational wise forecast.
2. Second, EUROSTAT and Hungarian Statistical Office data have been collected in a repeatable and automated fashion. Three coefficient tables have been made manually from the input-output table data.
3. Third, a programming script has been generated to find the result about future jobs.
4. Sector-wise competence sets extracted from ESCO have been integrated to these part of the system in order to finalize and prepare it to model future changes with the help of business scenarios. The results can be analysed by a business analytics software like Tableau software.
20
Following steps have been followed in this research work:
Figure 3 Research steps
1.7 Benefits and importance of the research
It must have a reflective relation between public and competitive sector and academia for supplying competent workforces in industries. Similarly, academia should have the knowledge about the trends of industrial changes for updating their academic curriculum. This research mainly focuses on to find the trend of sector wise industrial changes based on changing micro or macroeconomic parameters.
These trends can be used by the academia to accomplish the core knowledge for building their academic portfolio.
Sector wise employment data collected for specific country or organization
Input-output economic model used for generating future job
estimation
Conclusion Matching core competency with future
jobs
development in curricula Generate
programming script to find result
21
2 STATE OF THE ART
2.1 Research background
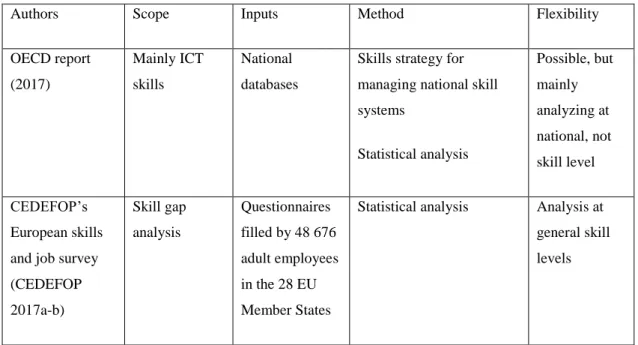
Different studies deal with forecasting future competences. Systematic analysis is our main goal, so approaches using models or other methods for synthetizing knowledge sources fall into our scope. Hence two research groups and two international institutions (OECD and CEDEFOP) specialized on this topic were selected to present their approaches. Their main characteristics are collected in the following table.
• Authors identify the research approach unequivocally.
• Scope presents that this a general forecast or focuses on a specialized area.
• Input shows which sources were used to build a model or determining predictions.
• Method is the key element of a research, because it reflects the reality in a restricted manner.
• Flexibility means that this research is capable of evaluating the small changes of factors.
Authors Scope Inputs Method Flexibility
Hartmann and Bovenschulte (2013)
Skill needs prognosis specifically on Industry 4.0
Experts’
opinions
Virtual Technology Roadmap, Organizational scenarios, Quantitative and qualitative skill needs analysis
Roadmap has to be renewed
Institute for the Future for
the University of Phoenix
Research
Institute (Davis et al. 2011)
Six key drivers and ten most relevant skill areas
Experts’
foresights collected during a workshop
IFTF’s signals
methodology
No. There are not
quantitative correlations between the factors
22
Authors Scope Inputs Method Flexibility
OECD report (2017)
Mainly ICT skills
National databases
Skills strategy for managing national skill systems
Statistical analysis
Possible, but mainly analyzing at national, not skill level CEDEFOP’s
European skills and job survey (CEDEFOP 2017a-b)
Skill gap analysis
Questionnaires filled by 48 676 adult employees in the 28 EU Member States
Statistical analysis Analysis at general skill levels
Table 1 Studies about future competences
These studies highlighted future competences based on the experts’ actual opinions about the future or statistical analyses. The first two studies contained mostly qualitative analyses, diminishing the chance to examine the role of different influencing factors. But they provide us new insights with defining new skills. The last two studies used quantitative analyses based on past data, so the changes of influencing factors can be examined within these databases. But the current skill categories served as a basis for these analysis.
The goal of this research is to develop a system for revealing the relative importance of different competences in the future. Hence it exploits the result of the previous studies, but it complements them as well. The qualitative studies must be repeated in order to detect the changes in the environment. The quantitative studies have no interest to modify their categories, because trend analysis requires strict meta-data catalogues to discover patterns or correlations along time dimensions. These approaches can complement each other and information system can synthetize their advantages. It is capable of monitoring current situations, collecting open data as past data, performing forecasts based on them, presenting the results of different business scenarios due to the changeable parameters, so it is dynamically changeable but the other ones are not.
23 2.2 Beyond the state of the art
These studies use models to collect the experts’ current thoughts about the future.
They do not capitalize the benefits of information systems which are capable of formalizing experts’ thinking processes, opinions to create models, continually detecting the actual situations and mixing these outcomes to get a more precise estimation.
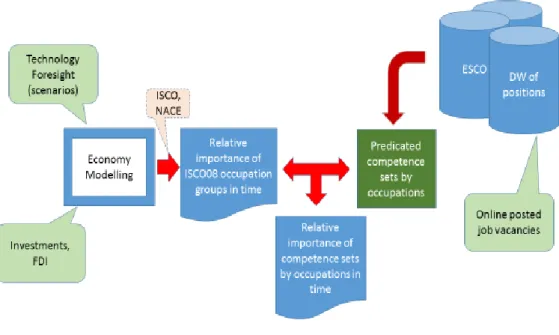
Figure 4 The “Big picture”
Different factors can influence the relative importance of future competences.
Economic factors - like GDP, imports and exports can, sectoral outputs etc. – and technological innovations – like smart systems, blockchain etc. - can influence the labour intensity of different sectors. This takes effect on occupations as well. The relative importance of occupations belonging to a more labour intensive sector will increase. But competences are required to execute different tasks of these occupations. So the relative importance of these skills will grow. Input-output model developed by Leontieff suits this problem, because it is widely used to model
24
industrial outputs, cross-consumptions and labour intensity. Input data of this model can be downloaded due to the Open Government Data initiative. Sectors categorized by NACE represents the industries in this model. Occupations classified by ISCO-08 are connected to these NACE sectors and their distributions are published as open data. The relative importance of different ISCO-08 groups is determined on this way.
Unfortunately the distributions of ISCO-08 subgroups per sector are not available therefore another source have to be used to estimate them.
The aim of SMART project (2012-1-ES1-LEO05-49395) (SMART, 2015) was to monitor actual competence needs via online posted job vacancies and compare them with the competences acquired during VET studies in the tourism industry. The SMART + project (2016-1-ES01-KA202-025304) (SMART PLUS, 2017), as its successor is to provide a comprehensive system for detecting skill gap for students and for institutions as well. Besides a comprehensive skill mismatch report, it provides a report concerned on just some positions. This system is capable of downloading and categorizing job vacancies by position, company, time and regional dimension, and extracting, storing competences required by the position. Another but connected research deals with creating a data warehouse from these datasets in order to monitor and analyse skill mismatches anytime and anywhere. At the end of the development process, monthly data will reside in this data warehouse (DW). ESCO (2017) helps to connect the stored positions to occupations and it presents competences per occupation which can be used to extend the above-mentioned extracted competence sets with new ones. The predicated competence sets per occupation will be calculated within the DW. Their relative importance means that we can state that a competence will be more important than another one, but we cannot state how many times it is. This relative importance will be calculated based on the predicated competence sets per occupation and the aggregated relative importance of the occupations requiring these competences within the ISCO-08. We assumed that the competence can inherit the importance of an occupation, because it is needed to execute a task and if more this kind of position is published then more this kind of task and its competences are required.
Main concepts and areas are clarified in the following sections.
25 2.3 Competences
One of the objectives of European Union long term strategy (EU2020) is to create the Single European Market (SEM). In the context of SEM, the macro-regional mobility highlights the questions of free movement of manpower. One aspect of the free movement of manpower is the workforce knowledge, skill and attitude – competences in short - compliance from the perspective of the different Member States. Member States are not only geographically different; differ significantly in terms of work culture. On corporate level, in the context of employees and employers it is a vital interest to get evidence of existing competences of the new employees, or having a timely monitored competence evolution of the staff.
There is a big terminology bonanza in this area. We are talking about competency and competences, knowledge, skill and attitude, autonomy and responsibility, job role, position and occupation, match and mismatch skills, job-seekers, free movements of manpower, migrants and refugees, mobility, career development, employability and unemployment, labour market integration and re-integration ….
the list is endless.
Competences has many interpretations in the literature and academia, especially in accreditation processes. In this paper, in our understanding competence is a mix of knowledge, hard/soft and transversal skills, attitude, autonomy, responsibility. This interpretation is often mentioned as employability skills. On micro level required competences are linked to the job to be performed. From modelling point of view, jobs emphasized in tasks, and tasks are organized into business processes. Job roles, and their descriptions (in the sense what performers need to know and be able to perform the task) are part of one or more positions, connecting this way process and organisational views together.
While employers, corporates look for competences in connection with positions and connected job roles, on macro level the competences grouped and associated with occupational structure. An occupation is an element of the statistical nomenclature,
26
positions and occupations are strictly linked together by administrative means. The mutual assignment is not without problems: the competence structure mirrors the present and future demand of industry, service sectors, and changes dynamically, however occupational structure is a rather rigid, follows a statistical nomenclature and changes are much less frequent. The occupational structure depends on macro structural variables, educational and training systems.
2.4 Stakeholders /interested parties
Competence matching is a wider issue, than many of us would have thought. Many types of stakeholders are interested in it, from different perspectives.
On supply side, first of all employers, owners and managers of individual firms play the most significant customer roles. Also different (traditional and online) manpower services either from recruiting or selection purposes are significant stakeholders, but many professional association offers also guidelines, conduct surveys in this direction. Finally, education sector, as one of the largest suppliers of graduates must know how effective they are.
On demand side we must mention graduates, employees with mobility or career exchange motivation, unemployed to be re-integrated, any job-seeker, in general.
27
3 LITERATURE REVIEW
3.1 Research for future jobs
The impact of institutions on job research is an imperative theme in the ongoing process on the causes of the better performance of European labour markets.
However, to date, much more emphasis has been given to the sectoral measurement for job creation. Greenwood, MacDonald & Zhang, G. J. (1996) explained three key features of the employment process in the US economy. These are (1) job creation is procyclical, (2) job destruction is countercyclical, and (3) job creation is less volatile than job destruction. They proposed a two sector general equilibrium model both aggregate and sectoral shocks. However, in this model workers were assigned their works via lottery, stillness did not be the part of their analysis.
New technologies are having an extensive and perceptible impact on labour market.
Many researches examine recent occupational projections in order to determine how new technologies will affect future job growth. Rumberger & Levin (1985) show that the number of job openings due to death and retirement is two to three times greater than the number of openings due to employment growth for changing in technologies. Sometimes the slowdown in industrial growth of East European countries is due to a decline in the efficiency or intensity of factory utilization rather than to declining rates of growth of technological progress. As a result, the amount of labour that could be displaced during cyclical downturns is estimated and found to imply potentially high levels of veiled unemployment (Brada, 1989). Impact of technological changes in labour market also found in Institute of Public Police Research (IPPR) (Dolphin, 2015). They show that the European labour market is likely to see substantial disruption and change over the next 10 to 15 years, and that it will be less stable and secure for workers. Howell, D. R. (1985) found some bad effect in labour market for automation like use of industrial robots. We may add, this perception is getting stronger and stronger in the light of development automatization, use of artificial intelligence. His research shows that job displacement is 4.5 to 6.2 times greater than job creation that under the most extreme scenario the aggregate net job loss is 718,000, about 0.7 percent of total employment.
28
Frey & Osborne (2013) revealed that about 47 percent of total US employment is at risk for future computerization. They examine "expected impacts of future computerization on US labour market outcomes, with the primary objective of analysing the number of jobs at risk and the relationship between an occupation’s probability of computerization, wages and educational attainment".
Social networking websites (SNWs), like Facebook or MySpace, now plays an important role in the world of labour Kluemper & Rosen (2009). Based exclusively on viewing social networking profiles, these research shows the judgments are consistent in the ratings across subjects and typically able to accurately distinguish between high and low performers. Parker & Cordery (2001) proposed a framework for the broadening of work design that specifies some kinds of work design variables that span individual, group and organizational levels of analysis. This theoretical framework found that job satisfaction, motivation, attendance and performance will certainly remain central to the agenda for future job.
Jahoda (1981) already decades ago discussed some specific theories being exploited by adherents of one or the other dominant value positions: conservative, reformist, and radical which used for social research. In their research Morris & Venkatesh (2000) find that measurement, compared to older workers, younger workers' technology usage decisions were more strongly influenced by attitude toward using the technology.
3.2 Economic models for future jobs
Many economic models have been proposed for labour market analysis. Glennon, Lane & Johnson (1987) proposed a model for the labour market of Louisville metropolitan area. Their study attempted to improve the efficiency of forecasts by incorporating inter-industry linkages in wage and employment determination into an econometric model. Shore, Randel, Chung, Dean, Ehrhart & Singh (2010) used Brewer’s optimal uniqueness theory to develop a definition of employee inclusion in the work group as involving the satisfaction of the needs of both belongingness and
29
individuality. This enclosure framework provides a basis for inspiring research on diversity that is focused on capitalizing on the unique value of diverse individuals in labour market. Economic development improves the labour demand. Lehmann and Wohlrabe (2014) described some techniques in regional economic forecasting. This technique can be used as a partial development in future jobs. An exogenous increase in the turnover rate can increase profits, but only where firms do not choose the wages. This effect of turnover varies across firms as it depends on turnover costs, the substitutability of incumbents and new hires and other factors. Garino & Martin (2007) proved many years before by using the efficiency wage model of Salop (1979). Wages and labour turnover are the simultaneous part of an industry.
Miller & Brickman (2004) present a theoretically grounded model of motivation and self- regulation that places personally valued future goals at its core. They effort to integrate two lines of conceiving and research that have been relatively independent of one another: the social–cognitive standpoint on self-regulation. Blundell & Walker (1986) have given some explanation of labour market behaviour. They proposed some economic models with some technique using the nature of unemployment.
3.3 Output model in economy
Using the input-output model the study of Norwich and Aberdeen (1980) explain the ways to forecast gross domestic output and employment intensities in sectors.
However, in calculating the employment demand in the respective country this study ignores the important parts of labour migration from one sector to another due to technological changes, rises and falls in industries, as well as requirements for skills diversification. By using input-output accounting principles and integrated bottom-up approach Jelena, Albertas and Adrian (2012) created Lithuanian macro-econometric model and to afford three forecast scenarios of mean wages and unemployment rate in Lithuania. The forecast of unemployment is interrelated to productivity ratio, export, labour force; these factors are crucial for the unemployment forecast in their
30
research. This was focusing on employment or unemployment rate, not in number of employed person in individual sector.
Input-output analysis is widely used to examine the economic impact of tourism (Fletcher 1989, Frechtling and Horváth 1999). The RIMS II5regional input-output model was employed to estimate the multiplier effects of visitors’ expenditures in a region. Briassoulis (1991) attempted a classification of the methodological issues recognized in the related studies and discusses additional issues that future applications of the input-output model have to consider in tourism industry.
Some sectors depend on more labours and some are less. The change of labour productivity was analysed in terms of change in labour intensity using input-output framework (Zbranek and Sixta 2012). The method of transformation of data from the supply and use tables into the symmetric input-output tables form worn-out by commodity is used. However, they used of the ratio of direct labour inputs to output and the assumption on the average hourly wage related to the commodities. Sonis and Hewings (2007) evaluated two complementary approaches to input coefficient change, namely (i) error analysis and (ii) sensitivity analysis. While the two issues addressed separately, the distinction is, in many ways, somewhat artificial. Instead of empirical issues, some theoretical analysis they presented in this study.
Output, income and employment multipliers from the input-output table used for defining economic structure by the research of Bekhet (2011). Multipliers for income and employment were calculated and the results focused the economic condition in different sector.
The more transparent a labour market, the better the opportunities and risks resulting from future labour supply and demand developments can be signalled. To anticipate mismatches, suitable labour market forecasts are required (Cörvers 2003). The
5RIMS II : The Regional Input-Output Modeling System (RIMS II) of Bureau of Economic Analysis, USA, a regional economic model, is a tool used by investors, planners, and elected officials to objectively assess the potential economic impacts of various projects.
31
Dutch Research Centre for Education and the Labour Market’s (ROA) forecasts aim to improve the match between education and the labour market. Their research focused on the bottom-up and the top-down approaches by reviewing some ROA research. Some models for the whole regional labour market with regard to detailed occupational groups and types of education also presented there.
Some economic models have been proposed for forecasting labour market. Schanne (2011) proposed Global Vector Autoregressive (GVAR) models justify the link between the local and the surrounding labour market. They made coefficient region by region, not in industrial sector. Dubra and MāraGulbe (2008) proposed an econometric model for labour force demand and supply forecasting is elaborated and it comprised 120 professions, 37 aggregated groups of professions and covered time period 2007–2030. The methodology of the research was based on different surveys and statistical information, expert evaluations, mathematical statistics and econometrics. Christos (2005) made a good comparison the out-of-sample forecasting accuracy of time series models using basic statistical analysis.
The training that is provided today must be needed at some time in the future.
However it is difficult to predict which training is helpful for future job. Meagher and Pang (2011) drew on a detailed analysis of the show of a labour market forecasting system built by a general equilibrium model of the Australian economy.
The big challenges for the Higher Education Institute (HEI) is to connect perfect education with employability and career development in the design of curricula and learning experiences. Many studies suggest different approach to overcome this situation. Minor (2005) suggested a curriculum for specially sector. Rae (2007) demonstrated the rationale of connecting academia, curriculum and employability.
Weligamage and Siengthai (2003) was conducted a research with the objectives of identifying university graduates' job prospect, factors touching their job expectations and identifying employers' needs from university graduates. Little (2001) suggested that having any validity, indicators of graduate employability need to be seen as multi-dimensional factors relevant to obtaining a job and to preparation for work.
Weligamage (2009) focused that that maximum academic portfolio researches with
32
employment forecasting are survey based, no economic context has been added in that type researches.
3.4 Educational portfolio for future jobs
One kind of architect that invokes up a picture of something used to carry around a variety of documents designed to demonstrate one's achievements is called portfolio (Loughran & Corrigan, 1995). Education or teaching portfolio can be viewed at least from two important aspects, one is the process view, other is the product view. The teaching portfolio is more authentic form of teacher assessment (Barton& Collins, 1993). Academic portfolio is always important for future job. Thomas, D. S. M.
(1998) described the history of portfolio for assisting learning for professional development. They discussed some current thinking about the use of portfolios for formal assessment.
Linse, Turns, Yellin & VanDeGrift (2004) developed the Engineering Teaching Portfolio Program. They used the data of case studies to gain insight on the impact of the program and learn how to improve it. "Doctors and hospital departments with dramatic impact on morbidity and mortality figures catapulted generic competencies to the forefront of attention as indispensable qualities for doctors" (Driessen, Tartwijk, & Dornan, 2008, pp.790-801). This research found some process for the development of professionalism and communication techniques in medical professional. Evaluating and Improving is an important method in education system (Schneider, 2004). The authors, in this report, based on a study of the National Research Council's (NRC) Committee of US on Recognizing, Evaluating, Rewarding, and Developing Excellence in Teaching propose a top- down restructuring of Science, Mathematics, Engineering, and Technology (STEM) education by means of multifaceted assessment of teaching and learning.
33 3.5 Technology affects future jobs
Industrial robots/automation has changed the nature of manufacturing, big data and smart machines are now transforming a wide range of industries and occupations.
Technology and employment researches have the most important priority within some decades. Foreign direct investment (FDI) can play a major role in the industrial development of a country and also for increasing in labour market (Barrell & Pain, 1997). Development of manufacturing industries, there have been a correlation in FDI and job market (Chen & Ku, 2000), Canadian manufacture industries have also some indirect economic benefit from FDI (Globerman, 1979). Main finding of this research is - minimum efficient plant size is positively related to total industry employment by using FDI.
The Educational Quality of the Workforce National Employers Survey (EQW-NES), matched with the Bureau of the Census’ Longitudinal Research Database (LRD), examined the impact of workplace practices, information technology and human capital investments on productivity. They estimate an augmented Cobb-Douglas Production Function with both cross section and panel data covering the period of 1987 to 1993 using data from a unique nationally representative sample of businesses (Black & Lynch 2001). They found that the higher the average educational level of production workers or the greater the proportion of non-managerial workers who use computers, the higher is plant productivity.
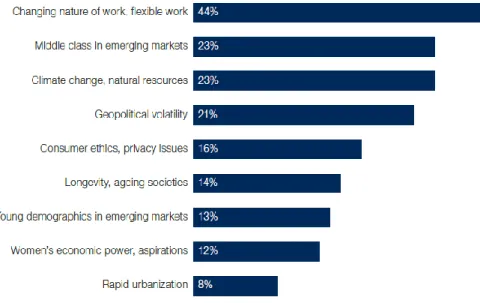
World Economic Forum research (2016) respondents about new job categories and functions that they expect to become important to industry by the year 2020. From their research they found the following employment trends in different industries for changing of technology.
34
Figure 5 Technological drivers
Figure 6 Drivers of change (Source: Future of Jobs Survey, World Economic Forum, 2016)
35
4 BUSINESS CASE STUDIES
Today countries observe the continuous changes in the structure of employment due to various forces and factors in the economies. Companies progress and adjust to demand for new market offerings, technological advancement, changes and complexity in production practices6. Such changes in the economic sector necessitate the relocation, transfer and reconciliation of labour forces in the industrial production. Today the developed economies face the difficulty of labour shortages in their production areas, especially skilled labour forces is missing which can be compensated from internal and/or external sources (education, migration).
In general, employers require labour in a particular sector or in all sectors at a given wage. Different authors and researcher conceptualize labour shortage differently.
Barnow, Trutko and Piatak, (2013 pp.33) define labour shortages as "a situation existing over an extended period of time in which employers were unable to hire at going wages or salaries sufficient numbers of qualified persons to fill positions for which there were budgeted funds and for which personnel were required to meet existing demands for services." The whole story describes the labour demand and storage around the world. It also discussed about factors that are affecting labour demand and supply in the job field. There are theories suggested by many researchers about the labour force. They also discussed about the problem arising in the labour market.
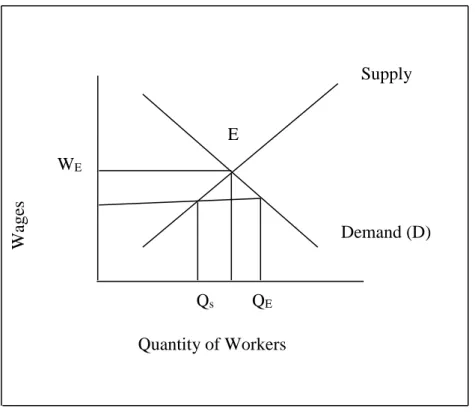
Following figure gives us a clear understanding on the demand and supply of labour force with their equilibrium and disequilibrium picture.
Fig. 7 shows a typical upward-sloping supply curve for labour force. When wages increase, more labours are willing to enter into the labour market and existing workers are willing to perform on higher level. As a result, supply of labour force increase in the market. Regarding the demand for labour force, at a high wage rate
6 ERM case studies: The employment impact of relocation within the EU, Observatory: EMCC , Date of Publication: 18 February 2009
36
employers are not willing to open up more employment opportunities and try to reduce the requirements for the labour as depicted in the downward-sloping demand curve. In this case, employer will generally auxiliary other factors of production for the labour force whose price has augmented. At the same time, higher labour price will push up the product price and accordingly demand for that product will decrease which in turn, will impact negatively on labour demand.
Figure 7 Illustration of a labour shortage (Source: Barnow, Trutko & Piatak, 2013).
Label E indicates the equilibrium point of demand and supply of labour force at a given price. If the wage equals WE then the quantity of labour the workers are willing to supply at that wage (QE) is exactly equals to the quantity of labour demanded by employers. In any reason, if the prevailing wage goes down to WO then employer will demand more for the labour at QD but worker will supply less labour at QS. As a result, shortage of labour will occur in a particular field or fields. That means the variance between the quantities of labour employers want to hire and the amount that workers are willing to supply (QD-QS) is the amount of labour shortage.
In their study, Barnow et al. (2013) has explored several dimensions of labour shortage. They are-
Supply (S) E
WE
Qs QE QD
Demand (D)
Wages
Quantity of Workers
37
• Geographic scope of the shortage: Depending on the geographic location, demand for a particular labour may high or low. Accordingly, high regional demand may cause labour shortage.
• Longevity of the shortage: As different factors impact on the labour shortage, depending on their nature duration of such labour shortage may be shorter or prolonged, lasting for one or more years.
• Severity of the shortage: Unlike above two dimensions, it is not easy to measure the severity of labour shortage because of two reasons. First, we cannot generally observe the exact demand and supply of labour force. If we can, it is tough to measure the intensity of such gap in the market.
• Sub-specialty shortages: in some sectors some sub-specialty shortage may prevail. Because of special characteristics’ of such sectors, specific labours are needed that may create labour shortage unless substitutes are available or needed forces are developed.
Economists and policy makers widely discuss three general issues regarding labour shortages (Barnow, Trutko, & Piatak, 2013). First, because of recent decline in birth rate, some analysts are concerned that there will be too small workforce in future to maintain a developed country’s economic growth. Second, there has been a growing concern that in future a serious mismatch in skills is expected where employers will not get their required skilled labour forces. On the other hand, less-skilled labour will be unemployed. As a result more vacancies and more unemployment will occur.
Finally, shortage may persist in a particular sector leading to occupation-specific shortages (Barnow, 2013).
In conclusion, we can be summarized from this figure that labour supply and demands are not only affected by the wages of labour which has been provided by employers. It also depends on the shortage of needed skills of the labour and sometimes it is affected by the labour migration in different sectors.
38
4.1 Reasons why labour markets are in disequilibrium
Labour shortage may arise because of many reasons. Following section details why a particular sector suffers from labour shortage.
Increase in the Demand for Labour: Increase in the demand for labour may happen with the increase in demand for a particular product. Because more product demand means more production and resultant increases demand for labour. Product demand may increase for many reasons. Increase in the number of consumer, higher income, favorable change in consumer taste for a product, geographical shift of population and increase in the price of other factor of production.
Decrease in the Supply of Labour: Decrease in labour supply is another reason for labour disequilibrium. Reasons may include decrease in the size of the population, existing jobs become less attractive, and restriction to entry into a particular market (Barnow, 2013).
When an economy faces labour shortage it suffers from several sides. Labour shortage create problem in the production process and availability of produce reducers in the market place. In place of decreased labour force, employer cannot utilize its resources properly. Accordingly, less optimization in resources usage happens. In place labour shortage, existing labour s need to work more hours. Such situation impact negatively on their performance and their efficiency reduces and consumers become unable to get their required items from the market place in due time.
39
Following sections details some case studies on labour shortage relating to the European labour market. This discussion is broadly based on the European Foundation for the Improvement of Living and Working Conditions, 2008 report7.
4.2 Company cases
European Foundation for the Improvement of Living and Working Conditions report (2008) published some case studies regarding reason for labour shortage and migration and their effect on the companies activates. Two use cases are rewritten here, where skill shortages are mostly focused.
4.2.1 Faurecia: Sweden to the Czech Republic
It is an international automotive parts manufacturer decided to migrate its factory from Sweden to the Czech Republic. In it they had a bad impact in their work force sector. They lost many employees. Some automatically left the company. The company had some legal problem with labour union and also with the government of Sweden. While in the Czech Republic they start their production slowly. This negativity had a huge impact on the business of Faurecia. In 2013 it is the 8th largest international automotive parts manufacturer in the world (Frigant & Layan, 2009).
7 European Foundation for the Improvement of Living and Working Conditions. (2013). Impact of the crisis on working conditions in Europe.
40 4.2.2 IBM Germany to Poland
It is an American multinational technology company decided to migrate its factory from Germany to Poland. This case showed how this decision helps the company to flourishes the business of IBM in European market. Labour cost in Germany is higher than Poland. IBM grew more in Europe with this help of relocation of their factor unit.
Last we can say that before going to do any kind of manufacturing business we need to first check our demand and supply of labour in that area. This will help in many ways. Foremost it helps in cost minimization of production. This is the main motto of operation managers in a manufacturing business. Labour force can create a huge impact on the cost optimization of a product and the growth of the business in that area. (Source: ERM case studies: The employment impact of relocation within the EU, Observatory: EMCC, Date of Publication: 18 February 2009)
41
5 MODELING ECONOMY
5.1 Input-Output (I/O) concept and its origins
The Leontieff model, known as I/O analysis emphasizes the effects of change in the final demands for goods and services on particular industry with respect to its sales and purchases.
“The input-output method is an adaptation of the neoclassical theory of general equilibrium to the empirical study of the quantitative interdependence between interrelated economic activities. It was originally developed to analyse and measure the connections between the various producing and consuming sectors within a national economy… The specific structural characteristics of the system are thus determined by the coefficients of these equations. These coefficients must be determined empirically; in the analysis of the structural characteristics of an entire national economy, they are usually derived from statistical input-output tables”
(Source: Encyclopedia.com, Input–Output Analysis).
5.2 Application of Input-Output Approach
Leontief published the first input-output table of the American economy (Leontief, 1936). John Maynard Keynes had already revived interest in aggregative economics.
With the Great Depression acting as an appropriate setting for the ensuing discussion of Keynes’ General Theory, the second revolution in economic thought launched by Leontief was initially a quiet one. Significant work in this new area did not occur until the 1940’s when Leontief, continuing with his own efforts in input- output analysis, was joined by his colleagues and others in demonstrating new applications of the input-output approach, especially in the study of aggregate economic impacts. Much of the work was supported by the U.S. Bureau of Labour Statistics. In 1944, the first practical application of the input-output approach was demonstrated in estimating the effects of shifting from war to peace on employment
42
(Cornfield, J., Evans, W. D., & Hoffenberg, M. 1947). Within the next two decades, national, and even regional, input-output models had become common. Phil Borque, in his survey of state and regional input-output models published in 1970, listed all but 38 states as having work completed or in process (Cornfield, Evans &
Hoffenberg 1947). Minnesota was included in this list twice - once for the 1966 Itasca County input-output model completed by Jay Hughes, and second time for the year 1963.
To be of use and with this in mind, Leontief’s early extensions of input-output analysis were intended to demonstrate that:
(1) Production coefficients, which express relationships among the industrial sectors of an economy, lend themselves to statistical estimation;
(2) The estimated coefficients are sufficiently stable so as to be used in comparative static analyses, i.e., different equilibrium states; and, given the above two points,
(3) The merits of different economic policies can be quantitatively evaluated through consideration of either their direct and indirect feedback effects (or multiplier impact) on inter-industry flows.
For the purpose of applying and extending field of input-output analysis, Leontief founded the Harvard Economic Research Project in 1948 and served the project as director for 25 years. During his tenure of service, development in interregional input-output analysis was obvious. In addition, Leontief introduced capital- coefficient matrices meant in order to describe the investment response to changes in final demand that may arise in a particular sector. Due to these developments, input- output analysis came up as a skilled weapon in generating a forecasted growth path of an economic system and its diverse static equilibrium positions. From his leadership period, two notable books published, namely The Structure of American Economy 1919-1939, (1951), and Studies in the Structure of the American Economy (1953).
43 5.3 Acceptance of input-output model
Leontieff gave an extended interpretation to the coefficients the most important among them were the following: the coefficients have a statistical character, therefore they can be estimated; different coefficients based on the estimation statistically are quite stable, hence the model is suitable for different kinds of analyses, like assumption of different economic growth, changes in industry structure, etc.; the analyses may lead to quantitative evaluation of different economic policies, comparison of their indirect effects, accelerator effects or counter effects.
Later in the light of quite different economic theories and also due to the radical changes of global economy, many argued that I/O model has not reflect anymore objectively to the real life of national economy. However the coefficients – in other word technological matrix – are based on statistical data and still the most reliable although not the only data source for modelling. Adding to the model the capital investments, taking into account the modification effects of export-import activities, the I/O model still gives a good starting point for analysis. On the basis of the model results environmental effects, ecological considerations, the strengthening of third sector will be more understandable and lead to a more complex approach (Stilwell &
Minnitt 2000).
From the perspective of this paper we must emphasize the biggest advantages of using I/O model that is it can be built on official statistical data. The validity of data ensured by the national and macro-regional statistical data collection systems, and most of them is available in ‘open data’ format. The later mentioned feature means, the experiments; analyses can be reproduced in an automated fashion.