ORIGINAL ARTICLE
The more the micropapillary pattern in stage I lung adenocarcinoma, the worse the prognosis — a retrospective study on digitalized slides
Tamás Zombori1 &Tibor Nyári2&László Tiszlavicz1&Regina Pálföldi3&Edit Csada3&Tibor Géczi4&Aurél Ottlakán4&
Balázs Pécsy4&Gábor Cserni1,5&József Furák4
Received: 3 December 2017 / Revised: 10 March 2018 / Accepted: 13 March 2018 / Published online: 2 April 2018
#Springer-Verlag GmbH Germany, part of Springer Nature 2018
Abstract
Although the majority of lung adenocarcinomas show mixed pattern, only the predominant component is taken into account according to the novel classification. We evaluated the proportion of different patterns and their impact on overall survival (OS) and disease-free survival (DFS). Patterns were recorded according to predominance and their proportions were rated and calculated by objective area measuring on digitalized, annotated slides of resected stage I lung adenocarcinomas.
Spearman’s rank correlation, Kaplan-Meier models and the log rank test were used for statistical evaluation. Two hundred forty-three stage I adenocarcinoma were included. Lepidic pattern is more frequent in tumours without recurrence (20 vs.
8%), and lepidic predominant tumours have favourable prognosis (OS 90.5%, DFS 89.4%), but proportions above 25% are not associated with improving outcome. Solid and micropapillary patterns are more frequent in patients with recurrence (48 vs. 5% and 13 vs. 4%) and predominance of each one is associated with unfavourable prognosis (OS 64.1%, DFS 56.3% and OS 28.1%, DFS 28.1%, respectively). Above 25%, a growing proportion of solid or micropapillary pattern is not associated with worsening prognosis. In contrast, tumours having micropapillary pattern as secondly predominant form a different intermediate group (OS 51.1%, DFS 57.8%). Our study was based on measured area of each growth pattern on all available slides digitalized. This is the most precise way of determining the size of each component from the material available. We propose using predominant and secondly predominant patterns for prognostic purposes, particularly in tumours having solid or micropapillary patterns.
Keywords Lung adenocarcinoma . Growth pattern . Predominant . Second predominant component . Survival
Introduction
The new classification of lung cancers was introduced by the Wo r l d H e a l t h O rg a n i z a t i o n ( W H O ) i n 2 0 1 5 [1] . Adenocarcinoma is the most frequent histological subtype among non-small cell carcinomas. Most cases of adenocarci- noma are neoplasms with mixed architecture. They should be subclassified according to the predominant growth pattern, after identification and quantification of all histological pat- terns in the tumour in 5% increments [1,2]. Examples of the different growth patterns are demonstrated in Supplementary Fig.1.
Recent studies have focused on predominant growth pat- terns and their impact on survival. It is well documented that lepidic predominant carcinomas have better outcome [3], while solid and micropapillary predominant carcinomas have an unfavourable prognosis [3–7]. These results have validated the novel classification of lung adenocarcinomas. However, Electronic supplementary materialThe online version of this article
(https://doi.org/10.1007/s00428-018-2337-x) contains supplementary material, which is available to authorized users.
* Tamás Zombori zomtam@gmail.com
1 Department of Pathology, Faculty of Medicine, University of Szeged, Állomás u. 1., Szeged H6725, Hungary
2 Department of Medical Physics and Informatics, University of Szeged, Korányi fasor 9., Szeged H6720, Hungary
3 Csongrád County, Hospital of Chest Diseases, Alkotmány u. 36., Deszk H6772, Hungary
4 Department of Surgery, University of Szeged, Semmelweis u. 8., Szeged H6720, Hungary
5 Department of Pathology, Bács-Kiskun County Teaching Hospital, Nyíri út 38, Kecskemét H6000, Hungary
https://doi.org/10.1007/s00428-018-2337-x
many lung adenocarcinomas show mixed-subtype patterns with two or more different growth patterns, and the impact of non-predominant growth patterns on survival is controversial.
Three growth patterns of invasive adenocarcinomas have been investigated recently, namely the lepidic, the solid and micropapillary patterns. Higher proportion of lepidic compo- nent is usually associated with better prognosis [8]. Pure le- pidic carcinoma is defined as in situ adenocarcinoma with 100% overall survival (OS) and disease-free survival (DFS).
The rates of OS and DFS are similarly excellent in case of minimally invasive adenocarcinoma which is a lepidic pre- dominant tumour with invasive focus less than 5 mm [3].
Invasive, lepidic predominant carcinomas belong to low- grade tumours according to the architectural grade, due to their favourable prognosis [7].
A higher proportion of solid or micropapillary pattern re- fers to worse prognosis. Local recurrence, nodal involvement and distant metastases are more frequent among these neo- plasms [9]. Some authors have found that even 1% [10–13]
or 5% [5, 14–18] of these components may cause an unfavourable outcome. In contrast, Roh and coworkers [19]
could not confirm that 5% of micropapillary component re- sults in worse OS. Similarly, Sumiyoshi et al. found that the mean percentages of micropapillary pattern showed no signif- icant differences in the recurrent (20.4%) and non-recurrent (18.3%) groups [20].
Beneath the evaluation of proportions of components, pre- dominant and secondary predominant growth patterns can be investigated, as well. Zhao and coworkers have found that acinar/papillary carcinomas having secondary predominant solid or micropapillary patterns show worse prognosis than acinary/papillary carcinomas without secondary solid or micropapillary components [21].
Our aim was to analyse the predominant and the secondary predominant components and the proportions of different growth patterns, namely lepidic, acinar, papillary, solid, micropapillary and cribriform, in stage I lung adenocarcinoma and their influence on OS and DFS. To reach this aim, we decided to use an objective measurement, i.e. the best approx- imation of areas involved by each pattern available for the cases.
Materials and methods
Haematoxylin-eosin slides of consecutive patients having pul- monary adenocarcinoma in stage I according the 8th Edition of TNM Classification [22] were analysed in our retrospective cohort study. The patients were operated on between 2004 and 2013 at the Division of Thoracic Surgery, Department of Surgery, University of Szeged. The following cases were ex- cluded: patients having multicentric, metachronous or
metastatic tumours, or variants of adenocarcinoma, namely invasive mucinous, mixed invasive mucinous/non-mucinous, colloid, foetal, enteric and pleomorphic/sarcomatoid, and those having lung cancer surgery in the preceding 2 years, positive surgical margins, perioperative death, vascular inva- sion and lack of immunohistochemical phenotyping. For all cases included, mucin staining and immunohistochemistry were applied in the routine diagnostic process. Mucin produc- tion and TTF-1 positivity were considered as evidence in sup- port of a primary pulmonary adenocarcinoma for non-small cell lung cancer cases. For TTF-1-negative tumours, further immunohistochemical results have been considered to rule out squamous cell carcinoma (p40 negativity) and metastatic car- cinoma (different markers for different primaries).
Clinical data, including gender, age, tumour localization, type of surgery, smoking habits, KRAS and EGFR mutation status and site of recurrence, and follow-up data were obtained from medical charts. Stage I was defined by the combination of tumour size and nodal status in addition to clinical data about the lack of distant metastasis. In all cases, lymphade- nectomy was part of the operation and the lymph nodes were examined histologically. The follow-up of patients consisted of three-monthly physical examination, chest x-ray examina- tion and abdominal ultrasonography evaluation in the first 2 years, then six monthly until the fifth year. Chest computer tomography (CT) was performed every 6 months for the first 2 years, then 6 or 12 monthly depending on the patient, until the fifth year. In case of any suspicion of progression, chest CT and abdominal ultrasonography were included. The follow-up period ended on the 31th August 2017.
All available tumour containing slides were digitalized by a Pannoramic 250 scanner (3DHistec, Budapest). As one sec- tion was taken from each centimetre of the largest tumour dimension, the number of slides digitalized was influenced by tumour size. The Case Viewer software (3DHistec, Budapest) was utilised for evaluating the cases.
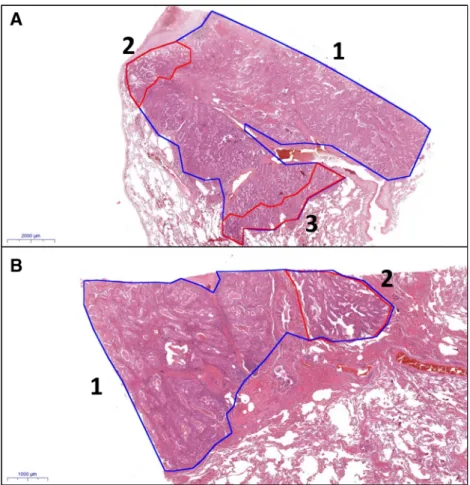
A previous study [7] was based on the evaluation of glass slides; the proportions of growth patterns and the predominant component were estimated by two pathologists (TL, ZT), and consensus was always reached. We also used these results for the assessment of reproducibility between glass slide-based estimation of areas and digital slide-based estimation of the same areas. In the present study, we used digitalized slides. In the first step, the proportions of growth patterns were estimat- ed in 5% increments, and the predominant, secondly and thirdly predominant components were determined with naked eye evaluation. In the second step, the different patterns of the entire tumour were annotated and their areas were measured in square millimetre (Fig.1). The proportions of each component were calculated from the measured areas. In the third step, the predominant and secondly predominant patterns were re- evaluated in one third of the cases after a time period of min- imum 2 weeks. The patterns were re-annotated for assessing
intra-observer (ZT) variability. All available tumour slides were used for all the listed evaluations.
Statistical methods
Statistical models were based on the calculated proportions of the components (second step evaluation mentioned above).
Spearman’s rank correlation was used to investigate intra- observer variability. Five-year OS and DFS estimates and mean survival times with their 95% confidence intervals (95% CI) for OS and DFS were assessed using Kaplan-Meier estimates. The log rank test was used for pairwise compari- sons. All statistical tests were two-sided, andp< 0.05 values were considered statistically significant. We utilised the SPSS Statistics software (IBM, SSPS 22.0, Armonk, NY, USA).
This retrospective study was approved by the institutional ethical committee of the Albert Szent-Györgyi Clinical Centre of the University of Szeged (ethical approval: 168/2016- SZTE).
Results
Altogether, 327 patients matched the inclusion criteria de- scribed in the BMaterials and methods^ section. Clinical
follow-up data were missing in 35 cases of surviving and in 31 cases of deceased patients. Slides were not available in 18 cases. After exclusion of patients with missing data or slides, 243 cases remained for this retrospective analysis, with 141 cases in stage IA1–3 and 102 cases in stage IB.
Median age of the patients was 62.3 years (range 33–85).
No gender predominance was observed (female 50.7% vs.
male 49.3%) in stage I. Most patients had complete lobectomy ( l o b e c t o m y 9 0 . 1 % v s . s u b l o b a r r e s e c t i o n 9 . 9 % ) . Supplementary Table1 displays the most important clinico- pathological data.
With all available haematoxylin-eosin-stained slides digi- talized and evaluated, the median number of slides per patient was 3 (range 2–5). Although the statistical results described below were based on the calculated proportions of the com- ponents, the results, not displayed in this study, were similar if the proportions were determined with naked eye (see also below and Supplementary Table2).
In Table1, the different growth patterns were recorded in all cases as predominant, secondly predominant, thirdly pre- dominant or absent and associated with 5-year OS and DFS estimates. The median follow-up was 61.5 months (range 1.5– 175.3 months). As listed under the table, significant differ- ences in survival rates were found in association with propor- tions of lepidic pattern (better survival) and proportions of micropapillary or solid patterns (worse survival).
Fig. 1 Examples of annotations of digitalized slides (A: HE, 0.5×;
B: HE, 1.5×; 1 (blue): whole tumour, 2 and 3 (red): minor components of tumour)
Table1Kaplan-Meierestimatesof5-yearoverallsurvival(OS)anddisease-freesurvival(DFS)rates,andmeanvaluesofOSandDFSassociatedwithpredominant,secondlyandthirdlypredominantor absentgrowthpatternsandthelogrankpvaluesfoundsignificantaredisplayed GrowthpatternPredominant(1)Secondlypredominant(2)Thirdlypredominant(3)Absent(0) n(%)OS(%)DFS(%)n(%)OS(%)DFS(%)n(%)OS(%)DFS(%)n(%)OS(%)DFS(%)p(logranktest) Lepidic48(20)90.589.425(10)67.25434(14)7575136(56)69.460.3p1–0=0.005(OS) p1–0=0.004(DFS) p1–2=0.019(OS) p1–2<0.001(DFS) Acinar36(15)83.361.,545(19)84.476.317(7)58.463.5145(59)70.966.7 Papillary35(15)85.272.444(19)72.473.931(13)91.482.,5133(53)66.,856.1 Solid100(41)64.156.310(4)69.56026(11)73.172.1107(44)82.973.2p1–0<0.001(OS) p1–0=0.023(DFS) Micropapillary16(7)28.128.120(8)51.157.826(11)65.763.4181(73)74.967.8p1–0<0.001(OS) p1–0=0.004(DFS) p2–0=0.002(OS) p2–0=0.05(DFS) p1–2=0.02(OS) p1–2=0.004(DFS) Cribriform8(4)75759(4)88887(3)68.671.4219(89)73.364.2 MeanOS95%CIMeanOS95%CIMeanOS95%CIMeanOS95%CI lowerupperlowerupperlowerupperlowerupper Lepidic127.8115.4140.3101.664.3118.897.787.5120.482.064.4109.0 Acinar105.793.2118.4108.891.7123.49889.6114.810290.0115.8 Papillary112.494.9130.7103.087.2112.8115.7102.3128.493.485.5108.8 Solid89.477.0101.898.465.6131.7104.184.7123.6119.2109.1129.2 Micropapillary53.932.873.795.575.6109.4101.568.2115.8117.7111.5134.4 Cribriform98.265.2131.5126.497.6155.279.655.998.4104.596.7112.5 95CI95%confidenceinterval
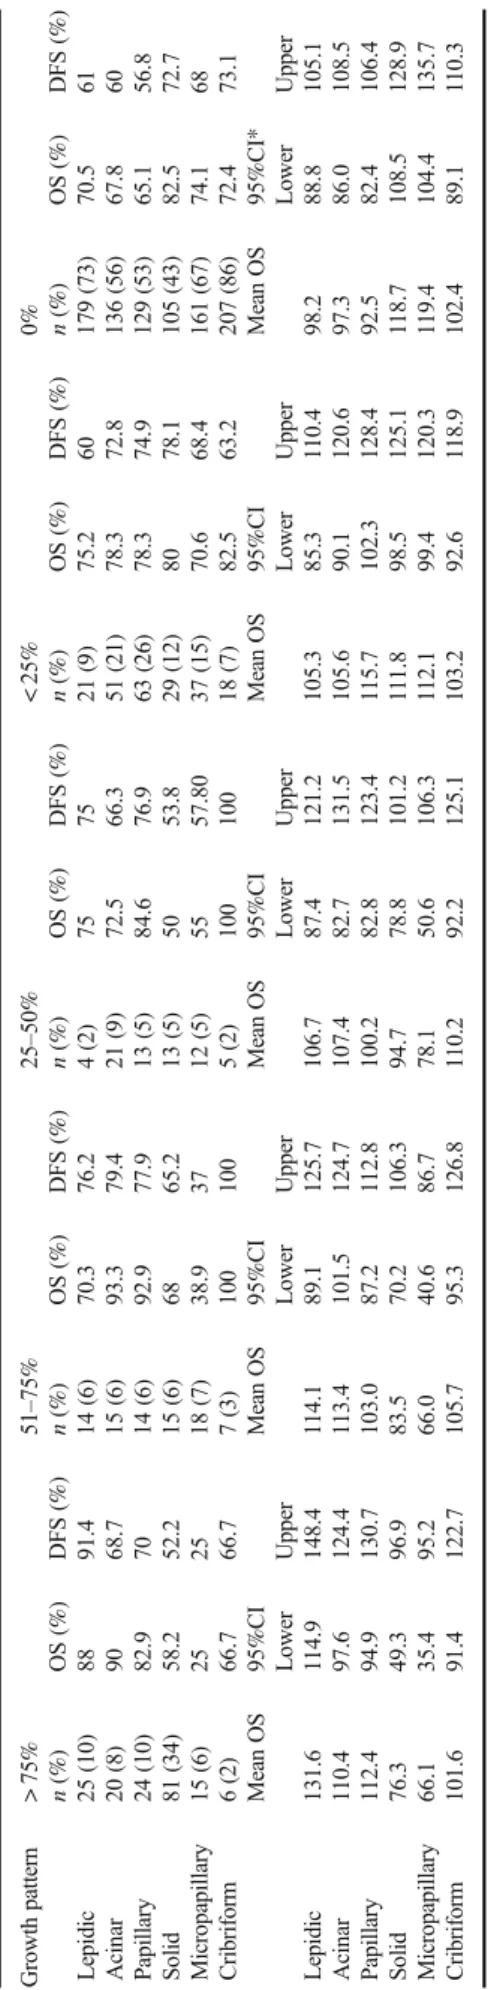
Table2demonstrates the OS and DFS estimates of growth patterns grouped into five groups, namely 0,≤25, 26–50, 51–
75 and≥75%. Significant differences were observed between various subgroups of lepidic, solid and micropapillary patterns (see Table3).
The OS and DFS rates of growth patterns classified as≥5 and < 5% and≥1 and < 1% are displayed in Table4. With the 5% cut-off point, significant differences in survival were ob- served in lepidic, solid and micropapillary patterns, and with the 1% cut-off point in lepidic and solid patterns.
There was no recurrence in 151 cases (62.1%). Among these cases, the predominant patterns were the following: le- pidic (n= 40), acinar (n= 22), papillary (n= 25), solid (n= 54), micropapillary (n= 5) and cribriform (n= 5).
Recurrence was diagnosed in 92 cases including lepidic (n= 8), acinar (n= 14), papillary (n= 10), solid (n= 46), micropapillary (n= 11) and cribriform (n= 3) carcinomas.
The rate of recurrence was low in lepidic carcinoma (16.6%); intermediate in acinar (38.8%), papillary (28.5%) and cribriform carcinomas (37.5%); and high in solid (46%) and micropapillary carcinomas (68.7%). Systemic dissemina- tion was detected in 59 patients including lepidic (n= 5), ac- inar (n= 8), papillary (n= 6), solid (n= 30), micropapillary (n= 9) and cribriform (n= 1) carcinomas. In the non- recurrent group, the average proportion of lepidic, solid and micropapillary patterns were 20, 4 and 5%, respectively, whereas in the recurrent group, these rates were 8, 48 and 13%, respectively. The proportions of other patterns were close to equal in the recurrent and non-recurrent groups.
Besides the morphological evaluation, KRAS and EGFR mutation profiles were analysed in cases with available data (Supplementary Table3). Sixty-seven percent of KRAS mu- tations were found in high-grade tumours, especially in solid neoplasms, while most EGFR activating mutations (88.8%) were in low–intermediate-grade tumours, like lepidic, acinar and papillary carcinomas.
In this study, we used naked eye estimation and area mea- suring for determining the proportions of patterns. As con- cerns the variability of these methods for the determination of the area of different growth patterns, the opinion agreement was the highest in lepidic, acinar and solid patterns, while papillary, micropapillary and cribriform patterns showed higher variability. In all but one case, the concordance was significant, i.e. there were no relevant differences between the estimated and the calculated proportions of growth pat- terns (Supplementary Table2).
Discussion
The new WHO classification of lung adenocarcinomas fol- lows the recommendations of the International Association
for the Study of Lung Cancer (IASLC), the American Table2Kaplan-Meierestimatesof5-yearoverallsurvival(OS)anddisease-freesurvival(DFS)andmeanvaluesofOSandDFSassociatedwithdifferentproportionsofgrowthpatterns Growthpattern>75%51–75%25–50%<25%0% n(%)OS(%)DFS(%)n(%)OS(%)DFS(%)n(%)OS(%)DFS(%)n(%)OS(%)DFS(%)n(%)OS(%)DFS(%) Lepidic25(10)8891.414(6)70.376.24(2)757521(9)75.260179(73)70.561 Acinar20(8)9068.715(6)93.379.421(9)72.566.351(21)78.372.8136(56)67.860 Papillary24(10)82.97014(6)92.977.913(5)84.676.963(26)78.374.9129(53)65.156.8 Solid81(34)58.252.215(6)6865.213(5)5053.829(12)8078.1105(43)82.572.7 Micropapillary15(6)252518(7)38.93712(5)5557.8037(15)70.668.4161(67)74.168 Cribriform6(2)66.766.77(3)1001005(2)10010018(7)82.563.2207(86)72.473.1 MeanOS95%CIMeanOS95%CIMeanOS95%CIMeanOS95%CIMeanOS95%CI* LowerUpperLowerUpperLowerUpperLowerUpperLowerUpper Lepidic131.6114.9148.4114.189.1125.7106.787.4121.2105.385.3110.498.288.8105.1 Acinar110.497.6124.4113.4101.5124.7107.482.7131.5105.690.1120.697.386.0108.5 Papillary112.494.9130.7103.087.2112.8100.282.8123.4115.7102.3128.492.582.4106.4 Solid76.349.396.983.570.2106.394.778.8101.2111.898.5125.1118.7108.5128.9 Micropapillary66.135.495.266.040.686.778.150.6106.3112.199.4120.3119.4104.4135.7 Cribriform101.691.4122.7105.795.3126.8110.292.2125.1103.292.6118.9102.489.1110.3 95CI95%confidenceinterval
Thoracic Society (ATS) and the European Respiratory Society (ERS). Although the majority of these carcinomas are mixed, the classification takes only the predominant pattern into con- sideration. Recent studies have shown that secondly predom- inant patterns or even a small proportion of some patterns can alter prognosis.
Lepidic growth pattern is defined by neoplastic cells grow- ing along the pre-existing alveolar walls. This pattern is the first morphologic sign of carcinogenesis, and if the tumour shows only this pattern, it is called in situ carcinoma and has an excellent prognosis [3]. The lepidic pattern may be associ- ated with other patterns in mixed tumours. Lepidic carcinoma is an invasive tumour with lepidic predominant component and is associated with favourable outcome; therefore, it may be proposed that the more lepidic pattern, the better the prog- nosis. Mäkinen and coworkers have proven in their series that carcinomas with non-predominant lepidic pattern have more favourable outcome [8]. Although a significant difference was seen between OS and DFS of adenocarcinomas without lepid- ic component and tumours having≥1 or≥5% lepidic compo- nent, there was no difference in OS and DFS between tumours without lepidic component and tumours having≤25, 25–50 or 51–75% lepidic areas. Our results confirm the evidence that lepidic predominant carcinoma has a favourable prognosis, but there was no difference in OS or DFS between tumours with secondly predominant lepidic component and tumours without lepidic component. A difference was found between the mean proportion of lepidic component of tumours with recurrence (8%) and those without recurrence (20%).
Solid pattern lacking glandular differentiation is a feature of high-grade lung adenocarcinomas. Recent studies have shown that solid predominant adenocarcinoma has a poor out- come [3,23] and secondary predominant solid pattern or even a small amount of solid component (≥5 or≥1%) may worsen
the prognosis [12,18,21]. A significant difference was ob- served between OS and DFS of tumours having≥5 or≥1%
solid component and those having less (Table4). Similarly, significant differences were found in OS and DFS between various comparisons of tumours with solid component of 0,≤ 25, 26–50, 51–75 and > 75% (Table3). Concerning a solid predominant component, significant differences were found between the OS and DFS estimates of solid predominant tu- mours and neoplasms without solid features. Despite the worsening tendency of OS and DFS with growing proportion of the solid pattern (Table1), there were no differences be- tween tumours having secondly or thirdly predominant solid component and tumours without solid pattern. The mean pro- portion of solid pattern in tumours with recurrence was 48%, contrasting with the 5% in adenocarcinomas without recurrence.
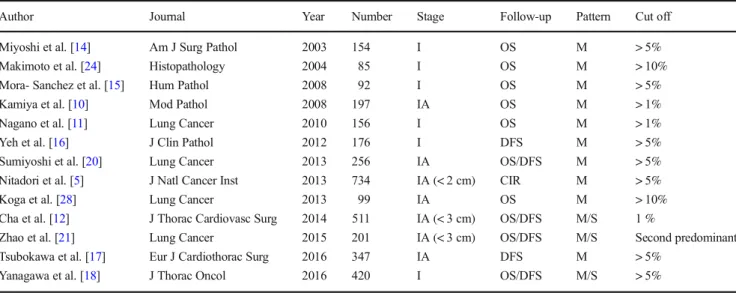
The micropapillary pattern has been incorporated in the adenocarcinoma classification since 2015. Although, accord- ing to the classification based on predominant pattern, it would seems that only the greatest proportion of this pattern matters, some studies [5,10–12,14–18,20,21,24,25] indi- cated that even a minimal amount of micropapillary area is associated with poor prognosis (Table5).
Kamiya and coworkers have divided their patients into four groups according to the proportion of micropapillary pattern in the tumour: none (0%), focal (≤10%), moderate (≤50%) and extensive (> 50%). They found that both OS and DFS estimates were worse with the increase in the proportion of the micropapillary component. The latter three groups had significantly less favourable outcomes than tumours without micropapillary pattern, but comparisons among the three latter groups were not done [10]. Zhang et al. [26] have divided their patients into four groups according to the extent of micropapillary component, namely < 1, 1–5, 6–50 and >
51%. Their conclusion was similar to that of Kamiya et al.
Our results also parallel these two cited studies. The tumours having more than 25% of micropapillary component formed a uniform group according to OS and DFS estimates and dif- fered from tumours having 0–25% micropapillary area. When using the 5% cut-off for micropapillary component, a signif- icant difference was observed in survival in comparison with tumours with no micropapillary component, while at 1% cut- off point, such a difference was not found. In contrast with Sumiyoshi and coworkers [20], a difference was observed between the groups of patients with and without recurrence:
the mean proportions of micropapillary pattern were 13 and 4%, respectively. In the present study, a significant difference in survival was observed between tumours without micropapillary pattern and micropapillary predominant tu- mours. Similarly to Zhao and coworkers [21], tumours having secondly predominant micropapillary pattern in our series constituted a different group with prognosis between micropapillary predominant carcinomas and tumours having Table 3 Significant differences of proportions displayed in Table2
Growth pattern Categories Log rank test p(OS) p(DFS)
Lepidic 0 and > 75% 0.024 0.004
Lepidic < 25 and > 75% 0.05 0.04
Solid 0 and 25–50% 0.038 0.16
Solid 0 and > 75% 0.001 0.015
Solid < 25 and 25–50% 0.15 0.045
Solid < 25 and > 75% 0.032 0.028
Micropapillary 0 and 25–50% 0.034 0.039
Micropapillary 0 and 51–75% 0.002 0.006
Micropapillary 0 and > 75% 0.023 0.05
Micropapillary < 25 and 25–50% 0.22 0.035 Micropapillary < 25 and 51–75% 0.001 0.012 Micropapillary < 25 and > 75% 0.045 0.117
thirdly predominant micropapillary component or lacking this morphology.
By using 1 or 5% cut-off, significant differences were seen between OS and DFS of tumours having lepidic, solid or micropapillary component and tumours lacking them. After division of mixed adenocarcinomas into four groups, namely 0,≤25, 26–50, 51–75 and≥75%, significant differences were found between OS and DFS of tumours lacking solid or micropapillary component and tumours having > 25% solid or micropapillary pattern. The latter three groups (26–50, 51–
75 and≥75%) showed no difference in OS or DFS.
As our study showed, there is a broad spectrum of morpho- logical intra-tumour heterogeneity in lung adenocarcinomas.
Interestingly, the invasive tumours having only one compo- nent had a more unfavourable prognosis, than neoplasms hav- ing mixed pattern (Supplementary Table4). This finding may be explained by the fact that most tumours having one
component were solid tumours with poor outcome. Several series have concluded that this morphological heterogeneity is paralleled by a more complex genetic heterogeneity, as well.
Instead of the traditional single-gene approaches, a huge num- ber of genes can be analysed by next-generation sequencing.
This new method revealed that there are trunk mutations (e.g.
EGFR or KRAS), branching mutations (e.g. EZH2, PIK3CA and p53) and private mutations (ABL1, ALK, BRAF, HER2, etc.) according to the phylogenetic tree model of tumorigene- sis. In keeping with earlier published results [27–31], we have found that most EGFR activating mutations are present in the low- or intermediate-grade tumours (lepidic, acinar and papil- lary), while two thirds of KRAS mutations are associated with high-grade morphology (solid, micropapillary and cribri- form). Pelosi and coworkers have demonstrated that one or more branching mutations predicted poor overall survival, independent from age, gender and stage. Finally, additional Table 4 Five-year overall
survival (OS) and disease-free survival estimates and mean values of≥5% or less and≥1%
or less component with log rank model results
Growth pattern ≥5% < 5% Log rank
n(%) OS (%) DFS (%) n(%) OS (%) DFS (%) p(OS) p(DFS)
Lepidic 61 (25) 81.4 77.8 182 (75) 72.1 61.6 0.04 0.021
Acinar 100 (42) 72.6 61.2 143 (58) 68.5 59.8 0.23 0.28
Papillary 104 (43) 78.6 71.4 139 (57) 73.4 67.4 0.54 0.12
Solid 127 (52) 67.5 58.7 116 (48) 80.2 71.7 0.012 0.005
Micropapillary 56 (23) 61.2 53 187 (77) 75.6 68.7 0.045 0.041
Cribriform 24 (10) 86.3 72 219 (90) 82 64.3 0.31 0.56
Mean OS 95%CI Mean OS 95%CI
Lower Upper Lower Upper
Lepidic 121.5 105.0 131.4 99.4 90.6 106.2
Acinar 105.2 91.1 112.2 101.2 93.7 115.6
Papillary 110.7 102.8 118.6 105.6 95.5 113.5
Solid 95.1 84.1 106.7 116.7 107.5 126.5
Micropapillary 94.5 81.5 105.1 114.5 105.2 124.4
Cribriform 102.6 89.5 110.0 101.1 91.8 118.7
Growth pattern ≥1% < 1% Log rank
n(%) OS (%) DFS (%) n(%) OS (%) DFS (%) p(OS) p(DFS)
Lepidic 64 (27) 82.2 78.9 179 (73) 71.7 61 0.037 0.008
Acinar 107 (44) 75.8 71 167 (56) 67.8 60 0.33 0.58
Papillary 114 (47) 80.3 74.1 129 (53) 71.5 65.2 0.27 0.078
Solid 138 (57) 66.7 60.2 105 (43) 82.5 72.7 0.045 0.005
Micropapillary 72 (30) 69.4 56.6 171 (70) 74.1 68.6 0.95 0.11
Cribriform 31 (13) 82.5 71.9 212 (87) 72.4 64 0.42 0.49
Mean OS 95%CI Mean OS 95%CI
Lower Upper Lower Upper
Lepidic 119.8 106.5 131.6 98.7 88.8 107.7
Acinar 104.9 92.4 116.6 95.4 82.2 106.5
Papillary 115.8 106.2 125.4 108.7 95.4 115.7
Solid 89.4 75.6 101.2 107.6 98.6 116.9
Micropapillary 105.4 91.1 119.0 105.8 95.6 114.3
Cribriform 103.5 82.4 125.8 96.6 87.4 108.2
95CI95% confidence interval
mutations were especially clustered in poorly differentiated regions with KRAS mutations or ALK translocation [27].
The gene mutation landscape is a new dimension with a lot of potential prognostic markers. These factors may explain that the growing proportion of favourable or unfavourable histological component is not necessarily followed by better or poorer prognosis. The gene mutations cannot be predicted by using only morphological parameters; therefore, the mo- lecular studies have inevitable role for clinical management and therapy. Parallel phylogenetic studies of different morpho- logical patterns of the same tumour could help clarifying how these patterns could correspond to genetic alterations.
The prognostic impact of predominant growth pattern was proven on the basis of measuring the area occupied by each pattern on all available (and digitalized) slides, i.e. the most precise way of determining the size of each component from the material available. We think that the study is unique in this r e s p e c t . Tu m o u r s w i t h a s e c o n d a r y p r e d o m i n a n t micropapillary component demonstrated significant differ- ences in OS and DFS from micropapillary predominant tu- mours and non-micropapillary tumours. Therefore, we sug- gest using predominant and secondly predominant patterns particularly in tumours having solid (as suggested by others [12, 18, 21]) or micropapillary (as proven by our data) patterns.
As concerns reproducibility, the reproducibility of the nov- el WHO classification was proven by several studies [32,33], but to our knowledge, this is the first study where all tumour- containing slides were digitalized, annotated (Fig.1), and the area involved by each pattern was objectively calculated to be compared with the proportions gained by naked eye estima- tion. The statistical analysis revealed that there was no
significant difference between these two methods; therefore, naked eye estimation of proportions can be viewed as a useful, time-sparing method of evaluation instead of the objective, but time-consuming, area measurement. The statistical analy- sis pointed out that the differences in intra-observer variability were low in most patterns evaluated. The strongest congruen- cy was seen in cases of lepidic and solid patterns, while the weakest congruency was observed in papillary and micropapillary components.
Concerning the limitations of the study, elastic staining has been proposed to better delineate the alveolar structures, but was not performed in this study. Lepidic, acinar and papillary growth may have low interobserver reproducibility without this adjunct method. In a previous work, growth patterns of these cases were estimated on glass slides with elastic staining if necessary [7], and the concordance between the estimation results of naked eye and digitalized slide analysis was high.
Another limitation is that only stage I adenocarcinomas have been included. In higher stages, the impact of growth patterns is controversial [34,35], and this is why we have limited our study to early-stage tumours.
In summary, by using the best approximation of the areas occupied by different morphological patterns, we have con- firmed that lepidic predominant stage I adenocarcinomas have a good prognosis and solid or micropapillary predominant ones have the worst prognosis. A secondly predominant com- ponent of the bad prognostic patterns also worsen prognosis;
therefore, the reporting of all patterns observed beyond the predominant component is recommended. Naked eye estima- tion of the proportions of each pattern does not seem to be worse than objective measurement on digitised slides and can be used instead in routine practice.
Table 5 Recent studies on micropapillary (M) and solid (S) patterns as non-predominant components (OSoverall survival,DFSdisease-free survival, CIRcumulative incidence of recurrence)
Author Journal Year Number Stage Follow-up Pattern Cut off
Miyoshi et al. [14] Am J Surg Pathol 2003 154 I OS M > 5%
Makimoto et al. [24] Histopathology 2004 85 I OS M > 10%
Mora- Sanchez et al. [15] Hum Pathol 2008 92 I OS M > 5%
Kamiya et al. [10] Mod Pathol 2008 197 IA OS M > 1%
Nagano et al. [11] Lung Cancer 2010 156 I OS M > 1%
Yeh et al. [16] J Clin Pathol 2012 176 I DFS M > 5%
Sumiyoshi et al. [20] Lung Cancer 2013 256 IA OS/DFS M > 5%
Nitadori et al. [5] J Natl Cancer Inst 2013 734 IA (< 2 cm) CIR M > 5%
Koga et al. [28] Lung Cancer 2013 99 IA OS M > 10%
Cha et al. [12] J Thorac Cardiovasc Surg 2014 511 IA (< 3 cm) OS/DFS M/S 1 %
Zhao et al. [21] Lung Cancer 2015 201 IA (< 3 cm) OS/DFS M/S Second predominant
Tsubokawa et al. [17] Eur J Cardiothorac Surg 2016 347 IA DFS M > 5%
Yanagawa et al. [18] J Thorac Oncol 2016 420 I OS/DFS M/S > 5%
Acknowledgments We gratefully acknowledge the assistance of Dániel Urbán, Réka Némedi, Zsófia Tornyossy and Noémi Tóth in collecting clinical data of the patients and in the digitalization of slides.
Author contributions All authors of the manuscript made substantial contributions to the conception or design of the work; the acquisition, analysis or interpretation of data for the work; drafting the work and/or revising it critically for important intellectual content; final approval of the version submitted for publication; and agreement to be accountable for all aspects of the work in ensuring that questions related to the accu- racy or integrity of any part of the work are appropriately investigated and resolved.
More specifically, author contribution is listed as follows:
TZ: Concept, case selection, application and refinement of the methods, evaluation of all cases, analysis of data, preparation of the man- uscript, finalisation and approval of the manuscript
TN: Statistical analysis, preparation of the manuscript, finalisation and approval of the manuscript
LT: Case selection, application and refinement of the methods, evalu- ation of histology slides, finalisation and approval of the manuscript
GC: Development of the methods, supervision, preparation of the manuscript, finalisation and approval of the manuscript
RP: Data collection, finalisation and approval of the manuscript EC: Data collection, finalisation and approval of the manuscript TG: Resources, finalisation and approval of the manuscript AO: Resources, finalisation and approval of the manuscript BP: Resources, finalisation and approval of the manuscript
JF: Concept, case selection, finalisation and approval of the manuscript
Funding This study was partially funded by the National Research, Development and Innovation Office grant GINOP-2.3.2-15-2016-00020.
Compliance with ethical standards
The authors have consulted the journal policy regarding compliance with ethical standards and state that accepted principles of ethical and profes- sional conduct have been followed. The authors include information re- garding sources of funding (previous section) and potential conflicts of interest (financial or non-financial) (next section). This retrospective study was approved by the institutional ethical committee of the Albert Szent-Györgyi Clinical Centre of the University of Szeged. The study did not include animals; therefore, issues relating to animal welfare do not apply.
Conflict of interest The authors declare that they have no conflict of interest.
References
1. Travis WD, Brambilla E, Burke AP, Marx A, Nicholson AG (2015) WHO classification of tumours of the lung, pleura, thymus and heart, 4th edn. International Agency for Research on Cancer, Lyon 2. Travis WD, Brambilla E, Nicholson AG, Yatabe Y, Austin JHM, Beasley MB, Chirieac LR, Dacic S, Duhig E, Flieder DB, Geisinger K, Hirsch FR, Ishikawa Y, Kerr KM, Noguchi M, Pelosi G, Powell CA, Tsao MS, Wistuba I, Panel WHO (2015) The 2015 World Health Organization classification of lung tumors: impact of genetic, clinical and radiologic advances
since the 2004 classification. J Thorac Oncol 10:1243–1260.
https://doi.org/10.1097/JTO.0000000000000630
3. Yoshizawa A, Sumiyoshi S, Sonobe M, Kobayashi M, Fujimoto M, Kawakami F, Tsuruyama T, Travis WD, Date H, Haga H (2013) Validation of the IASLC/ATS/ERS lung adenocarcinoma classifi- cation for prognosis and association with EGFR and KRAS gene mutations: analysis of 440 Japanese patients. J Thorac Oncol 8:52– 61.https://doi.org/10.1097/JTO.0b013e3182769aa8
4. Ujiie H, Kadota K, Chaft JE, Buitrago D, Sima CS, Lee MC, Huang J, Travis WD, Rizk NP, Rudin CM, Jones DR, Adusumilli PS (2015) Solid predominant histologic subtype in resected stage I lung adenocarcinoma is an independent predictor of early, extrathoracic, multisite recurrence and of poor postrecurrence survival. J Clin Oncol 33:2877–2884.
https://doi.org/10.1200/JCO.2015.60.9818
5. Nitadori J, Bograd AJ, Kadota K, Sima CS, Rizk NP, Morales EA, Rusch VW, Travis WD, Adusumilli PS (2013) Impact of micropapillary histologic subtype in selecting limited resection vs lobectomy for lung adenocarcinoma of 2 cm or smaller. J Natl Cancer Inst 105:1212–1220.https://doi.org/10.1093/jnci/djt166 6. Lee MC, Buitrago DH, Kadota K, Jones DR, Adusumilli PS (2014)
Recent advances and clinical implications of the micropapillary histological subtype in lung adenocarcinomas. Lung Cancer Manag 3:245–253
7. Zombori T, Furák J, Nyári T, Cserni G, Tiszlavicz L (2018) Evaluation of grading systems in stage I lung adenocarci- nomas: a retrospective cohort study. J Clin Pathol 71:135– 140.https://doi.org/10.1136/jclinpath-2016-204302
8. Mäkinen JM, Laitakari K, Johnson S, Mäkitaro R, Bloigu R, Lappi-Blanco E, Kaarteenaho R (2015) Nonpredominant le- pidic pattern correlates with better outcome in invasive lung adenocarcinoma. Lung Cancer 90:568–574. https://doi.org/
10.1016/j.lungcan.2015.10.014
9. Cai YR, Dong YJ, Wu HB, Liu ZC, Zhou LJ, Su D, Chen XJ, Zhang L, Zhao YL (2016) Micropapillary: a component more likely to harbour heterogeneous EGFR mutations in lung adenocarci- nomas. Sci Rep 6(23755).https://doi.org/10.1038/srep23755 10. Kamiya K, Hayashi Y, Douguchi J, Hashiguchi A, Yamada T,
Izumi Y, Watanabe M, Kawamura M, Horinouchi H, Shimada N, Kobayashi K, Sakamoto M (2008) Histopathological fea- tures and prognostic significance of the micropapillary pat- tern in lung adenocarcinoma. Mod Pathol 21:992–1001.
https://doi.org/10.1038/modpathol.2008.79
11. Nagano T, Kim YH, Goto K, Kubota K, Ohmatsu H, Niho S, Yoh K, Naito Y, Saijo N, Nishiwaki Y (2009) Re-challenge chemother- apy for relapsed non-small-cell lung cancer. Lung Cancer 69:315– 318.https://doi.org/10.1016/j.lungcan.2009.11.016
12. Cha MJ, Lee HY, Lee KS, Jeong JY, Han J, Shim YM, Hwang HS (2014) Micropapillary and solid subtypes of inva- sive lung adenocarcinoma: clinical predictors of histopathol- ogy and outcome. J Thorac Cardiovasc Surg 147:921–928.
https://doi.org/10.1016/j.jtcvs.2013.09.045
13. Matsuoka Y, Yurugi Y, Takagi Y, Wakahara M, Kubouchi Y, Sakabe T, Haruki T, Araki K, Taniguchi Y, Nakamura H, Umekita Y (2016) Prognostic significance of solid and micropapillary components in invasive lung adenocarcinomas measuring≤3 cm. Anticancer Res 36:4923–4930
14. Miyoshi T, Satoh Y, Okumura S, Nakagawa K, Shirakusa T, Tsuchiya E, Ishikawa Y (2003) Early-stage lung adenocarcinomas with a micropapillary pattern, a distinct pathologic marker for a significantly poor prognosis. Am J Surg Pathol 27:101–109 15. Sánchez-Mora N, Presmanes MC, Monroy V, Moreno N, Lara-
Martínez JM, Aladro MH, Alvarez-Fernández E (2008)
Micropapillary lung adenocarcinoma: a distinctive histologic sub- type with prognostic significance. Case series. Hum Pathol 39:324– 330.https://doi.org/10.1016/j.humpath.2007.05.029
16. Yeh YC, Wu YC, Chen CY, Wang LS, Hsu WH, Chou TY (2012) Stromal invasion and micropapillary pattern in 212 consecutive surgically resected stage I lung adenocarcinomas: histopathological categories for prognosis prediction. J Clin Pathol 65:910–918 17. Tsubokawa N, Mimae T, Sasada S, Yoshiya T, Mimura T,
Murakami S, Ito H, Miyata Y, Nakayama H, Okada M (2015) Negative prognostic influence of micropapillary pattern in stage IA lung adenocarcinoma. Eur J Cardiothorac Surg 49:293–299.
https://doi.org/10.1093/ejcts/ezv058
18. Yanagawa N, Shiono S, Abiko M, Katahira M, Osakabe M, Ogata SY (2016) The clinical impact of solid and micropapillary patterns in resected lung adenocarcinoma. J Thorac Oncol 11:1976–1983.
https://doi.org/10.1016/j.jtho.2016.06.014
19. Roh MS, Lee JI, Choi PJ, Hong YS (2004) Relationship between micropapillary component and micrometastasis in the regional lymph nodes of patients with stage I lung adenocarcinoma.
Histopathology 45:580–586
20. Sumiyoshi S, Yoshizawa A, Sonobe M, Kobayashi M, Fujimoto M, Tsuruyama T, Date H, Haga H (2013) Pulmonary adenocar- cinomas with micropapillary component significantly correlate with recurrence, but can be well controlled with EGFR tyrosine kinase inhibitors in the early stages. Lung Cancer 81:53–59.
https://doi.org/10.1016/j.lungcan.2013.04.003
21. Zhao ZR, Xi SY, Li W, Situ DR, Chen KM, Yang H, Su XD, Lin YB, Long H (2015) Prognostic impact of pattern-based grading system by the new IASLC/ATS/ERS classification in Asian patients with stage I lung adenocarcinoma. Lung Cancer 90:604–609.
https://doi.org/10.1016/j.lungcan.2015.10.026
22. Amin MB, Edge S, Greene F, Byrd DR, Brookland RK, Washington MK, Gershenwald JE, Compton CC, Hess KR, Sullivan DC, Jessup JM, Brierley JD, Gaspar LE, Schilsky RL, Balch CM, Winchester DP, Asare EA, Madera M, Gress DM, Meyer LR (2017) AJCC cancer staging manual, 8th edn.
Springer, New York
23. Jiang W, Xi J, Xu S, Lu S, Wang Q (2015) Analysis of the effect of different pathological subtypes to prognosis in stage I pulmonary ad- enocarcinoma. Zhonghua Wai Ke Za Zhi 53:737–741 [abstract only]
24. Makimoto Y, Nabeshima K, Iwasaki H, Miyoshi T, Enatsu S, Shiraishi T, Iwasaki A, Shirakusa T, Kikuchi M (2005) Micropapillary pattern: a distinct pathological marker to subclassify tumours with a significantly poor prognosis within small peripheral lung adenocarcinoma (≤20 mm) with mixed bronchioloalveolar a n d i n v a s i v e s u b t y p e s ( N o g u c h i’s t y p e C t u m o u r s ) . Histopathology 46:677–684
25. Koga K, Hamasaki M, Kato F, Aoki M, Hayashi H, Iwasaki A, Kataoka H, Nabeshima K (2013) Association of c-Met phosphorylation with micropapillary pattern and small cluster invasion in pT1-size lung adenocarcinoma. Lung Cancer 82:
413–419.https://doi.org/10.1016/j.lungcan.2013.09.005 26. Zhang J, Liang Z, Gao J, Luo Y, Liu T (2011) Pulmonary adeno-
carcinoma with a micropapillary pattern: a clinicopathological,
immunophenotypic and molecular analysis. Histopathology 59:
1204–1214.https://doi.org/10.1111/j.1365-2559.2011.04050.x 27. Pelosi G, Pellegrinelli A, Fabbri A, Tamborini E, Perrone F,
Settanni G, Busico A, Picciani B, Testi MA, Militti L, Maisonneuve P, Valeri B, Sonzogni A, Proto C, Garassino M, De Braud F, Pastorino U (2016) Deciphering intra- tumour heterogeneity of lung adenocarcinoma confirms that dominant, branching, and private gene mutations occur within individual tumour nodules. Virchows Arch 468:651–662.
https://doi.org/10.1007/s00428-016-1931-z
28. Yatabe Y, Kosaka T, Takahashi T, Mitsudomi T (2005) EGFR mu- tation is specific for terminal respiratory unit type adenocarcinoma.
Am J Surg Pathol 29:633–639
29. Girard N, Sima CS, Jackman DM, Sequist LV, Chen H, Yang JC, Ji H, Waltman B, Rosell R, Taron M, Zakowski MF, Ladanyi M, Riely G, Pao W (2012) Nomogram to predict the presence of EGFR activating mutation in lung adenocarcinoma. Eur Respir J 39:366–372.https://doi.org/10.1183/09031936.00010111 30. Yoshida A, Tsuta K, Nakamura H, Kohno T, Takahashi F,
Asamura H, Sekine I, Fukayama M, Shibata T, Furuta K, Tsuda H (2011) Comprehensive histologic analysis of ALK- rearranged lung carcinomas. Am J Surg Pathol 35:1226–1234.
https://doi.org/10.1097/PAS.0b013e3182233e06
31. Sumiyoshi S, Yoshizawa A, Sonobe M, Kobayashi M, Sato M, Fujimoto M, Tsuruyama T, Date H, Haga H (2014) Non-terminal respiratory unit type lung adenocarcinoma has three distinct subtypes and is associated with poor prognosis. Lung Cancer 84:281–288.https://doi.org/10.1016/j.lungcan.2014.03.013 32. Warth A, Stenzinge r A, von BrĂĽnneck AC, Goeppert B,
Cortis J, Petersen I, Hoffmann H, Schnabel PA, Weichert W (2012) Interobserver variability in the application of the novel IASLC/ATS/ERS classification for pulmonary adenocarci- nomas. Eur Respir J 40:1221–1227. https://doi.org/10.1183/
09031936.00219211
33. Thunnissen E, Beasley MB, Borczuk AC, Brambilla E, Chirieac LR, Dacic S, Flieder D, Gazdar A, Geisinger K, Hasleton P, Ishikawa Y, Kerr KM, Lantejoul S, Matsuno Y, Minami Y, Moreira AL, Motoi N, Nicholson AG, Noguchi M, Nonaka D, Pelosi G, Petersen I, Rekhtman N, Roggli V, Travis WD, Tsao MS, Wistuba I, Xu H, Yatabe Y, Zakowski M, Witte B, Kuik DJ (2012) Reproducibility of histopathological subtypes and invasion in pulmonary adenocarcinoma. An in- ternational interobserver study. Mod Pathol 25:1574–1583.
https://doi.org/10.1038/modpathol.2012.106
34. Zhang H, Lu C, Lu Y, Yu B, Lv F, Zhu Z (2016) The predictive and prognostic values of factors associated with visceral pleural in- volvement in resected lung adenocarcinomas. Onco Targets Ther 9:2337–2348.https://doi.org/10.2147/OTT.S100965
35. Campos-Parra AD, Avilés A, Contreras-Reyes S, Rojas-Marín CE, Sánchez-Reyes R, Borbolla-Escoboza RJ, Arrieta O (2014) Relevance of the novel IASLC/ATS/ERS classification of lung ad- enocarcinoma in advanced disease. Eur Respir J 43:1439–1447.
https://doi.org/10.1183/09031936.00138813