Contents lists available atScienceDirect
Applied Catalysis B: Environmental
journal homepage:www.elsevier.com/locate/apcatb
Co
4N/nitrogen-doped graphene: A non-noble metal oxygen reduction electrocatalyst for alkaline fuel cells
Tamás Varga
a, Gerg ő Ballai
a, Lívia Vásárhelyi
a, Henrik Haspel
a,1, Ákos Kukovecz
a, Zoltán Kónya
a,b,⁎aDepartment of Applied and Environmental Chemistry, University of Szeged, H-6720 Szeged, Rerrich Bela tér 1, Hungary
bMTA-SZTE Reaction Kinetics and Surface Chemistry Research Group, H-6720 Szeged, Rerrich Béla tér 1, Hungary
A R T I C L E I N F O
Keywords:
Nitrogen doped graphene Cobalt nitride
Oxygen reduction reaction Non-noble metal catalyst Alkaline media Methanol tolerance
A B S T R A C T
Cobalt-nitride (Co4N) nanoparticle-decorated nitrogen-doped graphene sheets were obtained via the nitrogen doping of a graphene-oxide precursor and simultaneous nitride formation. The non-precious metal catalyst formed in this one-step synthesis exhibits high electrocatalytic oxygen reduction activity and hence provides a promising alternative to conventional Pt/C alkaline fuel cell cathode catalysts. The reported composites were formed from the mixture of lyophilized graphene-oxide nanosheets and cobalt(II) acetate in ammonia atmo- sphere at 600 °C. The average Co4N particle size increased from 14 to 201 nm with the increase in cobalt content.
The oxygen reduction activity of the new catalysts was comparable to that of non-noble metal systems described in the literature, and also to the widely-used carbon black supported platinum catalysts. The highest reduction current density under alkaline conditions was found to be as high as 4.1 mA cm−2with the corresponding electron transfer number of 3.6. Moreover, the new system outperformed platinum-based composites in terms of methanol tolerance, thus eliminating one of the major drawbacks (besides high price and limited availability), of noble metal catalysts.
1. Introduction
Fuel cells are high energy-conversion-efficiency devices, which can help mitigate the effect of global warming through reducing CO2
emission, and hence, lower CO2accumulation rate in the atmosphere [1]. One of the most widely used and studied fuel cell type is the proton exchange membrane fuel cell. Alkaline fuel cells, on the other hand, utilize a hydroxide ion conductor membrane instead [2]. These devices are currently moving into the focus of global fuel cell research because most non-noble metal catalysts work under alkaline conditions [3]. To achieve high conversion efficiency, both the anode and the cathode sides need a catalyst. However,finding an efficient oxygen reduction reaction (ORR) catalyst is challenging due to the sluggish kinetics of this reaction [4]. A very recent review by Sarapuu et al also shows that the reaction pathway depends on the nature of the catalyst and the type of the electrolyte [5]. Porous carbon supported platinum is the most commonly used ORR catalyst. Even though it shows remarkable elec- trocatalytic activity, platinum-based catalysts are expensive and sensi- tive to impurities, like carbon monoxide, methanol, halides etc. [6]. To overcome these drawbacks, alternative non-noble metal solutions have
to be developed. Several promising materials are already known, like transition metals [7] and those chalcogenides [8], oxides [9], carbides [10], oxynitrides [6] or nitrides [11]. The electronic structure of Group 4–6 transition metal nitrides is favorable for oxygen reduction reaction, as electron density is higher near the Fermi level due to the d band contraction, which makes the electron donation easier to the adsorbed oxygen [12]. The most promising transition metal nitrides are based on cobalt and iron [13]. Several methods are known to prepare cobalt nitride: Chen et al. grew Co(OH)F nanowires onto the surface of carbon cloths, and then transformed them into cobalt nitride nanowires by thermal treatment in ammonia atmosphere [14]. The same group syn- thesized cobalt nitrides with different Co:N ratio (Co2N, Co3N and Co4N) modifying precursors and subsequent thermal treatment. They found that Co4N has outstanding properties owing to the higher electric conductivity and better activity in oxygen evolution reaction [15].
Theerthagiri et al. mixed the cobalt precursor with urea, annealed them in nitrogen atmosphere and investigated the magnetic properties of the product [16]. Meganathan et al. prepared reduced graphene oxide in- tercalated Co4N and achieved a current density of 1.82 mA cm−2with electron transfer number of 3.3 in oxygen reduction reaction [17].
https://doi.org/10.1016/j.apcatb.2018.06.054
Received 22 March 2018; Received in revised form 13 June 2018; Accepted 19 June 2018
⁎Corresponding author at: Department of Applied and Environmental Chemistry, University of Szeged, H-6720 Szeged, Rerrich Bela tér 1, Hungary.
1Present address: Division of Physical Sciences and Engineering, KAUST Catalysis Center (KCC), King Abdullah University of Science and Technology (KAUST), 4700 KAUST, Thuwal, 23955-6900, Saudi Arabia.
Available online 20 June 2018
0926-3373/ © 2018 Published by Elsevier B.V.
T
Another type of non-noble metal catalysts is the so-called metal-free catalysts, like graphene, boron nitride [18,19], carbon nitride [20,21], and nitrogen or sulfur doped graphene, carbon nanotubes or carbon nanosheets [22–30]. One of the most efficient metal-free catalysts is nitrogen doped graphene (NG) that exhibits high ORR activity in both acidic and alkaline media [24,31,32]. Zhang et al. used DFT calcula- tions to determine the oxygen reduction reaction pathway in nitrogen- doped graphene. They found that the incorporated nitrogen atoms modify the atomic charge and spin distribution of the graphene sheet, that makes the neighboring carbon atoms more favorable for oxygen adsorption and facilitates the further steps in the reaction path. The presence of pyrrolic and pyridinic type nitrogen moieties in the carbon structure is responsible for these effects [33,34].
A wide range of nitrogen-doped graphene preparation methods can be found in the literature. In 2015, Ma et al. utilized the hydrothermal conversion of graphene oxide in ammonia solution [35]. Tao et al. re- acted the mixture of urea and graphene oxide in a hydrothermal synthesis [36]. Zhu et al. thermally annealed the mixture of polypyrrole and graphene oxide [37]. The review by Dou et al shows that plasma treatment is another potential option for the preparation of hetero- geneous carbon structures [38]. Qu et al. prepared nitrogen-doped graphene by the chemical vapor deposition of methane in the presence of ammonia and investigated the ORR activity. They reported high stability and tolerance against methanol [24]. Zheng et al. synthesized nitrogen-doped graphene (NG) by using a mixture of urea and graphene oxide in a hydrothermal approach. The observed NG had much higher ORR activity than the pristine graphene, but it could not match the performance of the platinum/carbon catalyst [39]. Nitrogen-doped graphene can also be produced by ammonia treatment of graphene oxide: Li et al. prepared nitrogen-doped graphene at high temperatures and successfully obtained pyridinic type nitrogen atoms in the carbon structure [40]. Such structured carbon materials can be also used as catalyst support due to their high conductivity and the synergistic effect between the support and the dispersed catalyst [41,42].
Here, we demonstrate a simple one-step synthesis method, where cobalt nitride nanoparticles were simultaneously formed from cobalt(II) acetate during the nitrogen doping of graphene-oxide nanosheets via high-temperature annealing under ammonia atmosphere.
Electrocatalytic activity was studied in alkaline medium, and the oxygen reduction activity of the as-prepared composites was compared to that of the most commonly used Pt/carbon black (CB) composite prepared by wet impregnation.
2. Experimental
2.1. Synthesis of graphene oxide
Graphene oxide (GO) was synthesized via the modified Hummers method [43]. First, 4.5g graphite powder and 4.5g sodium nitrate (NaNO3) was added to 210 ml concentrated sulfuric acid (H2SO4) so- lution, and the mixture was stirred for 30 min. 27g potassium per- manganate (KMnO4) was then slowly added to the suspension, while the beaker was placed in an ice bath. The resulting mixture was stirred for 24 h. At this phase, first 500 ml H2O, then 10 ml 50% hydrogen peroxide (H2O2) was added to the mixture and stirred for an other 2 h.
The as-prepared yellowish brown suspension was purified by cen- trifugation with ion-exchanged water several times until a sulfate-free supernatant was obtained. The resulting brownish graphene-oxide was dried at 80 °C overnight.
2.2. Synthesis of Co4N /nitrogen-doped graphene composites
The schematics of the Co4N/nitrogen-doped graphene composite synthesis is shown inFig. 1. 100 mg graphene oxide and a calculated amount of cobalt(II) acetate tetrahydrate were added to 40 ml ion-ex- changed water and stirred overnight. The amount of cobalt salt was
22.2 mg, 46.9 mg, and 105.6 mg to get three different composites with cobalt loadings of 5, 10, and 20 wt%, respectively. After stirring over- night, the mixture was lyophilized, and the dried powder was thermally treated in a tube furnace in ammonia atmosphere (120 ml min−1flow rate) at 600 °C for one hour. The tube furnace was thoroughly purged by ammonia prior to the heat-treatment to prevent contamination from oxygen.
Nitrogen-doped graphene and cobalt nitride were also synthesized for comparison. In case of nitrogen-doped graphene, a graphene-oxide suspension was prepared with the same concentration as above and lyophilized. Co4N was formed via annealing cobalt(II) acetate tetra- hydrate powder. Both materials were annealed like the composites described above.
2.3. Preparation of reference catalyst
Pt/carbon black (Pt/CB) catalyst was synthesized to compare the electrocatalytic activity of the new Co4N/NG composites to that of a commercially used system. The composite was prepared by wet im- pregnation described elsewhere [44]. First, 90 mg of carbon black and 20 mg platinum(II) acetylacetonate were suspended in distilled water, stirred for 24 h, and then dried overnight at 40 °C. 60 mg of the as- synthesized dried powder was thermally treated in oxygen-free nitrogen atmosphere (120 ml min−1) at 400 °C for 2 h.
2.4. Characterization methods
Sample morphology was investigated by transmission electron mi- croscopy (TEM) using a Fei Tecnai G220 X Twin miscroscope at 200 kV accelerating voltage. During sample preparation, a small amount of sample was sonicated in isopropyl alcohol then dropped on a copper mounted holey carbonfilm and dried afterward. Particle size distribu- tions were obtained by measuring the diameter of 50-50 nanoparticles in four representative TEM images. The crystal structure of the com- posites was analyzed by powder X-ray diffraction measurements (XRD) recorded with a Rigaku Miniflex II desktop diffractometer using CuKα radiation at a scan speed of 4° min−1. Raman spectra were measured using a Thermo Scientific DXR Raman Microscope utilizing 532 nm laser excitation at 5 mW power. 10 scans at 1 cm−1 resolution were averaged in the range of 200–3500 cm−1. X-ray photoelectron spectra (XPS) were taken with a SPECS instrument equipped with a PHOIBOS 150 MCD 9 hemispherical analyzer, using the Kαradiation of an Al anode. The analyzer was operated in the FAT mode with 20 eV pass energy and the X-ray gun in 210 W (14 kV, 15 mA).
Fig. 1.Schematics of the Co4N/nitrogen-doped graphene synthesis.
2.5. Electrode preparation
Before surface coating, the glassy carbon electrode (GCE, 3 mm diameter, BASi®) was carefully polished with alumina slurry (0.05μm diameter) and rinsed and sonicated with ion-exchanged water and ethanol, then dried. The sample (1.0 mg) was dispersed ultrasonically in a 1:1 vol ratio mixture of water and ethanol (250μl) and 10μl of 5 wt%
Nafion®to get a homogeneous suspension with the weight concentra- tion of 4.0 mg∙mL−1. 15.0μl of this suspension was uniformly dropped on the pretreated GCE surface and dried at room temperature to form surface modified GCE electrodes. This corresponds to a loading of 0.85 mg cm−2on the geometric area of GCE. The same method was used to prepare Pt/CB modified electrode with Pt/CB (10 wt% Pt con- tent) as comparison.
2.6. Electrochemical measurements
Electrochemical measurements were conducted in a three-electrode glass cell using an ACM Instruments GILL AC electrochemical work- station at room temperature (23 °C). Modified glassy carbon electrodes described above were used as working electrodes, while Ag/AgCl (3 M NaCl, BASi®) and a platinum wire served as reference and counter electrode, respectively. The experiments were carried out in nitrogen and oxygen saturated 0.1 M KOH solution. The measured potentials vs.
Ag/AgCl (3 M NaCl) were converted to the reversible hydrogen elec- trode (RHE) scale according to the following equation:
= + + ∙
E vs RHE( ) E EAg AgCl/ (vs SHE) 0.059V pH (1) whereEis the experimentally measured potential vs. Ag/AgCl reference electrode and EAg AgCl/ (vs SHE) = 0.201 V at 23 °C, where SHE is the standard hydrogen electrode. The electrocatalytic activity of the as- prepared working electrodes was investigated with cyclic voltammetry (CV) in the potential range between 0 and−1000 mV vs Ag/AgCl (3 M NaCl) at a scan rate of 10 mV s−1. Linear sweep voltammetry (LSV) measurements with a rotating disk electrode (RDE) were carried out between the same potentials varying the rotation rate between 500 and 2500 rpm. The linear sweep voltammograms are depicted and used after background correction. Methanol tolerance was investigated by chronoamperometric measurements at 0.51 V vs RHE in oxygen satu- rated 0.1 M KOH solution with continous oxygen bubbling. After 360 s, 1 cm33 M methanol solution was added to the electrolyte solution.
3. Results and discussion 3.1. Morphology
Morphology of the as-prepared composites was investigated by
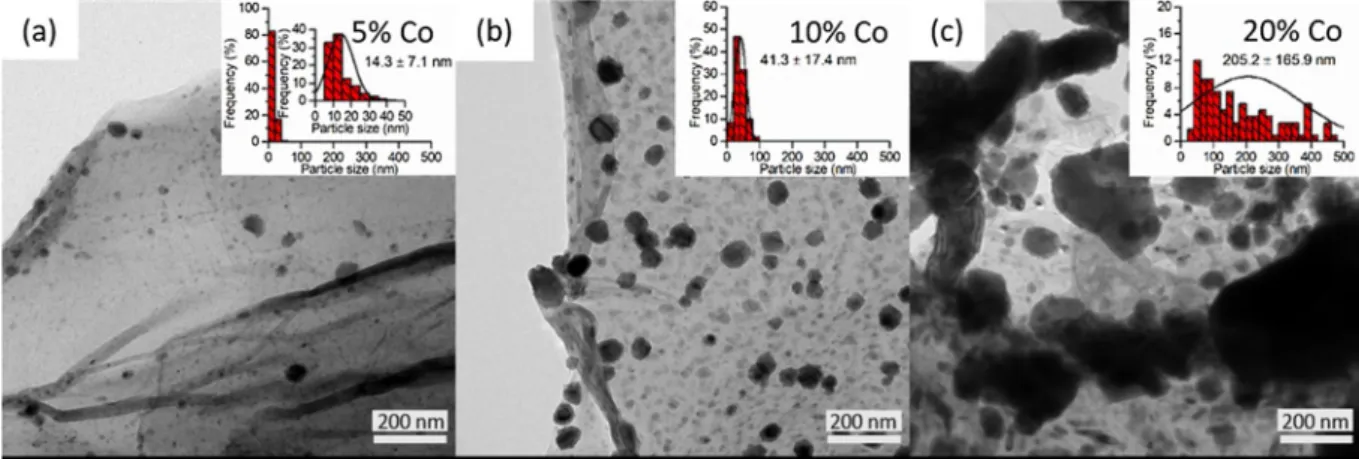
transmission electron microscopy.Fig. 2a–cshows well-dispersed na- noparticles on the graphene sheets after the heat treatment. According to the inset graphs ofFig. 2a–c, the size distribution of the particles shifted towards larger sizes with increasing cobalt content. The average size was found to be 14.3 ± 7.1 and 43.1 ± 17.4 nm, and 205.2 ± 165.9 nm in case of 5, 10%, and 20% cobalt content, re- spectively. The bigger, irregular particles evident inFig. 2cwere most likely formed via the merging of primary grains, which broadened the particle size distribution further (Fig. 2cinset).
It is worth noting, that the typical particle size of pure Co4N (the one prepared without graphene support), was an order of magnitude larger.
As it is seen inFig. S1., grains with diameter of around 2–3μm are characteristic to the sample. This means that graphene facilitates the dispersion of Co4N particles formed via cobalt(II) acetate decomposi- tion on its surface.
3.2. Structure and composition
X-ray diffraction patterns of the samples are shown inFig. 3a. Two reflections can be observed at 43.9° and 51.1°, which correspond to the (111) and (200) crystal planes of Co4N, respectively [16]. The intensity of both reflections increases with the increasing cobalt content of the composites. Another reflection corresponding to the layered structure of graphene is visible at 26.6°. [45].
Raman spectroscopy was utilised for further structural analysis.
Fig. 3bshows the Raman spectra of the as-prepared samples. In the graphene-containing samples the Stokes G and D band are observed at 1587 cm−1and 1346 cm−1, respectively. The G band is attributed to the planar motion of thesp2hybridized carbon atoms in the graphene layer, while the D band is associated with the degree of the defects in the structure of the carbon atoms close to the edge of the layer [35].
The intensity ratio of the D and G band was calculated to be 1.03 in each sample. This confirms the TEM-based assumption that Co4N doping leaves the graphene structure itself intact. The results match previously reported Raman spectra of graphene and nitrogen doped graphene well [46]. Further peaks were observed at 473, 513, 667 and 845 cm−1, which can be assigned to the cobalt nitride phase [47].
X-ray photoelectron spectroscopy was used to investigate the ele- mental composition of the samples. Although spectra recorded ex-situ might differ from in-situ (or operando) measurements taken during the oxygen reduction reaction, they do provide valuable information about the initial condition of the catalysts.Fig. 4ashows the Co 2p spectrum of the Co4N/NG composite with 10% Co content. The peaks observed at 780.4 and 795.9 eV are close to the 2p3/2 and 2p1/2 peaks of Co(II), respectively. An excess Co(II) satellite peak at 786.5 eV is also seen.
These results are consistent with previous literature reports [48,49].
Furthermore, there is a fourth peak at 782.7 eV, which might be the
Fig. 2.TEM images of Co4N /NG nanocomposites with (a) 5 wt%, (b) 10 wt%, and (c) 20 wt% Co content. Inset graphs show the corresponding Co4N particle size distributions.
result of the Co–N interaction [50,51]. Similar results were obtained for Co4N and the additional Co4N/NG composites (Fig. S2a, c, ande), which prove the formation of the desired nitride structure. During ammonia treatment, nitrogen atoms can be incorporated into the gra- phene layer, and different nitrogen moieties can be formed.Fig. 4b shows the deconvoluted N 1 s spectrum of the same composite with 10% Co. Thefirst two peaks at 398.8 eV and 401.3 eV can be attributed
to the pyridinic and pyrrolic types of nitrogen, respectively. According to a previous DFT study by Zhang et al. and several further experi- mental results, the presence of such moieties can highly improve ORR activity in carbon structures [24,33,34,52,53]. An additional peak at 403.8 eV can be attributed to oxidized pyridinic nitrogen groups [54], while another peak at 397.8 eV can be ascribed to the Co-N interaction [47]. Similar results were obtained for other Co4N/NG composites as it Fig. 3.(a) X-ray diffractograms and (b) Raman spectra of the as-prepared Co4N/NG composites with different Co content.
Fig. 4.Co 2p (a) and N 1 s (b) and O 1 s (c) spectra of the Co4N/NG composite with 10% Co content. (d) N 1 s spectrum of the pure Co4N prepared without nitrogen- doped graphene.
is seen inFig. S2 d, and f., while only the peaks at 398.8 eV, 401.3 eV and 403.8 eV were observed in case of nitrogen doped graphene pre- pared without cobalt nitride (Fig. S2b). The nitrogen content of gra- phene in the composites was calculated from XPS results and it is summarized inFig. S3. The N/C ratio changed from 0.062 to 0.086 upon increasing the cobalt content from 5 to 10% and only a minor further increment was observed in case of higher Co content. Similar results were reported by Choi et al.. They investigated an iron oxide/
nitrogen doped carbon nanotube composite and found that the nitrogen content of the nanotube was modified by the transition metal content of the composites [55].
Fig. 4cshows the deconvoluted O 1 s peak of the composite con- taining 10% Co. The peaks at 533.8 eV and 531.88 eV correspond to hydroxyl and carboxyl groups, respectively. The presence of these groups on the surface can be due to adsorbed water and carbon dioxide molecules or to previously existing functional groups that remained intact during the ammonia treatment of graphene oxide [56–58]. A further peak at 530.7 eV can be attributed to the Co(II)–O interaction.
This implies that an oxide layer exists on the surface beside the nitride [58,59]. The latter phenomenon is well-known from previous reports.
Azuma et al. investigated the surface of sputter deposited cobalt nitride films, and oxygenated groups were always found on the surface as well.
However, the O 1 s peak was weakened after Ar+ion etching the sur- face, and the layer thickness was around 0.5 nm [60].
Fig. S4compares the O 1 s spectra of the nitrogen-doped graphene, the composites, and pure Co4N. Similar results were obtained in these cases. The intensity of the peak at 530.7 eV increased with increasing Co content, and a small peak shift was also observed with changing component ratio. Furthermore, the nitride formation can also be con- firmed on the basis of the N 1 s spectrum of Co4N prepared in the ab- sence of graphene. The peak at 397.8 eV inFig. 4dcan be assigned to nitrogen in the metal nitride structure [47].
3.3. Electrocatalytic activity
ORR activity was investigated by cyclic voltammetry (CV)(Fig. S5) and linear sweep voltammetry (LSV) in 0.1 M KOH solution using a rotating disk electrode. To compare the obtained oxygen reduction activities to that of a commercially used noble metal catalyst, the as- prepared Pt/CB was also tested under the same conditions (Fig. S6).
The measured current density increased with the disk electrode rotation rate (Fig. 5aandFig. S7).Fig. 5bcompares LSV curves recorded at 1500 rpm. The highest onset potential was 0.91 V (at 5% Co content), which is close to the 0.96 V onset potential of the widely-used Pt/CB.
On other electrodes, the onset potential decreased slightly with in- creasing Co content (0.88 V and 0.87 V in case of 10 and 20% of Co content, respectively), while it was only 0.69 V in the case of the Co4N sample prepared without graphene sheets. The highest reduction cur- rent density was measured with 10% Co content (4.1 mA ∙cm−2), which is remarkably close to that measured for the Pt/CB modified electrode (4.4 mA∙cm−2). These results prove the enhanced electro- catalytic activity of the composites compared that of standalone ni- trogen-doped graphene or cobalt nitride.
Lower reduction current densities were measured (Fig. 5c)over the 5% and 20% composites (3.50 and 2.74 mA cm−2, respectively), which is consistent with the change in Co4N particle size. In the 5% Co composite 14 nm nanoparticles were formed, which then showed higher electrocatalytic activity based on the higher onset potential (Fig. 5b). Overall, the 10% composite was a more promising catalyst than the 5% one even though it featured larger average particle dia- meter (41.3 nm vs. 14.3 nm inFig. 2a–b) and consequently, its onset potential was somewhat smaller. The changes in the onset potentials could be explained by the different particle sizes. The electrocatalytic activity of cobalt nitride particles increased with their decreasing average diameter. Similar phenomena were observed in case of similar systems in the literature. Liu et al investigated the ORR activity of CoO
particles with different average particle sizes below 10 nm and found that the half wave potential of the LSV curves were decreased from 0.77 V vs RHE to 0.74 V vs RHE by increasing the particle size that means that the ORR activity was better in case of lower particle size. It was found that the turnover frequency per CoO sites are independent of the particle size in the range of 3–7 nm. However, the enlarged specific surface area and thus the enlarged interface with the carbon support could cause the difference between the electrocatalytic activity [61].
Furthermore, Qui et al studied the size dependence of the electron structure of cobalt nanoparticles. The results showed, that there is a stronger CoeO interaction in case of lower particle size [62]. It means that the OeO bond of the adsorbed oxygen would be weaker in case of smaller particle sizes due to the stronger interaction between the cobalt and oxygen atoms. It would enhance the ORR activity, but it has to note, that the too strong metal−oxygen bond can also cause a decrease in ORR activity, when the desorption energy of the intermediers are too high [63]. Ohnishi et al also investigated the oxygen adsorption on the surface of nitrides. They found that the density of adsorption sites for molecular oxygen was increased from 0.18 to 0.57 molecules nm−2by decreasing the particles size from 23 to 7 nm. It was found that the higher oxygen adsorption density is consistent with the higher ORR activity [64].
However, nitrogen doped graphene also takes part in the oxygen reduction reaction as a catalyst. A possible explanation for the better activity of the 10% Co contained sample could be the different nitrogen content in the graphene layers of the composites. AsFig. S3shows, a higher N/C ratio was reached in graphene in case of the sample with 10% Co content. Consequently, this composite has a higher number of active sites on the graphene surface. Lai et al. investigated several types of nitrogen doped graphene and found that the increased amount of nitrogen moieties can affect the electrocatalytic activity positively [65].
This could be the origin of the higher current density in the 10% Co case even though the surface area of these cobalt nitride particles was not the largest in this study.
As for the electrodes modified with either the 20% Co sample or the standalone Co4N particles, these exhibited the lowest onset potentials and the lowest current densities. The most likely explanation for this is the significantly increased Co4N particle size (Fig. 2c and Fig. S1).
While the absolute amount of Co4N is higher here than in the 5% and 10% cases, most of the nitride material is in a non-nanoparticulate form, therefore, the number of catalytically active sites is reduced and this manifests in a low catalytic activity.
To quantitatively characterize the electrocatalytic ORR activity of our composites, Tafel analysis was performed. This is a widely-used method to examine the reaction mechanism of an electrocatalyst, where the sensitivity of the electric current response to an applied potential is recorded. [66]. The kinetic current densities were calculated using the Koutecky-Levich equation [67]:
= + = +
j j j nFkc nFD ν− c ω
1 1 1 1 1
k d Ob 0.62
O2/3 1/6Ob 1/2
2 2 2 (2)
wherejkandjdare the kinetic and diffusion limited current densities, whilej is the experimentally measured current density. The electron transfer number of the oxygen reduction reaction can be also calculated with this equation (see below), wherenis the number of the electrons transferred per oxygen molecule (electron transfer number), Fis the Faraday constant,kis the rate constant of the oxygen reduction reac- tion,cOb2is the oxygen concentration in the electrolyte (1.2×10⁻⁶mol cm−3in 0.1 M KOH at 23 °C) [68], DO2is the diffusion coefficient of oxygen in the electrolyte (1.9×10⁻⁵cm2s−1in 0.1 M KOH at 23 °C) [68],νis the kinetic viscosity of the solution (8.9×10⁻³cm2s−1) [69]
andωis the angular velocity of the electrode [rad s−1]. One revolution per second corresponds to 2πrad s−1[70].
During oxygen reduction reaction, several different adsorbed spe- cies can be found on the catalyst surface, like, e.g., oxygen molecules, additional oxygen-containing ORR intermediers, other components of
the electrolyte, etc. The presence and the distribution of these groups can significantly influence the reaction mechanism [71]. Damjanovic et al. previously showed that the electrode surface coverage could change in different potential ranges, which implies different rate-de- termining steps in the different reaction pathways of oxygen reduction reaction. At low overpotentials (i.e., when the reaction rate is also low) the heat of adsorption of any species decreases linearly with increasing coverage. This means, that the so-called Temkin adsorption conditions are predominant [72]. However, the surface coverage of various reac- tion intermediates decreases with increasing overpotential and reaction rate, preventing interactions among adsorbed species and only a monolayer is formed. The latter are the so-called Langmuir conditions [73]. Although these are the most commonly found adsorption condi- tions, several authors argued that it is often difficult to unambiguously determine the possible rate determining step employing Tafel slope analysis [66].
A high and a low current density region are observable inFig. 5d.
The two different slopes imply different rate-determining steps in each potential region. Tafel slopes in the low current density region were determined to be−65,−57,−62,−83, and−61 mV decade−1 in case of the 5, 10, and 20% composites, nitrogen doped graphene and Co4N, respectively (Fig. S8). The preferred lower Tafel slope was achieved in case of the composite with 10% Co content. Furthermore, this slope was even lower than that of the Pt/CB catalyst (−63 mV decade−1). (See Fig. S6c).
In contrast, Tafel slopes were found to be −194, −154, −157,
−194, and−479 mV decade−1for the same composites in the high current density region. The composite with 5% Co content, the un- decorated nitrogen doped graphene, and the electrodes modified with Co4N particles (Fig. S8) gave lower Tafel slopes. This could suggest that the amount of adsorbed species and reaction intermediers change dif- ferently with the applied potential [66]. Similarly to the previous po- tential range, the lowest slope was achieved in case of 10% Co content.
However, it was still higher than that of the Pt/CB catalyst (−127 mV decade−1). This difference could be due to the fact, that the oxygen reduction reaction is much more complex in case of a non-noble metal catalyst than on the surface of the platinum nanoparticles [71].
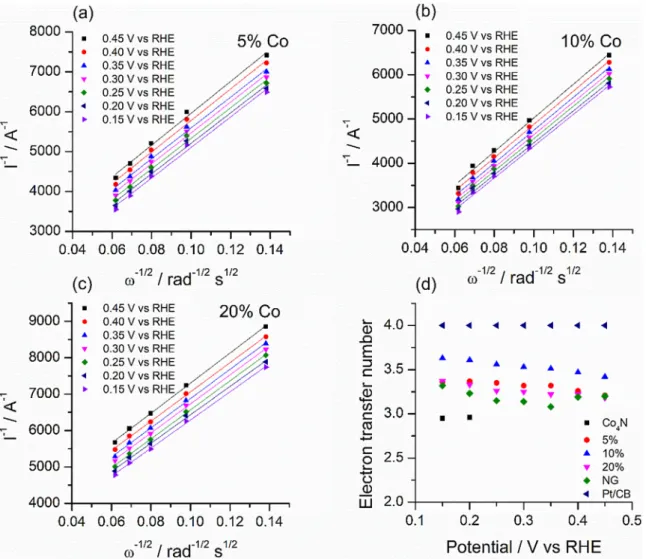
To get further information on the pathway of the oxygen reduction reaction, electron transfer numbers were calculated via Eq. (2) from the LSV measurements using rotating disk electrodes at different rotation rates. Results are depicted inFig. 5aandFig. S7.
Koutecky-Levich plots at various potentials inFig. 6a-cshow par- allel, straight trend lines, implying thefirst-order kinetics of the reac- tion (Results for the other samples are shown inFig. S9) [42]. It should be noted that the extrapolated K-L plots have non-zero intercepts. This may indicate that there is a mixed kinetic-diffusion control in the in- vestigated potential range [28]. This kind of mixed kinetic control was previously discussed by Alexeyeva and also by Vikkisk et al. [22,32].
Furthermore, a similar result was observed in the case of the Pt/CB composite as well. Electron transfer numbers were calculated from the slope of the plots and summarized inFig. 6d. It is seen, that the highest electron transfer number of 3.6 was achieved in the 10% composite, Fig. 5.(a) LSV curves of 10% Co4N/NG composite modified glassy carbon electrode at different rotation rates, (b) LSV curves recorded at 1500 rpm of the as- prepared Co4N/NG composites with different Co contents and Pt/CB on GCE. (c) Reduction current densities from LSV measurements obtained at 1500 rpm (taken at 0 V vs RHE), and (d) Tafel plots of the LSV curves measured at 1500 rpm. All measurements were carried out in 0.1 M KOH solution at 10 mVs−1scan rate.
while slightly lower values were obtained in any other studied com- posite and the nitrogen doped graphene. The lowest electron transfer number of 2.9 was calculated for the Co4N-modified glassy carbon electrode. It was calculated only at lower potentials due to the more negative onset potential.
The schematic illustration inFig. 7depicts the four-electron process as the dominant reaction path in our system. The less favorable two- electron process also takes place in oxygen reduction, where peroxides are first formed, then subsequently reduced to hydroxide ions in a further two-electron step.
We assume that both parts of the composite have active sites where the oxygen reduction reaction can take place. Several papers discuss the possible active sites in nitrogen doped graphene. Since nitrogen has a higher electronegativity than carbon, partially positively charged carbon species can form in the neighborhoods of nitrogen atoms. These types of carbon atoms are more favorable for the adsorption of oxygen molecules [33,34]. Furthermore, Yao et al. wrote about the active sites in the cobalt nitride/nitrogen doped carbon structure. It was found that the cobalt atoms are also positively charged due to the presence of the more electronegative nitrogen atoms. Therefore, cobalt atoms in the nitride structure could be an ideal active site for the oxygen reduction reaction. In case of a Co-N-C interaction, the cobalt atoms are more positively charged than carbon atoms, which means that it is more fa- vorable for the adsorption of oxygen molecules [74].
Platinum-based ORR electrocatalysts are prone to loss of activity due to impurities like methanol, carbon monoxide etc. [6]. Methanol, at
the same time, can diffuse through membranes used in fuel cell systems, and this so-called fuel crossover or specifically, methanol crossover can considerably reduce fuel cell efficiency in direct methanol fuel cells.
The methanol tolerance of our most active 10% Co composite was tested using chronoamperometry as it is shown in Fig. 8. Relative Fig. 6.Koutecky-Levich plots of GCE modified with (a) 5%, (b) 10%, (c) 20% composites obtained from rotating disk electrode LSV measurements, and (d) summarizing the calculated electron transfer numbers.
Fig. 7.Schematic of oxygen reduction reaction on the surface of Co4N/NG composite in alkaline media.
current (I/I0) was calculated from the ratio of the measured and the initial currents, and results were compared to that of a noble metal Pt/
CB catalyst.
When methanol was added to the electrolyte solution at 360 s, the current dropped steeply for the Pt/CB modified electrode. This means that the presence of methanol decreases the ORR electrocatalytic ac- tivity of the platinum nanoparticles due to their activity towards me- thanol oxidation reaction (MOR) [75]. However, there was no change in the current response of the Co4N/NG modified electrode, which shows its superior methanol tolerance over the widely-used noble metal Pt/CB catalyst.
4. Conclusion
Nitrogen-doped graphene sheets were decorated with cobalt-nitride (Co4N) nanoparticles in a single-step synthesis via the high-temperature ammonia atmosphere annealing of the mixture of cobalt(II) acetate and lyophilized graphene oxide. The formed composites were characterized by transmission electron microscopy (TEM), X-ray diffraction (XRD), X- ray photoelectron and Raman spectroscopy (XPS), and electrochemical techniques. Pyridinic and pyrrolic nitrogen moieties were incorporated into the graphene network during the ammonia treatment. The dia- meter of cobalt nitride nanoparticles increased from 14 to 201 nm with increasing Co content in the composites. Electrocatalytic properties of the catalysts were measured in a standard three-electrode setup in oxygen and nitrogen saturated 0.1 M potassium hydroxide solution using cyclic and linear sweep voltammetry. A rotating disk electrode was used for the LSV measurements at different rotation rates. The ORR activity of the 10% Co4N/NG non-noble metal catalyst was comparable to that of the widely-used carbon black supported platinum nano- particles with a reduction current density of 4.1 mA cm−2under alka- line conditions. The reported composite showed excellent methanol tolerance in contrast to the platinum-based Pt/CB composite, which is a considerable advantage over noble-metal based ORR electrocatalysts.
Acknowledgements
Financial support from the Hungarian GINOP-2.3.2-15-2016-00013
“Intelligent materials based on functional surfaces−from syntheses to applications”project, the NKFIH (OTKA) K126065 (Á.K.) and K120115 (Z.K.) grants is acknowledged.
Appendix A. Supplementary data
Supplementary material related to this article can be found, in the online version, at doi:https://doi.org/10.1016/j.apcatb.2018.06.054.
References
[1] B.C.H. Steele, A. Heinzel, Nature 414 (2001) 345–352.
[2] S. Wang, S.P. Jiang, National Science Rev. 4 (2017) 163–166.
[3] R. O’Hayre, S.W. Cha, W. Colella, F.B. Prinz, Fuel Cell Fundamentals, Wiley, 2009.
[4] V. Stamenkovic, B.S. Mun, K.J.J. Mayrhofer, P.N. Ross, N.M. Markovic, J. Rossmeisl, J. Greeley, J.K. Nørskov, Angew. Chem. 118 (2006) 2963–2967.
[5] A. Sarapuu, E. Kibena-Põldsepp, M. Borghei, K. Tammeveski, J. Mater. Chem. A 6 (2018) 776–804.
[6] B. Cao, G.M. Veith, R.E. Diaz, J. Liu, E.A. Stach, R.R. Adzic, P.G. Khalifah, Angew.
Chem. 52 (2013) 10753–10757.
[7] S. Dou, X. Li, L. Tao, J. Huo, S. Wang, Chem. Commun. 52 (2016) 9727–9730.
[8] H. Wang, Y. Liang, Y. Li, H. Dai, Angew. Chem. 50 (2011) 10969–10972.
[9] J. Yu, G. Chen, J. Sunarso, Y. Zhu, R. Ran, Z. Zhu, W. Zhou, Z. Shao, Adv. Sci. 3 (2016) 1600060.
[10] T. Sun, Y. Jiang, Q. Wu, L. Du, Z. Zhang, L. Yang, X. Wang, Z. Hu, Catal. Sci.
Technol. 7 (2017) 51–55.
[11] S. Jing, L. Luo, S. Yin, F. Huang, Y. Jia, Y. Wei, Z. Sun, Y. Zhao, Appl. Catal. B:
Environ. 147 (2014) 897–903.
[12] D.J. Ham, J.S. Lee, Energies 2 (2009) 873–899.
[13] C.R. Raj, A. Samanta, S.H. Noh, S. Mondal, T. Okajima, T. Ohsaka, J. Mater. Chem.
A 4 (2016) 11156–11178.
[14] P. Chen, K. Xu, Z. Fang, Y. Tong, J. Wu, X. Lu, X. Peng, H. Ding, C. Wu, Y. Xie, Angew. Chem. 54 (2015) 14710–14714.
[15] P. Chen, K. Xu, Y. Tong, X. Li, S. Tao, Z. Fang, W. Chu, X. Wu, C. Wu, Inorg. Chem.
Front. 3 (2016) 236–242.
[16] J. Theerthagiri, S.B. Dalavi, M. Manivel Raja, R.N. Panda, Mater. Res. Bull. 48 (2013) 4444–4448.
[17] M.D. Meganathan, S. Mao, T. Huang, G. Sun, J. Mater. Chem. A 5 (2017) 2972–2980.
[18] X. Chen, J. Chang, H. Yan, D. Xia, J. Phys. Chem. C 120 (2016) 28912–28916.
[19] K. Uosaki, G. Elumalai, H. Noguchi, T. Masuda, A. Lyalin, A. Nakayama, T. Taketsugu, J. Am. Chem. Soc. 136 (2014) 6542–6525.
[20] Y. Zheng, Y. Jiao, M. Jaroniec, Y. Jin, S.Z. Qiao, Small 8 (2012) 3550–3566.
[21] Y. Qin, J. Li, J. Yuan, Y. Kong, Y. Tao, F. Lin, S. Li, J. Power Sources 272 (2014) 696–702.
[22] N. Alexeyeva, E. Shulga, V. Kisand, I. Kink, K. Tammeveski, J. Electroanal. Chem.
648 (2010) 169–175.
[23] S. Jiang, Y. Ma, G. Jian, H. Tao, X. Wang, Y. Fan, Y. Lu, Z. Hu, Y. Chen, Adv. Mater.
21 (2009) 4953–4956.
[24] L. Qu, Y. Liu, J.-B. Baek, L. Dai, ACS Nano 4 (2010) 1321–1326.
[25] M. Li, L. Zhang, Q. Xu, J. Niu, Z. Xia, J. Catal. 314 (2014) 66–72.
[26] Z. Yang, Z. Yao, G. Li, G. Fang, H. Nie, Z. Liu, X. Zhou, Xa. Chen, S. Huang, ACS Nano 6 (2012) 205–211.
[27] L. Chen, X. Cui, Y. Wang, M. Wang, R. Qiu, Z. Shu, L. Zhang, Z. Hua, F. Cui, C. Wei, J. Shi, Dalton Trans. 43 (2014) 3420–3423.
[28] M. Vikkisk, I. Kruusenberg, S. Ratso, U. Joost, E. Shulga, I. Kink, P. Rauwel, K. Tammeveski, RSC Adv. 5 (2015) 59495–59505.
[29] Y. Wang, L. Tao, Z. Xiao, R. Chen, Z. Jiang, S. Wang, Adv. Funct. Mater. 28 (2018) 1705356.
[30] K. Hu, L. Tao, D. Liu, J. Huo, S. Wang, ACS Appl. Mater. Interfaces 8 (2016) 19379–19385.
[31] W.Y. Wong, W.R.W. Daud, A.B. Mohamad, A.A.H. Kadhum, K.S. Loh, E.H. Majlan, Int. J. Hydrogen Energy 38 (2013) 9370–9386.
[32] M. Vikkisk, I. Kruusenberg, U. Joost, E. Shulga, I. Kink, K. Tammeveski, Appl. Catal.
B: Environ. 147 (2014) 369–376.
[33] L. Zhang, Z. Xia, J. Phys. Chem. C 115 (2011) 11170–11176.
[34] L. Zhang, J. Niu, L. Dai, Z. Xia, Langmuir : ACS J. Surfaces Colloids 28 (2012) 7542–7550.
[35] J.-h. Ma, L. Wang, X. Mu, L. Li, Int. J. Hydrogen Energy 40 (2015) 2641–2647.
[36] L. Tao, S. Dou, Z. Ma, A. Shen, S. Wang, Int. J. Hydrogen Energy 40 (2015) 14371–14377.
[37] J. Zhu, M. Xiao, X. Zhao, K. Li, C. Liu, W. Xing, Chem. Commun. 50 (2014) 12201–12203.
[38] S. Dou, L. Tao, R. Wang, S. El Hankari, R. Chen, S. Wang, Adv. Mater. (2018).
[39] B. Zheng, J. Wang, F.-B. Wang, X.-H. Xia, Electrochem. Commun. 28 (2013) 247–226.
[40] X. Li, H. Wang, J.T. Robinson, H. Sanchez, G. Diankov, H. Dai, J. Am. Chem. Soc.
131 (2009) 15939–15944.
[41] Y. Zhao, S. Chen, B. Sun, D. Su, X. Huang, H. Liu, Y. Yan, K. Sun, G. Wang, Sci. Rep.
5 (2015) 7629.
[42] Y. Li, K.A. Kuttiyiel, L. Wu, Y. Zhu, E. Fujita, R.R. Adzic, K. Sasaki, ChemSusChem 10 (2017) 68–73.
[43] W.S. Hummers, R.E. Offeman, J. Am. Chem. Soc. 80 (1958) 1339–1339.
[44] R. Puskás, T. Varga, A. Grósz, A. Sápi, A. Oszkó, Á. Kukovecz, Z. Kónya, Surf. Sci.
648 (2016) 114–119.
[45] F.M. Hassan, V. Chabot, J. Li, B.K. Kim, L. Ricardez-Sandoval, A. Yu, J. Mater.
Chem. A 1 (2013) 2904.
[46] J. Ma, A. Habrioux, Y. Luo, G. Ramos-Sanchez, L. Calvillo, G. Granozzi, Fig. 8.Chronoamperometric methanol tolerance responses of Pt/CB and 10%
Co4N/NG composite modified glassy carbon electrode in the oxygen reduction reaction. Measurements were carried out in oxygen saturated 0.1 M KOH so- lution at 0.51 V vs RHE.
P.B. Balbuena, N. Alonso-Vante, J. Mater. Chem. A 3 (2015) 11891–11904.
[47] Y. Zhang, B. Ouyang, J. Xu, G. Jia, S. Chen, R.S. Rawat, H.J. Fan, Angew. Chem. 55 (2016) 8670–8674.
[48] K. Hada, M. Nagai, S. Omi, J. Phys. Chem. B 105 (2001) 40847–44093.
[49] Z. Yao, A. Zhu, J. Chen, X. Wang, C.T. Au, C. Shi, J. Solid State Chem. 180 (2007) 26357–22640.
[50] K. Niu, B. Yang, J. Cui, J. Jin, X. Fu, Q. Zhao, J. Zhang, J. Power Sour. 243 (2013) 65–71.
[51] Z. Liu, L. Ji, X. Dong, Z. Li, L. Fu, Q. Wang, RSC Adv. 5 (2015) 62597–66264.
[52] T.C. Nagaiah, S. Kundu, M. Bron, M. Muhler, W. Schuhmann, Electrochem.
Commun. 12 (2010) 3387–3341.
[53] K. Gong, F. Du, Z. Xia, M. Durstock, L. Dai, Science 323 (2009) 7607–7764.
[54] T. Susi, T. Pichler, P. Ayala, Beilstein J. Nanotechnol. 6 (2015) 177–192.
[55] C.H. Choi, S.H. Park, S.I. Woo, Int. J. Hydrogen Energy 37 (2012) 4563–4570.
[56] Y.J. Oh, J.J. Yoo, Y.I. Kim, J.K. Yoon, H.N. Yoon, J.-H. Kim, S.B. Park, Electrochim.
Acta 116 (2014) 1187–1128.
[57] Z. Xing, Z. Ju, Y. Zhao, J. Wan, Y. Zhu, Y. Qiang, Y. Qian, Sci. Rep. 6 (2016) 26146.
[58] Y. Su, Y. Zhu, H. Jiang, J. Shen, X. Yang, W. Zou, J. Chen, C. Li, Nanoscale 6 (2014) 15080–15089.
[59] Z. Yao, X. Zhang, F. Peng, H. Yu, H. Wang, J. Yang, Int. J. Hydrogen Energy 36 (2011) 19557–11959.
[60] M. Azuma, M. Kashihara, Y. Nakato, H. Tsubomura, J. Electroanalytical Chem.
Interfacial Electrochem. 250 (1988) 73–82.
[61] J. Liu, L. Jiang, B. Zhang, J. Jin, D.S. Su, S. Wang, G. Sun, ACS Catal. 4 (2014) 2998–3001.
[62] Z. Cui, C. Xie, X. Feng, N. Becknell, P. Yang, Y. Lu, X. Zhai, X. Liu, W. Yang, Y.D. Chuang, J. Guo, J. Phys. Chem. Lett. 8 (2017) 319–325.
[63] M. Shao, A. Peles, K. Shoemaker, Nano Lett. 11 (2011) 3714–3719.
[64] R. Ohnishi, K. Takanabe, M. Katayama, J. Kubota, K. Domen, J. Phys. Chem. C 117 (2012) 496–502.
[65] L. Lai, J.R. Potts, D. Zhan, L. Wang, C.K. Poh, C. Tang, H. Gong, Z. Shen, J. Lin, R.S. Ruoff, Energy Environ. Sci. 5 (2012) 7936.
[66] T. Shinagawa, A.T. Garcia-Esparza, K. Takanabe, Sci. Rep. 5 (2015) 13801.
[67] S. Ratso, I. Kruusenberg, M. Vikkisk, U. Joost, E. Shulga, I. Kink, T. Kallio, K. Tammeveski, Carbon 73 (2014) 361–370.
[68] R.E. Davis, G.L. Horvath, C.W. Tobias, Electrochim. Acta 12 (1967) 287–297.
[69] N.M. Markovic, H.A. Gasteiger, P.N. Ross, J. Phys. Chem. 100 (1996) 6715–6721.
[70] M. Asahi, S. Yamazaki, S. Itoh, T. Ioroi, Dalton Trans. 43 (2014) 10705–10709.
[71] X. Ge, A. Sumboja, D. Wuu, T. An, B. Li, F.W.T. Goh, T.S.A. Hor, Y. Zong, Z. Liu, ACS Catal. 5 (2015) 4643–4667.
[72] A. Damjanovic, V. Brusic, Electrochim. Acta 12 (1967) 6157–6628.
[73] A.J. Bard, L.R. Faulkner, Fundamentals and Applications, New York: Wiley, 2001, Springer, 2002.
[74] Y. Yao, X. Lin, X. Zhang, J. Mater. Sci. 53 (2018) 7691–7702.
[75] Y.-L. Liu, X.-Y. Xu, C.-X. Shi, X.-W. Ye, P.-C. Sun, T.-H. Chen, RSC Adv. 7 (2017) 88797–88885.