0139–3006 © 2018 Akadémiai Kiadó, Budapest DOI: 10.1556/066.2018.47.4.9
PHYSICO-CHEMICAL ANALYSIS AND PROTEIN FRACTION COMPOSITIONS OF DIFFERENT QUINOA CULTIVARS
J. MUFARIa,b, P. MIRANDA-VILLAa,b*,A. BERGESSEa, N. CERVILLAa and E. CALANDRIa,b aInstitute of Food Sciences and Technology – ICTA. Faculty of Exact Physical and Natural Sciences – UNC, Av.
Vélez Sarsfi eld 1611, 5000 Córdoba. Argentina
bInstitute of Food Sciences and Technology Córdoba – ICyTAC (CONICET), Bv. Dr. Juan Filloy S/N, 5000 Córdoba. Argentina
(Received: 9 February 2018; accepted: 29 May 2018)
Proximate composition and physical parameters in nine quinoa cultivars were determined in order to establish differences among them and to contribute to their characterization. Faro, Pichaman, and Baer varieties cultivars were used. The aim of this research was to evaluate the physical and chemical properties and to characterize the protein fractions. All analysed properties showed signifi cant differences between the cultivars. The physical measurements (weight, shape, size, and density) could be used for improving the technology associated with conditioning, transport, and storage of the grain. The protein content ranged from 15 to 18%, fat 6 to 8%, carbohydrates 70 to 74%, and ash from 3.5 to 4.4%, showing an outstanding nutritional profi le. The relative quantity of soluble proteins (albumins and globulins) ranged from 40 to 65%, except in Faro variety cultivar, which presented 16%. The relative percentage of insoluble protein (prolamins and glutelins) ranged from 25 to 34%. The obtained information in this research could be useful in determining seed-quality, automating production, improving cultivation practices and technologies, and developing food products with enhanced nutritional qualities.
Keywords: quinoa, chemical composition, protein fractions, physical characterisation
Quinoa (Chenopodium quinoa Willd.) is a native grain from the Andean region, that was segregated during the time of the conquest, and presently has gained popularity due to its nutritional and agronomic qualities and its wide usability (ABUGOCH, 2009). Another outstanding feature is the absence of gluten-forming proteins, therefore it may be consumed by people with celiac disease.
The global quinoa production has increased steadily in recent years, due to its high demand and international prices (SCALISE, 2016). The main producing and consuming countries worldwide are Bolivia and Peru. In Argentina, the production of quinoa is focused on the northwest region of the country, and it is used for self-consumption and marketing in retail and cooperative markets (PROFECYT, 2008).
In order to promote the extensive cultivation of quinoa, it is necessary to develop technological innovations in the machinery associated with the different operations of sowing, harvest, post-harvest treatments, and processing of their byproducts. The knowledge of physical characteristics of the grain is essential to select, design, and properly dimension the technologies mentioned above.
In conjunction with the physical properties of the grains, their nutritional quality and changes in the chemical composition during processing must be evaluated. Quinoa is considered a complete food given its nutritional characteristics: protein content (10 to 18%) and quality due to an adequate balance of amino acids; fat (4.5 to 8.75%) with a high
* To whom correspondence should be addressed.
Phone: +54 9 3512892530; e-mail: pmirandavilla@gmail.com
proportion of polyunsaturated fatty acids; total minerals (2.4 to 3.65%); and carbohydrates (54.1 and 64.2%) mainly composed by starch and in a lower proportion fi ber (2.1 to 4.9%) and free sugars (ABUGOCH, 2009). Concerning the total protein content of quinoa, they can be classifi ed into four fractions based on their solubility: albumins and globulins (70%), and glutelins and prolamins in smaller proportion (ABUGOCH, 2009). Its fractionation has great importance, as each fraction contributes to the nutritional quality, functional properties, and applications in the elaboration of certain food products.
On the other hand, saponins (triterpene glucosides) are a major antinutritional factor of quinoa seeds, which are located in their outer layers and are responsible for the bitter taste of the grain (GIANNA et al., 2012). The content of saponins in the grain allows to distinguish the varieties as sweet (<0.11%) or bitter (>0.11%) (GÓMEZ-CARAVACA et al., 2014). Therefore, for bitter varieties it is essential to eliminate them before consumption or transformation of the grains.
Considering the background above, the aim of this research was to analyse the physical and chemical characteristics, and to determinate the protein fraction composition on three quinoa varieties of nine cultivars. This work could provide information for the design of effi cient post-harvest technology and for the application of this grain in multiple products.
1. Materials and methods
1.1. Materials
Quinoa seeds (Chenopodium quinoa Willd.) from “sea level” ecotype varieties Pichaman (P), Faro (F), and Baer (B) were used. These seeds came from the central region of Chile (Ch, year 2011), and the same varieties were cultivated in Río Cuarto (Rc) – Argentina (years 2011-1Rc and 2012-2Rc).
1.2. Physical properties
For the determination of physical parameters, 50 grams of each sample were taken. The weight of 1000 seeds (W1000) was determined by weighing 100 seeds on analytical balance and extrapolating to 1000 seeds. The true density (ρ) was measured by the addition of a certain seed mass in a real volume, using a pycnometer of 30 ml and toluene for the liquid phase (ABALONE et al., 2004). The bulk density (ρb) was determined using a 50 ml graduated cylinder (v), and seeds were manually added until making up the volume; the seed mass (m) occupying that volume was weighed and the quotient ρb=m/v was calculated. These determinations were performed in triplicate. The porosity (ε) was calculated in terms of the relationship between bulk and true density according to the equation ε=(1–ρb/ρ)×100 (SACILIK
et al., 2003). The size of the seeds was determined over 50 seeds randomly selected of each specimen. Width (d1), length (d2), and thickness (d3) were measured in these samples using a digital micrometer (accuracy of 0.01 mm). The equivalent diameter (de) was calculated by the expression de=(d1·d2·d3)1/3 (VILCHE et al., 2003). The sphericity (Φ) is defi ned as the relationship between the equivalent diameter and the seed length (d2). This was measured using the equation proposed by STROSHINE (1998): Φ=(d1·d2·d3)1/3/d2.
1.3. Chemical properties
The analysis of total lipids (L), total protein (P), and ash (A) was carried out as described in AOAC INTERNATIONAL (AOAC, 1990). For the conversion of nitrogen content to crude protein
content, the 6.25 factor (N-factor) was used. The carbohydrates (HC) were calculated by difference. The extraction and quantifi cation of saponins (S) was microwave-assisted (MAE).
In this method, extractions of 1 g of seeds were accomplished with 20 ml of methanol. The MAE extraction parameters were microwave power: 900 W, extraction time: 20 min, and controlled temperature: 80 °C (GIANNA et al., 2012). The moisture content (M) was determined using the standard method described by AOAC (934.01, 1999).
Proteins were sequentially removed according to their solubility; albumins (Alb), globulins (Glo), prolamins (Pro), and glutelins (Glu). For the extraction, 1 g of milled seed was weighed and the corresponding solvent was added (ratio 1:10 w/v): water, phosphate buffer pH 7.5, ethanol 70%, and sodium hydroxide 0.1 M, respectively. After each extraction, the samples were centrifuged at 11 000 g for 15 min at 4 °C, and the supernatant was collected and stored at 2 °C until further use (OSBORNE & MENDEL, 1914). The protein content was determined by the Bradford method (BRADFORD, 1976). All determinations were performed in triplicate.
1.4. Statistical analysis
In order to perform the statistical analysis, the software INFOSTAT© has been used. The results were expressed as the average ± standard deviation. The analysis of variance was applied through the DGC (DiRienzo, Guzmán and Casanoves) multiple comparison test (signifi cance level set at P<0.05) for chemical and physical properties.
2. Results and discussion
Moisture content was between 7.62 and 9.93%. Its content must be controlled to avoid contamination by insects and fungi and losses due to the heating of the grain (STROSHINE, 1998). In addition, variations in moisture content affect exponentially the size, weight, shape, volume, density, and porosity of the grains (VILCHE et al., 2003).
2.1. Physical properties
Table 1 indicates the average values of the physical properties evaluated in quinoa seeds. The weight of 1000 seeds (W1000) ranged from 2.05 g to 2.70 g, similar to those reported by VILCHE and co-workers (2003) with results between 2.5 g and 2.7 g. These values are lower than those reported by GRAF and co-workers (2015), who determined weights per 1000 seeds of 2.8 g, 4.12 g, and 3.02 g for quinoa grains from Chile, Ecuador, and the USA, respectively.
The true density was between 0.87 and 3.28 g ml–1. The seeds that presented higher values were BCh, B1Rc, and B2Rc. On the other side, the bulk density fl uctuated between 0.55 and 0.73 g ml–1. It is important to highlight that the information provided by true and bulk density is useful for calculating heat transfer through the grains, quality control, and design of transport systems, cleaning, and classifi cation (STROSHINE, 1998).
The seeds from Chile presented higher porosity than those cultivated in Río Cuarto, indicating that the fi rst ones present a less compact stacking, with air spaces between them.
The porosity values in seeds sown in Chile and Río Cuarto were between 0.36–0.81 and 0.26–0.78, respectively. The porosity of the grains determines the resistance to air fl ow in aeration and drying processes, allowing to defi ne the exposure times and characteristics of the equipment to be used (STROSHINE, 1998).
Table 1. Gravimetric and dimensional properties and orthogonal dimensions of quinoa seeds SampleW1000 (g)*ρ (g ml–1)*ρb (g ml–1)*εd1 (mm)**d2 (mm)**d3 (mm)**de (mm)**Φ** PCh2.47b±0.010.87b±0.010.55d±0.040.3621.88a±0.151.91a±0.171.12a±0.171.59a±0.150.83a±0.05 P1Rc2.13c±0.011.06b±0.040.73a±0.010.3111.74c±0.111.81b±0.121.00c±0.101.47b±0.100.81b±0.03 P2Rc2.70a±0.020,92b±0.010.62c±0.010.3241.90a±0.111.93a±0.131.14a±0.151.61a±0.120.83a±0.04 FCh2.44b±0.011.16b±0.040.69b±0.010.4061.76c±0.171.83b±0.151.06b±0.141.51b±0.140.83b±0.04 F1Rc2.16c±0.010.81b±0.060.59d±0.020.2701.80b±0.131.84b±0.141.00c±0.181.42b±0.130.81b±0.06 F2Rc2.20c±0.011.00b±0.080.74a±0.010.2561.74c±0.131.78b±0.111.01c±0.111.46b±0.100.82b±0.04 BCh2.29c±0.012.99a±0.290.58d±0.020.8071.70c±0.121.78b±0.150.97c±0.151.43c±0.130.80b±0.05 B1Rc2.14c±0.013.28a±0.060.73a±0.010.7781.72c±0.181.77b±0.120.98c±0.101.44c±0.110.81b±0.04 B2Rc2.05c±0.013.16a±0.030.71a±0.010.7741.70c±0.111.75b±0.140.96c±0.111.42c±0.110.81b±0.03 Ρ: true density; Pb: bulk density; ε: porosity; d1: width; d2: length; d3: thickness; de: equivalent diameter; Φ: sphericity. Average ± SD are reported (*: n=3; **: n=50). Results are expressed on dry basis. Averages with different superscrips in the same column are signifi cantly different (P<0.05).
With regard to the orthogonals dimensions (d1, d2, d3, de, and Φ), it is clearly seen that d1 and d2 prevail over d3, in accordance with fi ndings of VILCHE and co-workers (2003) for quinoa seeds from Perú and Argentina. On the other side, the size of the seeds (de) was between 1.42 and 1.61 mm. According to the classifi cation proposed by IBNORCA (2006), these grains would have been of medium size. The esphericity, used to quantify differences among seed shapes, indicated a spherical fl attened shape (0.80 to 0.83). These results are similar to those reported by VILCHE and co-workers (2003) for quinoa seeds.
2.2. Chemical properties
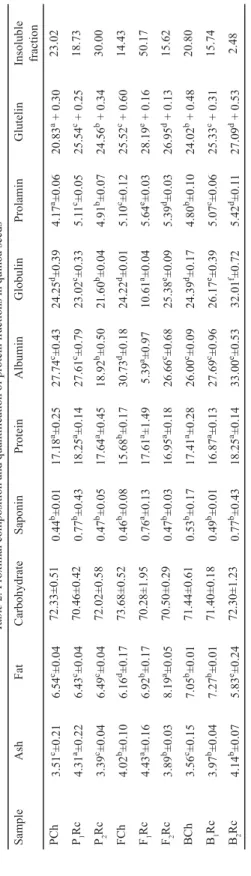
Table 2 presents the results of the chemical analysis. The saponin contents ranged from 0.44 to 0.77%. These results are lower compared to those obtained by WARD (2000). However, they are superior to the fl avour perception limit of 0.11%, therefore they are considered bitter grains (GÓMEZ-CARAVACA et al., 2014).
As with cereals, carbohydrates are the major component of quinoa. However, it does not belong to the same botanical family, and therefore it is called pseudocereal. In this study, carbohydrates ranged from 70.28 to 73.68%. These values were inferior to other commonly consumed grains, such as corn, rice, and barley, which have carbohydrate contents between 83 and 87% (WRIGLEY et al., 2016).
On the other side, the lipid content ranged from 5.83 to 8.19%, which was among the ranges published by ABUGOCH (2009) and VIDUEIROS and co-workers (2013). This percentage is superior to corn’s percentage (4.9%), and that is the reason why it can be considered as a grain with potential for oil extraction.
The results found for ashes were from 3.39 to 4.43%, similar to those reported by VIDUEIROS and co-workers (2013). These values allow to consider this grain as a great source of minerals, such as Ca, Mg, K, P, Fe, Cu, and Zn, exceeding corn, rice, and barley’s mineral content (WRIGLEY et al., 2016).
The total protein percentage varied from 15.45 to 18.25%, similar to those found by VIDUEIROS and co-workers (2013), and higher than those reported by MIRANDA and co-workers (2011). Quinoa’s protein content (N-factor 6.25) exceeds barley (11.02%), corn (10.51%), and rice’s (7.94%) protein values (WRIGLEY et al., 2016). Besides, it has a complete amino acidic profi le with high lysine, cysteine, and methionine contents, all limiting amino acids are present in the mentioned grains. Protein supplementation with quinoa could help to cover essential amino acid requirements suggested by WHO (2002).
Although protein values were similar for all seeds under study, the relative quantity of albumins and globulins varied from 5.39 to 33% and from 10.61 and 32.01%, respectively;
on the other hand, prolamins and glutelins had more limited ranges from 4.17 to 5.64% and from 20.83 to 28.19%, respectively. F1Rc variety presented the lowest albumine and globulin contents and the highest contents of prolamins, glutelins, and high molecular weight proteins (50.17%). These ones do not dissolve in the extraction solvent used. On the other side, B2Rc presented the highest values of albumin and glubulin fractions. According to the literature, quinoa contains 44 to 77% albumins and globulins, wich are the major storage proteins, and a minor fraction of prolamins of 0.5 to 7% (ABUGOCH, 2009). The obtained results for albumins and globulins were between 40 and 65%, except for the F1Rc line, which only presented 16%.
Table 2. Proximal composition and quantifi cation of protein fractions in quinoa seeds SampleAshFatCarbohydrateSaponinProteinAlbuminGlobulinProlaminGlutelinInsoluble fraction PCh3.51c±0.216.54c±0.0472.33±0.510.44b±0.0117.18a±0.2527.74c±0.4324.25d±0.394.17a±0.0620.83a + 0.3023.02 P1Rc4.31a±0.226.43c±0.0470.46±0.420.77b±0.4318.25a±0.1427.61c±0.7923.02c±0.335.11c±0.0525.54c + 0.2518.73 P2Rc3.39c±0.046.49c±0.0472.02±0.580.47b±0.0517.64a±0.4518.92b±0.5021.60b±0.044.91b±0.0724.56b + 0.3430.00 FCh4.02b±0.106.16d±0.1773.68±0.520.46b±0.0815.68b±0.1730.73d±0.1824.22d±0.015.10c±0.1225.52c + 0.6014.43 F1Rc4.43a±0.166.92b±0.1770.28±1.950.76a±0.1317.61a±1.495.39a±0.9710.61a±0.045.64e±0.0328.19e + 0.1650.17 F2Rc3.89b±0.038.19a±0.0570.50±0.290.47b±0.0316.95a±0.1826.66c±0.6825.38e±0.095.39d±0.0326.95d + 0.1315.62 BCh3.56c±0.157.05b±0.0171.44±0.610.53b±0.1717.41a±0.2826.00c±0.0924.39d±0.174.80b±0.1024.02b + 0.4820.80 B1Rc3.97b±0.047.27b±0.0171.40±0.180.49b±0.0116.87a±0.1327.69c±0.9626.17e±0.395.07c±0.0625.33c + 0.3115.74 B2Rc4.14b±0.075.83e±0.2472.30±1.230.77b±0.4318.25a±0.1433.00e±0.5332.01f±0.725.42d±0.1127.09d + 0.532.48 Average ± SD are reported (n=3). Results are expressed on dry basis, g/100 g of seeds. Averages with different superscrips in the same column are signifi cantly different (P<0.05)
From the reported data it was observed that seeds with greater saponin content presented higher proportions of prolamins, glutelins, and residual fractions; however, no differences were found in their total protein values. In another study conducted by the working group on 22 quinoa accessions from different countries of the world, the same trend was observed (unpublished data). For this behaviour there is no explanation in previous studies in the literature, therefore it is proposed to be approached from a macronutrient biosynthetic route or genetic perspective. If the above-mentioned is achieved, quinoa varieties with low level of saponins (sweet fl avor) and high proportion of soluble proteins could be produced.
3. Conclusions
This study provides information on the seed-quality of quinoa grains regarding physical properties and nutritional value. The results of the physical examinations offer basic information for post-harvest quinoa processes. Regarding chemical properties, quinoa grains have higher protein, ash, and lipid contents compared to cereal sources. The protein fractions profi le demonstrated greater contents of albumins, globulins, and glutelins (approximately 25% each) and a minor prolamins proportion (approximately 5%). The grains with higher saponins content presented higher amount of insoluble fractions. Whereas this observation yet has no clear explanation, it could generate future reaserch in order to clarify this behaviour.
*
The authors express their gratitude to the CONICET, the SeCyT, the ICyTAC, the ICTA, and to Dr. Guillermo Peiretti.
References
ABALONE, R., CASSINERA, A., GASTÓN, A. & LARA, M. (2004): Some physical properties of amaranth seeds. Biosyst.
Eng., 89(1), 109–117.
ABUGOCH, J.L.E. (2009): Quinoa (Chenopodium quinoa Willd.): Composition, chemistry, nutritional and functional properties. Adv. Food. Nutr. Res., 58, 1–31.
AOAC (1999): Offi cial Methods of Analysis of the Association of Offi cial Analysis Chemists. AOAC International, Gaithersburg, USA. Method No: Lipids 920.39, total protein 984.13 and ash 923.03
BRADFORD, M. (1976): A rapid and sensitive method for the quantitation of microgram quantitates of protein utilizing the principle of protein-dye binding. Anal. Biochem., 72, 248–254.
GIANNA, V., MONTES, J., CALANDRI, E. & GUZMÁN, C. (2012): Impact of several variables on the microwave extraction of Chenopodium quinoa Willd. saponins. Int. J. Food Sci. Tech., 47, 1593–1597.
GÓMEZ-CARAVACA, A.M., IAFELICE, G., VERARDO, V., MARCONI, E., & CABONI, M.F. (2014): Infl uence of pearling process on phenolic and saponin content in quinoa (Chenopodium quinoa Willd.). Food Chem., 157, 174–178.
GRAF, B., ROJO, L., DELATORRE-HERRERA, J., POULEV, A., CALFIO, C. & RASKIN, I. (2015): Phytoecdysteroids and fl avonoid glycosides among Chilean and commercial sources of Chenopodium quinoa: Variation and correlation to physico-chemical characteristics. J. Sci. Food Agr., 96, 633–643.
IBNORCA (2006): Cereales – Quinua. Parte 2: Clasifi cación y requisitos (312003). (Cereals – Quinoa. Part 2:
Classifi cation and requirements (312003)). IBNORCA, La Paz, Bolivia.
MIRANDA, M., VEGA-GALVEZ, A., URIBE, E., LÓPEZ, J., MARTÍNEZ, E., RODRÍGUEZ, M., QUISPE, I. & DI SCALA, K. (2011):
Physico-chemical analysis, antioxidant capacity and vitamins of six ecotypes of Chilean quinoa (Chenopodium quinoa Willd). Proc. Food Sci., 1, 1439–1446.
OSBORNE, T. & MENDEL, L. (1914): Nutritive properties of proteins of the maize kernel. J. Biol. Chem., 18(1), 1–16.
PROFECYT (2008): Quinoa y amaranto: Debilidades y desafíos tecnológicos del sector productivo. Programa Nacional de Federalización de la Ciencia, la Tecnología y la Innovación. (Quinoa and amaranth: Weaknesses
and technological challenges of the productive sector. National Program for the Federalization of Science, Technology and Innovation.) Available at http://www.cofecyt.mincyt.gov.ar/pdf/productos_alimenticios/
Quínoa_y_Amaranto.pdf (last accessed 16 March 2018).
SACILIK, K., ÖZTÜRK, R. & KESKIN, R. (2003): Some physical properties of hemp seed. Biosyst. Eng., 86(2), 191–198.
SCALISE, J. (2016): Caracterización y diagnóstico de la cadena de valor de la quinua en la Argentina. (Characterization and diagnosis of the value of quinoa in Argentina.) Ministerio de Agroindustria, Buenos Aires, Argentina.
STROSHINE, R. (1998): Physical properties of agricultural materials and food products. Course manual, Purdue University,West Lafayette, Indiana, USA.
VIDUEIROS, S., CURTI, R., DYNER, L., BINAGHI, M., PETERSON, G., BERTERO, H. & PALLARO, A. (2013): Estudio de las propiedades nutricionales de 21 accesiones de quinua del Noroeste Argentino. (Study of the nutritional properties of 21 accessions of quinoa from the Argentine Northwest.) Ciencia y Tecnología de los Cultivos Industriales, 3(5), 39–44.
VILCHE, C., GELLY, M. & SANTALLA, E. (2003): Physical properties of quinoa seeds. Biosyst. Eng., 86(1), 59–65.
WARD, S. (2000): Response to selection for reduced grain saponin content in quinoa (Chenopodium quinoa Willd.).
Field Crop. Res., 68, 157–163.
WHO (2002): FAO/WHO/UNU Expert Consultation on protein and amino acid requirements in human nutrition.
(FAO / WHO / UNU Expert Consultation on protein and amino acid requirements in human nutrition.) WHO technical report series N° 935, Geneva, Italy. 265 pages.
WRIGLEY, C., CORKE, H., SEETHARAMAN, K. & FAUBION, J. (2016): Encyclopedia of food grains (2nd ed., Vol. 1).
Academic Press, Elsevier, USA. 463 pages.