Vapour-liquid equilibrium of acetone-CO
2mixtures of different compositions at the vicinity of the critical point
Balázs Fábián,
1,2,‡George Horvai,
1Abdenacer Idrissi
3and Pál Jedlovszky
4*1
Department of Inorganic and Analytical Chemistry, Budapest University of Technology and Economics, Szt. Gellért tér 4, H-1111 Budapest, Hungary
2
Institut UTINAM (CNRS UMR 6213), Université Bourgogne Franche-Comté, 16 route de Gray, F-25030 Besançon, France
3
Laboratoire de Spectrochimie Infrarouge et Raman (UMR CNRS 8516), University of Lille Nord de France, 59655 Villeneuve d’Ascq Cedex, France
4
Department of Chemistry, Eszterházy Károly University, Leányka utca 6, H- 3300 Eger, Hungary
Running title: Vapour-liquid equilibrium of acetone-CO2 mixtures
‡Present address: Institute of Organic Chemistry and Biochemistry of the Czech Academy of Sciences, Flemingovo nám. 2, CZ-16610 Prague 6, Czech Republic
*Electronic mail: jedlovszky.pal@uni-eszterhazy.hu (PJ)
Abstract
The vapour-liquid equilibrium of acetone-CO2 mixtures is studied by computer simulation at 11 different compositions, ranging from neat CO2 to neat acetone, in a 50-100 K wide range of temperatures at the vicinity of the critical point. The composition dependence of the critical parameters is determined, for the first time, in the entire composition range. It is found that while the critical temperature changes monotonically with the composition, the critical pressure goes through a maximum around the acetone mole fraction value of 0.3, and the critical density might also exhibit a maximum in the acetone mole fraction range of 0-0.2.
Temperature dependence of the surface tension is also determined in the entire composition range. The obtained results agree, in general, well with experimental data; their deviation remains below the range within which different experimental data sets deviate from each other. Since experimental data in this respect exist, unfortunately, only in limited ranges of compositions (at low acetone mole fractions) and temperatures (data above about 335 K are scarce), the present study largely extends the range of thermodynamic conditions in which we have reliable information on the liquid-vapour equilibrium and critical conditions of acetone- CO2 mixtures.
Keywords: acetone-CO2 mixtures; CO2-expanded liquids; vapor-liquid equilibrium;
thermodynamic data; critical point; surface tension
1. Introduction
Supercritical CO2 (scCO2) provides an environmentally friendly alternative to many toxic solvents in a number of industrial processes. Further, mixing scCO2 with suitably chosen polar co-solvents can substantially increase the solubility of several targeted solutes, especially if the weak acid CO2 is complemented by a weak base, such as acetone. Further, physico-chemical and solvation properties of such mixtures, often called as CO2-expanded liquids [!1], can be fine tuned through their composition. Due to this increasing interest, the properties of CO2-acetone mixtures have been investigated both by experimental [!2-25] and computer simulation methods [!17,20,26-30] in the past decades. The majority of these studies focused on the properties of the one-phase mixtures [!6,11-13,18,20,22,23,27,29,30], including selective solvation of various solutes in such systems [!20,30], or on their vapour- liquid equilibrium in a narrow temperature range, usually between 291 and 313 K [!2-5,7,9,10,14,16,17,19,21,26,28]. Experimental data concerning the vapour-liquid equilibrium above this temperature range is scarce. Stievano and Elvassore measured the saturated liquid density at four pressures also at 323 K [!14]. Hsieh et al. reported the composition of the liquid phase in liquid-vapour equilibrium at several pressures along the 313, 333, and 353 K isotherms. [!25]. Traub et al. measured the composition of the coexisting liquid and vapour phases at a single pressure at 333.K [!3], while Bamberger and Maurer measured it along the 323 and 333 K isotherms [!10]. Han et al. measured liquid-vapour equilibrium data in the temperature range between 333 and 393 K [!15]. Sato et al. reported the bubble point of mixtures of different compositions at temperatures between 313 and 353 K [!24], while Wu et al. measured both the bubble and the dew point up to about 480 K [!16]. Little is known about the vapour-liquid equilibrium of these mixtures at near-critical conditions, and, in particular, about the composition dependence of the location of their critical point itself. The critical point of the mixture was determined up to the acetone mole fraction of 0.07 by Reaves et al.[!8], up to 0.10 by Chen et al.[!11], and up to 0.22 by Han et al [!15]. We are not aware, however, of any study concerning the location of the critical point in mixtures of higher acetone content, and addressing the vapour-liquid equilibrium at near- critical conditions in such mixtures. The temperature range relevant in this respect extends from the critical temperature of neat CO2 of 304.2 K [!10] to that of neat acetone of 508.1 K [!10,31]. Accurate information about the location of the critical point in the entire
composition range would, however, be of key importance in the use of these mixtures in supercritical fluid technology [!32].
Besides the critical point itself, the surface tension of such systems is also a quantity of key importance. Clearly, the surface tension of a fluid is a relevant factor in the formation of vapour-liquid equilibrium. CO2-expanded liquids are often used as extracting agents, and the capillary rise of the fluid inside the solid carrier, a quantity that is strongly related to its extracting efficiency, is also governed by its surface tension. Further, such liquids are often used for aerogel drying, where accurate information about the surface tension would be essential to ensure preservation of the aerogel structure. [!33,34] However, accurate prediction of the behaviour of the surface tension is rather difficult to be predicted at thermodynamic conditions close to the critical point of the mixture. We are certainly not aware of any surface tension measurement of acetone-CO2 mixtures in an about 100 K vicinity of the critical point.
Computer simulation methods [!35] can offer a convenient tool to complement experimental investigations in this respect, since they provide such a deep, molecular level insight into the system studied that cannot be obtained by any experimental technique.
However, computer simulations only access a suitably chosen model rather than the real system of interest itself, therefore, the reliability of the chosen model needs to be validated against existing experimental data whenever possible. In this paper, we present results of extensive computer simulations of the vapour-liquid equilibrium of acetone-CO2 mixtures in the entire composition range between the two neat liquids, covering an about 80-100 K broad temperature range below the critical point at each composition. The critical temperature and density is determined from the temperature dependence of the coexisting liquid and vapour densities, while the critical pressure is estimated from the temperature dependence of the saturated vapour pressure. Further, the dew and bubble points of the systems are calculated at various temperatures and pressures, and the surface tension and its temperature dependence is also determined in the entire composition range.
The paper is organized as follows. In sec. 2 the details of the simulations performed and potential models used are provided. Then the obtained results are presented and discussed in detail in section 3. Finally, in section 4 the main conclusions of this study are summarised.
2. Molecular dynamics simulations
Molecular dynamics simulations of the liquid-vapour interface of acetone-CO2
mixtures of various compositions have been performed on the canonical (N,V,T) ensemble with a total number of 4000 molecules. The compositions considered cover the entire composition range from neat CO2 to neat acetone with a mole fraction grid of 0.1. At each composition, a total number of 6-11 simulations have been performed at different subcritical temperatures, with a temperature grid of 10 K, up to temperatures at which the two coexisting phases were still clearly distinguishable from each other, i.e., their interface was sharp and clearly detectable in the basic box. The Y and Z edges of the basic box have been 50 Å long, while the length of the X edge, being perpendicular to the interface, has been set to 250 Å up to the overall acetone mole percentage of 30%, 300 Å between 40% and 60%, 400 at 70% and 80%, 450 Å at 90%, and 500 Å in the case of neat acetone, in order to let a sufficiently wide vapour phase be present in the basic box.
In the simulations, both the acetone [!36] and CO2 [!37] molecules have been modelled by the rigid Transferable Potential for Phase Equilibria (TraPPE) potential model.
The choice of this model was dictated by the fact that it was parametrized by fitting, among others, to experimental vapour-liquid equilibrium data, [!36,37] and it reproduces the experimental critical temperature and density [!10,31,38] of the neat systems rather accurately (see Table 1), although it clearly overestimates their critical pressure, in particular, that of neat acetone. Further, previously we showed that this model combination reproduces the thermodynamics of mixing of these compounds considerably better than others [!29]. Since the TraPPE force field is pairwise additive, the total energy of the system (apart from the long range corrections) is given as the sum of the interaction energy of all molecule pairs. The pair interaction energy of two molecules has been calculated as the sum of the Lennard-Jones and charge-charge Coulomb contributions of every atom pairs, given that the centres of the molecules are closer than 12 Å to each other. The interaction energy of the molecule pairs located farther from each other than this cut-off distance has been truncated to zero. The CH3
groups of the acetone molecules have been treated as united atoms. The interaction parameters of the molecular models used are collected in Table 2.
The simulations have been performed using the GROMACS 5.1 software package [!39]. According to the original parameterization of the models [!36,37,40], long-range correction has been applied for both the electrostatic and the dispersion term. Simulation
parameters have been chosen in accordance with a recent benchmark study of the TraPPE force field [!41]. Thus, the temperature of the system has been controlled by the Nosé-Hoover thermostat [!42,43] with a coupling constant of 0.5 ps, the molecules have been kept rigid by means of the LINCS algorithm [!44], cross interactions have been treated using the Lorentz- Berthelot rule [!35], and the integration time step of 2 fs has been used. Again, in accordance with the aforementioned benchmark study [!41], the long-range term of both electrostatic and Lennard-Jones interactions has been accounted for by means of the sPME method [!45,46]
with a real space cut-off of 12 Å, Fourier grid spacing of 1.5 Å and spline order of 4. Each system has been equilibrated for at least 20 ns. The pressure and coexisting density values have then been obtained from subsequent, 10 ns long equilibrium trajectories. This makes the total length of the trajectory generated in this study about 3 s. The composition, temperature, pressure, coexisting density, and surface tension values corresponding to all systems simulated are deposited to Mendeley Data.
3. Results and discussion
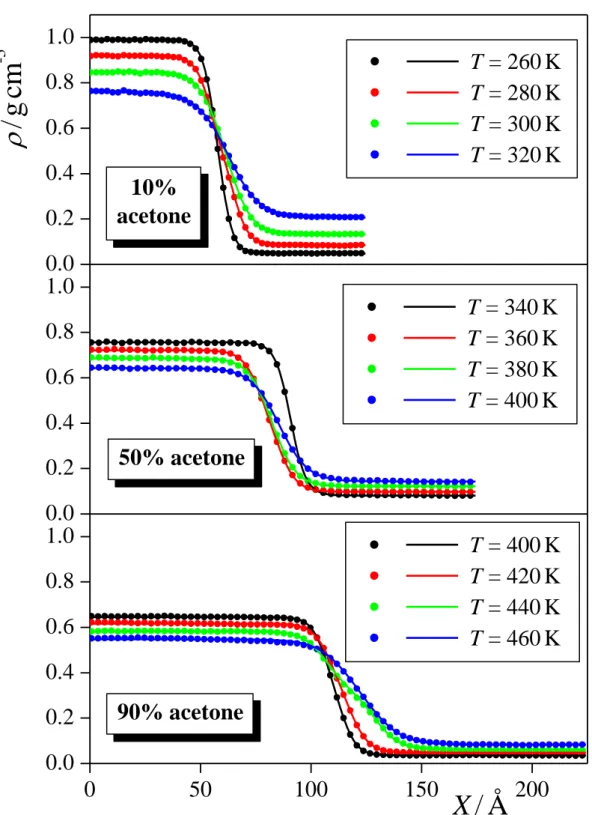
Figure 1 shows the mass density profile (X) of the systems containing 10%, 50%, and 90% acetone along the interface normal axis, X, symmetrized also over the two interfaces present in the basic box, at four selected temperatures in each case. As is seen, the profiles change smoothly between the two phases, and converge well to the bulk phase density value in the middle of both the liquid and the vapour phase.
To obtain the coexisting liquid and vapour phase densities (l and v, respectively), we have fitted the hyperbolic tangent function [!47]:
d X
X l v l v 2 X 0
2 tanh ) 2
(
, (1)
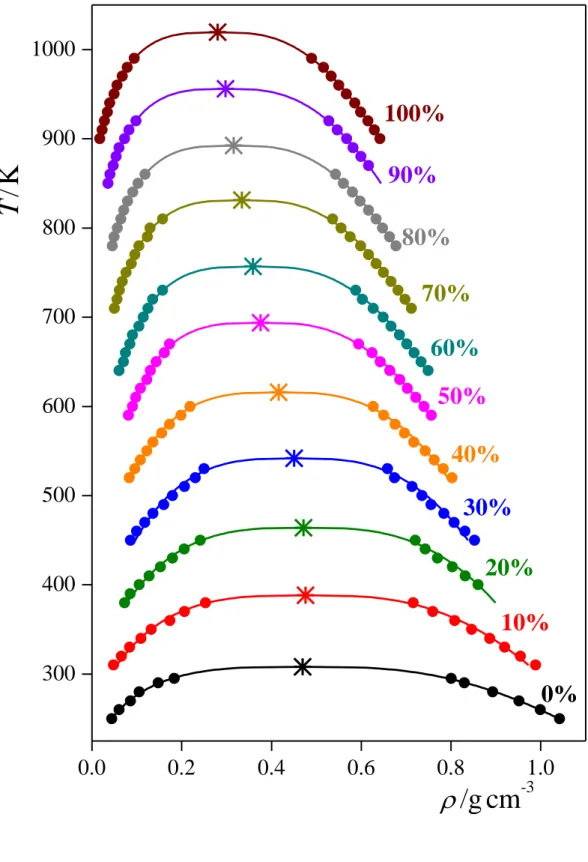
to the mass density profile in each system simulated, where the parameters X0 and d are the position of the Gibbs dividing surface and the interfacial thickness, respectively. The estimated error of the obtained density values never exceeds 5 10-4 g/cm3. The temperature dependence of the coexisting liquid and vapour phase densities, obtained this way, are shown in Figure 2 for all compositions considered. As is seen, the phase envelope gets progressively narrower with increasing acetone mole fraction, due to the higher density of condensed CO2
than that of acetone at these state points. The critical density, c, of these systems has been estimated through the law of rectilinear diameters [!48], i.e.
c c
v
l T
A 1 T 2
, (2)
while for estimating the critical temperature, Tc, we have used the Wegner expansion [!49-51], i.e.,
i
i c i v
l T
B T
) 1 (
1
, (3)
where the critical exponent = 0.325 [!51,52] and = 0.5 [!51]. In fitting the simulation data by eq. 3, we used up to three terms of the expansion, depending on when the fit became instable due to the increasing number of parameters. The estimated error bars of the critical temperature and density values are below 5 K and 0.005 g/cm3, respectively. The obtained critical points are also indicated in Fig. 2. As is seen, the critical density is roughly constant up to the acetone mole fraction, xac, of 0.1-0.2, but further increase of xac leads to its decrease.
To determine also the critical pressure (pc) values, we have fitted the Clausius- Clapeyron equation [!53] to the p0 vs. T data at each composition:
T c p0 a
ln , (4)
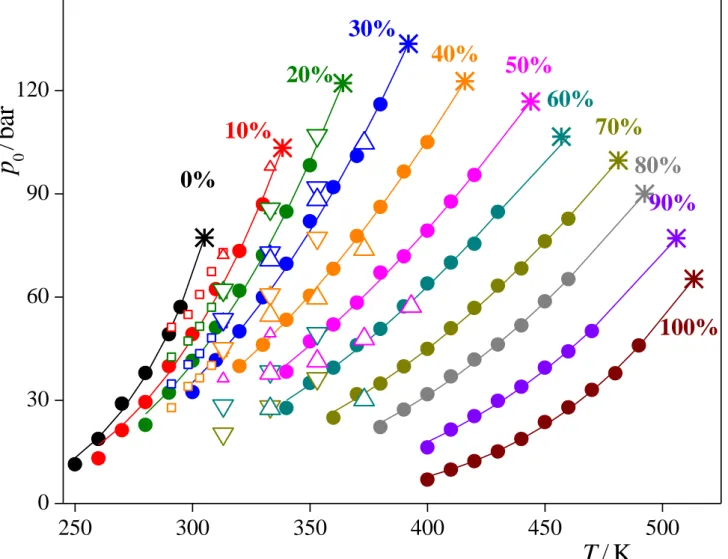
and extrapolated it to Tc. The estimated error bars of the saturated vapour pressure values are in the order of 0.5 bar. However, due to the fitting procedure, extrapolation, and the uncertainty of the critical temperature values themselves, the error bar of the critical pressure values is considerably larger, being still always below 3 bar. (Note that, since in the systems simulated the vapour and liquid phases are in equilibrium, the pressure of the system is, by definition, that of the saturated vapour, p0.) The simulated p0(T) data along with their Clausius-Clapeyron fits are shown in Figure 3, together with existing experimental data. As is seen, the simulation results agree with the experimental data within the deviation of different experimental data sets from each other. It is clearly seen that the critical pressure value goes through a maximum at xac = 0.3. Further, the slope of the p0(T) curves increases with xac at low, and clearly decreases at high acetone mole fractions.
It should be noted that although the parameter a of the Clausius-Clapeyron equation (eq. 4) usually contains the heat of vaporization [!53], here we do not attribute any physical meaning to this parameter, since it would assume that the heat of vaporization does not depend on the temperature, but this is not true at the vicinity of the critical point. To check the validity of the exponential fitting of the p0(T) data, we have also calculated the value of pc
using the generalized form of the Clausius-Clapeyron equation, being free from this assumption, as proposed by Velasco et al. [!54], using the lowest temperature data point for reference. The pc values obtained this way agree within error bars with those obtained through eq. 4.
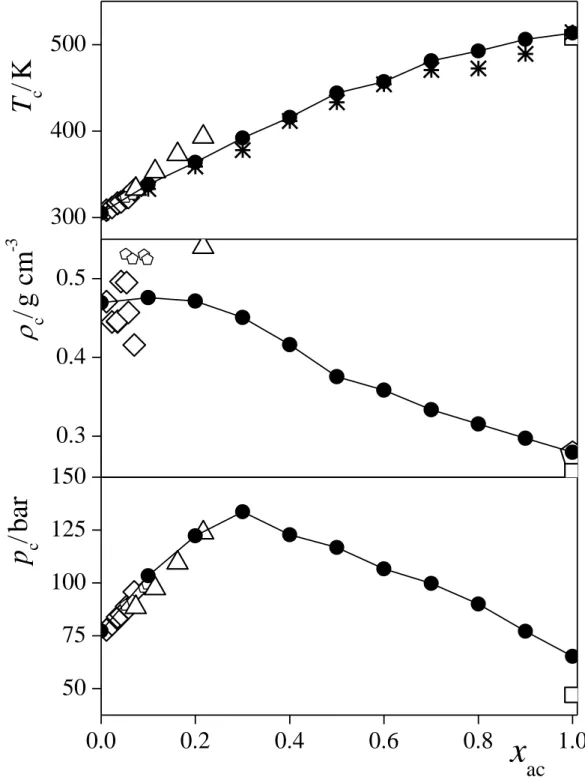
The composition dependence of the critical parameters is summarized in Table 3, and is presented in Figure 4, along with existing experimental data, available only for rather low acetone mole fractions (i.e., below about 0.2). As is seen, our results agree well with the experimental data in the very narrow range of their existence. Consistently with our above findings, while Tc exhibits a monotonous increase with xac in the entire composition range, pc
exhibits a maximum around the acetone mole fraction value of 0.3, and c might also go through a maximum in the low acetone mole fraction range of 0-0.2. It is also seen that the Tc(xac) curve intersects the temperature level of 313 K below the xac value of 0.1, hence, the anomalies we observed earlier at this temperature concerning the thermodynamics of mixing these compounds at xac = 0.05 [!29] can indeed be attributed to the critical fluctuations occurring in the system.
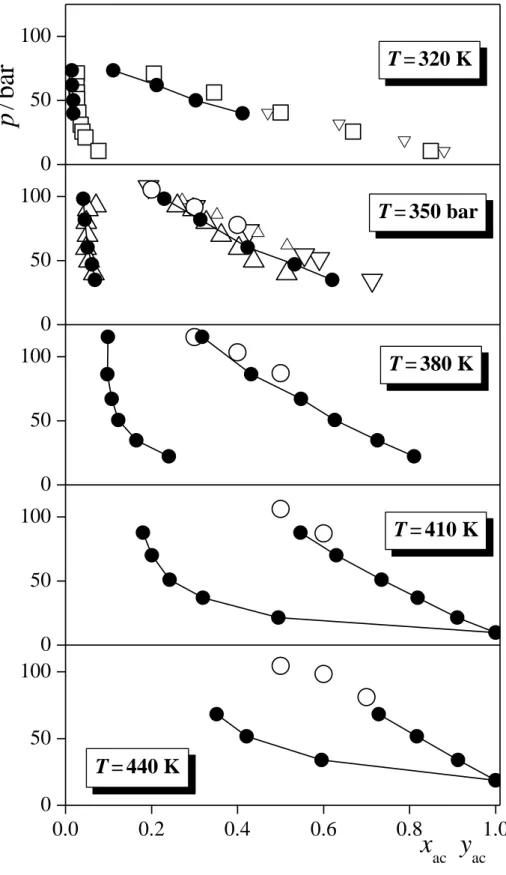
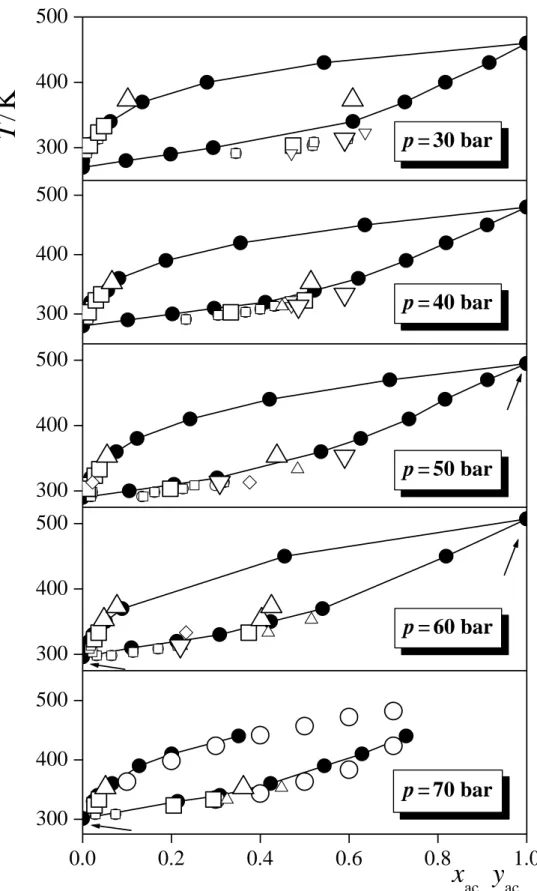
The composition dependence of the pressure in the liquid and vapour phases are shown in Figure 5 along five isotherms. Experimental data, obtained at 323 K [!10,14], 353 K [!15,16,24,25], 383 K [!16], 413 K [!16], and 443 K [!16] are also indicated. The simulated results agree quite well with the experimental curves; their difference certainly remains within the deviation of the results of various experiments from each other (se, e.g., data at 350 K). As is seen, at low acetone mole fractions, the p(xac) data get considerably steeper with decreasing temperature, as the critical point is approached. On the other hand, the p(xac) data are nearly linear in the liquid phase at each temperature. Finally, the temperature dependence of the coexisting compositions (i.e., bubble and dew point curves) is shown in Figure 6, as obtained at five different pressures (within ± 2.5 bar), again, along with existing experimental data, measured within the same pressure interval. These distillation loops, being largely independent from the pressure, agree well with the available experimental data, and show no sign of azeotropic composition in any case.
The value of the surface tension, , has been calculated through the pressure route, i.e., as the integral of the difference between the normal and tangential pressure components (pN
and pT, respectively) along the interface normal axis, X [!48]:
p p (X) dX 2
1
T
N . (5)
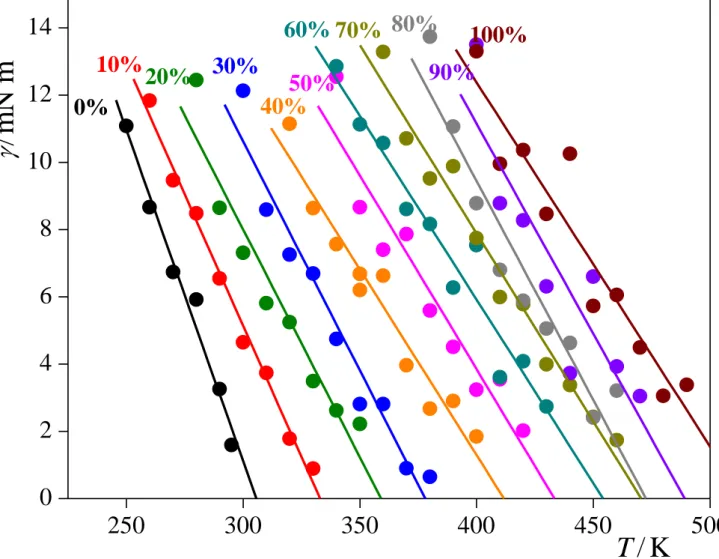
In this equation, the factor 2 in the denominator accounts for the presence of two liquid- vapour interfaces in the basic simulation box. The temperature dependence of the surface tension in the different systems simulated is shown in Figure 7. Although the obtained (T) data seem to be rather noisy, especially at high acetone mole fraction values, it should be noted that the error bar of the individual data points is typically just around 1.5 mN/m.
However, since the systems simulated are quite close to their critical point, the corresponding surface tension values are rather small in magnitude, which makes the data noisy even with such a small error bar. To check the reliability of the obtained (T) data, we have fitted a straight line to the simulated values at each composition (as shown also in Fig. 7), and extrapolated this fitted line to = 0. The temperature at which the surface tension becomes zero (i.e., the boundary between the liquid and vapour phases disappears) is the critical temperature itself. The Tc(xac) curve obtained this way, indicated also in Fig. 4, agrees very well with that obtained from the temperature dependence of the coexisting densities; the deviation of the Tc values calculated through different routes remains usually below 2%. This agreement between the critical temperature values obtained in different ways indicates that the straight lines fitted to the (T) data are quite robust, being rather insensitive to the noise of the individual data points, and hence gives us confidence in the accuracy of at least these fitted lines.
Finally, since on the canonical ensemble, the surface tension is, by definition, the excess Helmholtz free energy of a unit surface, its temperature derivative (i.e., the slope of the above fitted lines) is related to the excess surface entropy, Ssurf, as
A V
T N
S
, ,
surf
. (6)
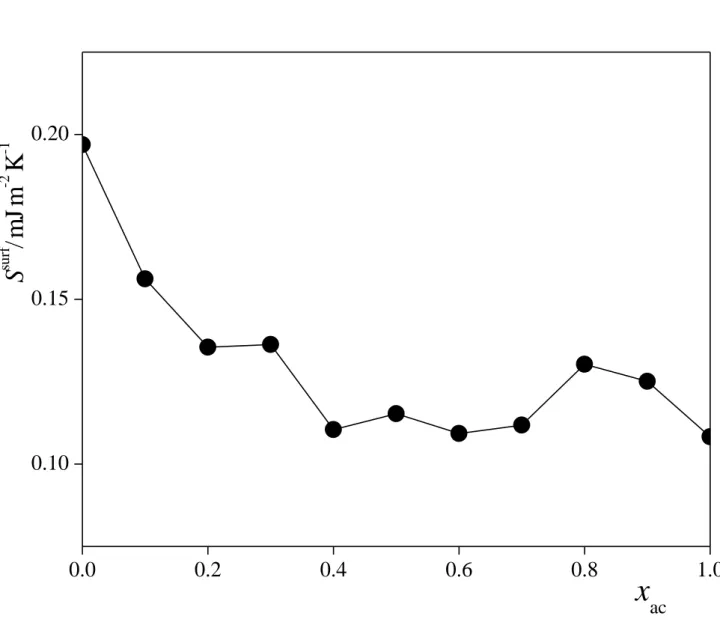
The composition dependence of the surface entropy of the acetone-CO2 mixtures is shown in Figure 8 as obtained from the above linear fits of the (T) data. As is clear, the value of Ssurf
decreases upon adding a small amount of acetone to CO2, but remains more or less constant above the acetone mole fraction value of about 0.2-0.3.
4. Summary and conclusions
In this paper the applicability of molecular modelling for the determination of the vapour-liquid equilibrium in CO2-acetone mixtures is validated by comparison with experimental data, which exist, unfortunately, only in rather narrow ranges of both the composition and temperature. Thus, the present results largely extend the range of thermodynamic conditions in which reliable information is provided for the vapour-liquid equilibrium of these mixtures. As a consequence, our data can also be used in the future to test the validity of existing equations of state in a largely extended range of thermodynamic conditions. Furthermore, the configurations resulting from these simulations can also be used to obtain a detailed, molecular level insight into the structure of the mixtures, in particular about the Lewis acid-Lewis base type interaction, which, up to now, has only been subject of speculations based on thermodynamic and kinetic data [!18]. Moreover, the structure and dynamics of the interfacial region can also be investigated in detail, aiming at information that is rather difficult or even impossible to be obtained either by experimental methods or from equations of states. Work in this direction is currently in progress.
Acknowledgements. The authors acknowledge financial support from the NKFIH Foundation, Hungary (project Nos. 119732 and 120075). Calculations have been performed on computers from the Mésocentre de Calcul, a Regional Computing Center at Université de Franche-Comté.
References
[1] P. G.Jessop, B. Subramaniam, Gas-expanded liquids, Chem. Rev. 107 (2007) 2666- 2694.
[2] T. Katayama, K. Ohgaki, G. Maekawa, M. Goto, T. Nagano, Isothermal vapor-liquid equilibria of acetone - carbon dioxide and methanol - carbon dioxide systems at high pressures, J. Chem. Eng. Jpn. 8 (1975) 89-92.
[3] P. Traub, K. Stephan, High-pressure phase equilibria of the system CO2-water-acetone measured with a new apparatus, Chem. Eng. Sci. 45 (1990) 751-758.
[4] C. Y. Day, C. J. Chang, C. Y. Chen, Phase equilibrium of ethanol + CO2 and acetone + CO2 at elevated pressures, J. Chem. Eng. Data 41 (1996) 839-843.
[5] C. J. Chang, C. Y. Day, C. M. Ko, K. L. Chiu, Densities and P-x-y diagrams for carbon dioxide dissolution in methanol, ethanol, and acetone mixtures, Fluid Phase Equilib. 131 (1997) 243-258.
[6] H. Pöhler, E. Kiran, Volumetric properties of carbon dioxide + acetone at high pressures, J. Chem. Eng. Data 42 (1997) 379-383.
[7] T. Adrian, G. Maurer, Solubility of carbon dioxide in acetone and propionic acid at temperatures between 298 K and 333 K, J. Chem. Eng. Data 42 (1997) 668-672.
[8] J. T. Reaves, A. T. Griffith, C. B. Roberts, Critical properties of dilute carbon dioxide + entrainer and ethane + entrainer mixtures, J. Chem. Eng. Data 43 (1998) 683-686.
[9] C. J. Chang, K. L. Chiu, C. Y. Day, A new apparatus for the determination of P-x-y diagrams and Henry’s constants in high pressure alcohols with critical carbon dioxide.
J. Supercrit. Fluids 12 (1998) 223-237.
[10] A. Bamberger, G. Maurer, High-pressure (vapour + liquid) equilibria in (carbon dioxide + acetone or 2-propanol) at temperatures from 293 K to 333 K, J. Chem.
Thermodyn. 32 (2000) 685-700.
[11] J. Chen, W. Wu, B. Han, L. Gao, T. Mu, Z. Liu, T. Jiang, J. Du, Phase behavior, densities, and isothermal compressibility of CO2 + pentane and CO2 + acetone systems in various phase regions, J. Chem. Eng. Data 48 (2003) 1544-1548.
[12] J. Wu, Q. Pan, G. L. Rempel, Pressure-density-temperature behavior of CO2/acetone, CO2/toluene, and CO2/monochlorobenzene mixtures in the near-critical region, J.
Chem. Eng. Data 49 (2004) 976-979.
[13] M. I. Cabaço, Y. Danten, T. Tassaing, S. Longelin, M. Besnard, Raman spectroscopy of CO2-acetone and CO2-ethanol complexes, Chem. Phys. Letters 413 (2005) 258-262.
[14] M. Stievano, N. Elvassore, High-pressure density and vapor-liquid equilibrium for the binary systems carbon dioxide - ethanol, carbon dioxide - acetone and carbon dioxide – dichloromethane, J. Supercrit. Fluids 33 (2005) 7-14.
[15] F. Han, Y. Xue, Y. Tian, X. Zhao, L. Chen, Vapor-Liquid Equilibria of the Carbon Dioxide + Acetone Sysytem at Pressures from (2.36 to 11.77) MPa and temperatures from (333.15 to 393.15) K. J. Chem. Eng. Data 50 (2005) 36-39.
[16] W. Wu, J. Ke, M. Poliakoff, Phase boundaries of CO2 + toluene, CO2 + acetone, and CO2 + ethanol at high temperatures and high pressures, J. Chem. Eng. Data 51 (2006) 1398-1403.
[17] Y. Houndonougbo, H. Jin, B. Rajagopalan, K. Wong, K. Kuczera, B. Subramaniam, B. Laird, Phase equilibria in carbon dioxide expanded solvents: Experiments and molecular simulations, J. Phys. Chem. B 110 (2006) 13195-13202.
[18] K. Liu, E. Kiran, Viscosity, density and excess volume of acetone + carbon dioxide mixtures at high pressures, Ind. Eng. Chem. Res. 46 (2007) 5453-5462.
[19] H. Y. Chiu, M. J. Lee, H. M. Lin, Vapor-liquid phase boundaries of binary mixtures of carbon dioxide with ethanol and acetone, J. Chem. Eng. Data 53 (2008) 2393-2402.
[20] J. L. Gohres, C. L. Kitchens, J. P. Hallett, A. V. Popov, R. Hernandez, C. L. Liotta, C.
A. Eckert, A spectroscopic and computational exploration of the cybotactic region of gas-expanded liquids: Methanol and acetone, J. Phys. Chem. B 112 (2008) 4666-4673.
[21] A. A. Novitsky, E. Pérez, W. Wu, J. Ke, M. Poliakoff, A new continuous method for performing rapid phase equilibrium measurements on binary mixtures containing CO2
or H2O at high pressures and temperatures, J. Chem. Eng. Data 54 (2009) 1580-1584.
[22] F. Zahran, C. Pando, J. A. R. Renuncio, A. Cabañas, Excess molar enthalpies of CO2
+ acetone at pressures from (9.00 to 18.00) MPa and temperatures from (313.15 to 333.15) K, J. Chem. Eng. Data 55 (2010) 3649-3654.
[23] T. Aida, T. Aizawa, M. Kanakubo, H. Nanjo, Dependence of volume expansion on alkyl chain length and the existence of branched methyl group of CO2-expanded ketone systems at 40 oC, J. Supercrit. Fluids 55 (2010) 71-76.
[24] Y. Sato, N. Hosaka, K. Yamamoto, H. Inomata, Compact apparatus for rapid measurement of high-pressure equilibria of carbon dioxide expanded liquids, Fluid Phase Equilib. 296 (2010) 25-29.
[25] C. M. Hsieh, J. Vrabec, Vapor-liquid equilibrium measurements of the binary mixtures CO2 + acetone and CO2 + pentanones, J. Supercrit. Fluids 100 (2015) 160- 166.
[26] S. D. Moon, B. K. Moon, Gibbs Ensemble Monte Carlo Simulation for Vapor-Liquid Equilibrium of Binary Mixtures CO2/C3H8, CO2/CH3OCH3, and CO2/CH3COCH3, Bull. Korean Chem. Soc. 21 (2000) 1133-1137.
[27] C. L. Shukla, J. P. Hallett, A. V. Popov, R. Hernandez, C. L. Liotta, C. A. Eckert, Molecular dynamics simulation of the cybotactic region in gas-expanded methanol-
carbon dioxide and acetone-carbon dioxide mixtures, J. Phys. Chem. B 110 (2006) 24101-24111.
[28] Y. Houndonougbo, K. Kuczera, B. Subramaniam, B. Laird, Prediction of phase equilibria and transport properties in carbon dioxide expanded solvents by molecular simulation, Mol. Simul. 33 (2007) 861-869.
[29] A. Idrissi, I. Vyalov, M. Kiselev, P. Jedlovszky, Assessment of the potential models of acetone/CO2 and ethanol/CO2 mixtures by computer simulation and thermodynamic integration in liquid and supercritical states, Phys. Chem. Chem. Phys. 13 (2011) 16272-16281.
[30] D. L. Gurina, M. L. Antipova, E. G. Odintsova, V. E. Petrenko, Selective solvation in cosolvent-modified supercritical carbon dioxide on the example of hydroxycinnamic acids. The role of cosolvent self-association, J. Supercrit. Fluids 139 (2018) 19-29.
[31] CRC Handbook of Physics and Chemistry, Vol. 97, W. M. Haines (Ed.), CRC Press, Boca Raton, 2016-17.
[32] U. K. Deiters, T. Kraska, High-pressure fluid phase equilibria, Vol. 2, in: E. Kiran (Ser. Ed.), Supercritical fluid science and technology, Elsevier, Amsterdam, 2012.
[33] O. Czakkel, E. Geissler, I. M. Szilágyi, E. Székely, K. László, Cu-doped resorcinol–
formaldehyde (RF) polymer and carbon aerogels, J. Coll. Interface Sci. 337 (2009) 513-552.
[34] O. Czakkel, B. Nagy, E. Geissler, K. László, In situ SAXS investigation of structural changes in soft resorcinol–formaldehyde polymer gels during CO2-drying, J.
Supercrit. Fluids 75 (2013) 112-119.
[35] M. P. Allen, D. J. Tildesley, Computer Simulation of Liquids, Clarendon Press, Oxford, 1987.
[36] J. M. Stubbs, J. J. Potoff, J. I. Siepmann, Transferable potentials for phase equilibria.
6. United-atom description for ethers, glycols, ketones, and aldehydes, J. Phys. Chem.
B 108 (2004) 17596-17605.
[37] J. J. Potoff, J. I. Siepmann, Vapor-liquid equilibria of mixtures containing alkanes, carbon dioxide, and nitrogen, Am. Inst. Chem. Eng. J. 47 (2004) 1676-1682.
[38] K. A. Kobe, H. R. Crawford, R. W. Stephenson, Critical properties and vapor pressures of some ketones, Ind. Eng. Chem. 47 (1955) 1767-1772.
[39] B. Hess, C. Kutzner, D. van der Spoel, E. Lindahl, GROMACS 4: Algorithms for highly efficient, load-balanced, and scalable molecular simulation, J. Chem. Theory Comput. 4 (2008) 435-447.
[40] M. G. Martin, J. I. Siepmann, Transferable potentials for phase equilibria. 1. United- atom description of n-alkanes, J. Phys. Chem. B 102 (1998) 2569-2577.
[41] E. Núñez-Rojas, J. A. Aguilar-Pineda, A. Pérez de la Luz, E. N. de Jesús González, J.
Alejandre, Force field benchmark of the TraPPE_UA for polar liquids: Density, heat of vaporization, dielectric constant, surface tension, volumetric expansion coefficient, and isothermal compressibility, J. Phys. Chem. B 122 (2018) 1669-1678.
[42] S. Nosé, A molecular dynamics method for simulations in the canonical ensemble, Mol. Phys. 52 (1984) 255-268.
[43] W. G. Hoover, Canonical dynamics: equilibrium phase-space distributions, Phys. Rev.
A 31 (1985) 1695-1697.
[44] B. Hess, P-LINCS: A parallel linear constraint solver for molecular simulation, J.
Chem. Theory Comput. 4 (2008) 116-122.
[45] U. Essman, L. Perera, M. L. Berkowitz, T. Darden, H. Lee, L. G. Pedersen, A smooth particle mesh Ewald method, J. Chem. Phys. 103 (1995) 8577-8594.
[46] P. J. in’t Veld, A. E. Ismail, G. S. Grest, Application of Ewald summations to long–
range dispersion forces, J. Chem. Phys. 127 (2007) 144711-1-8.
[47] F. Goujon, P. Malfreyt, J. M. Simon, A. Boutin, B. Rousseau, A. H. Fuchs, Monte Carlo versus molecular dynamics simulations in heterogeneous systems: An application to the n-pentane liquid-vapor interface, J. Chem. Phys. 121 (2004) 12559- 12571.
[48] J. S. Rowlinson, F. L. Swinton, Liquids and Liquid Mixures, 3rd ed.; Butterworth, London, 1982, pp.70-75.
[49] F. J. Wegner, Corrections to scaling laws, Phys. Rev. B 5 (1972) 4529-4536.
[50] M. Ley-Koo, M. S. Green, Consequences of the renormalization group for the thermodynamics of fluids near the critical point, Phys. Rev. A 23 (1981) 2650-2659.
[51] C. Vega, J. L. F. Abascal, I. Nezbeda, Vapor-liquid equilibria from the triple point up to the critical point for a new generation of TIP4P-like models: TIP4P/Ew, TIP4P/2005, and TIP4P/ice, J. Chem. Phys. 125 (2006) 034503-1-9.
[52] J. S. Rowlinson, B. Widom, Molecular Theory of Capillarity, Dover Publications, Mineola, 2002, p. 265.
[53] P. W. Atkins, Physical Chemistry, 4th ed., W. H. Freeman & Co., New York, 1990, Chapter 6.
[54] S. Velasco, F. L. Román, J. A. White, On the Clausius-Clapeyron Vapor Pressure
Tables
Table 1.
Critical parameters of neat CO2 and acetone as obtained from previous experiments and our simulations
system reference Tc/K c/g cm-3 pc/bar
[!10] 304.2 0.4311 73.9
CO2 this work 305.1 0.472 77.3
[!10] 508.1 0.2557 47.0
acetone [!31] 508.1 0.2624 47.0
[!38] 0.278
this work 513.4 0.282 65.3
Table 2.
Interaction parameters of the potential models used (, and q stand for the Lennard-Jones distance and energy parameter and fractional charge of the given site, respectively).
molecule interaction site /Å /kJ mol-1 q/e
acetone
CH3 3.790 0.8144 0
C 3.820 0.3324 0.424
O 3.05 0.6565 -0.424
CO2
C 2.800 0.2244 0.70
O 3.050 0.6566 -0.35
Table 3.
Critical parameters of the systems of different compositions, as obtained from our simulations.
xac Tc/K c/g cm-3 pc/bar
0 305 0.472 77
0.1 338 0.476 103
0.2 364 0.472 122
0.3 392 0.451 134
0.4 416 0.416 123
0.5 444 0.376 117
0.6 457 0.358 107
0.7 481 0.334 100
0.8 492 0.315 90
0.9 506 0.297 77
1.0 513 0.282 65
Figure legends
Fig. 1. Mass density profile of the systems containing 10 mole % (top panel), 50 mole % (middle panel), and 90 mole % (bottom panel) acetone along the macroscopic surface normal axis, X, as obtained from our simulations at selected temperatures (full symbols), along with their fits according to eq. 1 (solid curves).
Fig. 2. Coexisting liquid and vapour phase densities of the systems simulated at various temperatures (full circles), along with their fits according to eqs. 2 and 3 (solid curves). Error bars are below 5 10-4 g/cm3. The critical points obtained from these fits are also shown (asterisks). The data corresponding to the overall acetone mole percentages of 10%, 20%, 30%, 40%, 50%, 60%, 70%, 80%, 90%, and 100% are shifted up by 50, 100, 150, 200, 250, 300, 350, 400, 450, and 500 K, respectively, for clarity.
Fig. 3. Temperature dependence of the pressure of the saturated vapour in the systems of different overall acetone mole percentages considered (full circles), along with their Clausius- Clapeyron fits (eq. 4, solid curves). Error bars are in the order of 0.5 bar (smaller than the symbols). The critical points obtained from these fits are also shown (asterisks). Open symbols correspond to experimental data; small squares: ref. [!9], small up triangles: ref.
[!25], large up triangles: ref. [!15], large down triangles: ref. [!24].
Fig. 4. Composition dependence of the critical temperature (top panel), critical density (middle panel), and critical pressure (bottom panel), as obtained from the simulations (full circles). Estimated error bars are in the order of 5 K, 0.005 g/cm3, and 3 bar, respectively. The lines connecting the points are just guides to the eye. The critical temperature values estimated from the temperature dependence of the surface tension data are also shown (asterisks). Open symbols correspond to experimental data; small pentagons: ref. [!11], large diamonds: ref. [!8], large up triangles: ref. [!15], large squares: ref. [!10], large pentagons: ref.
[!38].
Fig. 5. Coexisting liquid and vapour phase compositions at various pressures along the 320 K (top panel), 350 K (second panel), 380 K (third panel), 410 K (fourth panel), and 440 K (bottom panel) isotherms, as obtained from the simulations (full circles). Error bars are smaller than the symbols. The lines connecting the points are just guides to the eye. Open symbols correspond to experimental data; large circles: ref. [!16], large squares: ref. [!10], small up triangles: ref. [!25], large up triangles: ref. [!15], small down triangles: ref. [!14], large down triangles: ref. [!24], all measured 3 K above the corresponding simulation temperature.
Fig. 6. Coexisting liquid and vapour phase compositions at various temperatures (distillation diagrams) at the pressures 30 ± 2.5 bar (top panel), 40 ± 2.5 bar (second panel), 50 ± 2.5 bar (third panel), 60 ± 2.5 bar (fourth panel), and 70 ± 2.5 bar (bottom panel), as obtained from the simulations (full circles). Error bars are smaller than the symbols. The lines connecting the points are just guides to the eye. Arrows mark the points that have been obtained by extrapolation along the Clausius-Clapeyron curve (eq. 4, Fig. 3) rather than directly from the simulations. Open symbols correspond to experimental data; small circles: ref. [!5], large circles: ref. [!16], small squares: ref. [!9], large squares: ref. [!10], small up triangles: ref.
[!25], large up triangles: ref. [!15], small down triangles: ref. [!14], large down triangles: ref.
[!24], small diamonds: ref. [!3].
Fig. 7. Temperature dependence of the surface tension in the systems of different acetone mole percentages considered (full circles), along with the straight lines fitted to these data (solid curves). Error bars are in the order of 1.5 mN/m. Extrapolation of these lines to zero surface tension provides an alternative estimation of the critical temperature.
Fig. 8. Composition dependence of the surface entropy of the systems simulated, as estimated from the slope of the straight lines fitted to the surface tension vs. temperature data (symbols).
The line connecting the points is just a guide to the eye.
Figure 1 Fábián et al.
0.0 0.2 0.4 0.6 0.8 1.0
0.0 0.2 0.4 0.6 0.8 1.0
0 50 100 150 200
0.0 0.2 0.4 0.6 0.8 1.0
90% acetone 50% acetone
10%
acetone
T = 400 K T = 420 K T = 440 K T = 460 K T = 340 K T = 360 K T = 380 K T = 400 K
/ g cm
-3T = 260 K
T = 280 K T = 300 K T = 320 K
X / Å
Figure 2 Fábián et al.
0.0 0.2 0.4 0.6 0.8 1.0
300 400 500 600 700 800 900 1000
100%
90%
60%
70%
80%
50%
40%
30%
20%
10%
0%
T / K
/g cm
-3Figure 3 Fábián et al.
250 300 350 400 450 500
0 30 60 90 120 150
10%
100%
90%
80%
70%
60%
40% 50%
30%
20%
p / b ar
00%
T / K
Figure 4 Fábián et al.
300 400 500
0.0 0.2 0.4 0.6 0.8 1.0
50 75 100 125 150 0.3 0.4 0.5
c/ g
cm
-3p
c/ b ar
x ac
T
c/ K
Figure 5 Fábián et al.
0.0 0.2 0.4 0.6 0.8 1.0
0 50 100 0 50 100 0 50 100 0 50 100 0 50 100
T = 440 K
p / b ar
x
acy
ac
T = 410 K T = 380 K T = 350 bar
T = 320 K
Figure 6 Fábián et al.
0.0 0.2 0.4 0.6 0.8 1.0
300 400 500 300 400 500 300 400 500 300 400 500 300 400 500
p = 70 bar
T / K
x
acy
acp = 60 bar
p = 50 bar
p = 40 bar
p = 30 bar
Figure 7 Fábián et al.
250 300 350 400 450 500
0 2 4 6 8 10 12 14
90%
70% 80% 100%
60%
50%
40%
20% 30%
10%
0%
/ m N m
-1T / K
Figure 8 Fábián et al.