Transversal folding in Himalaya foothill ranges In memory of Frank H
ORVÁTHCSONTOS, László1, DUNKL, István2, VAKARCS, Gábor3, ABBASI, Abid H.3
1MOL Nyrt, lcsontos@mol.hu; orcid: 0000-0002-0723-4673
2Sedimentology and Environmental Geology, Geozentrum, University of Göttingen; istvan.dunkl@geo.uni-goettingen.de
3MOL Pakistan, gabor.vakarcs@molpakistan.com; abid.abbasi@molpakistan.com
Harántirányú redők a Himalája előhegyeiben
Összefoglalás
Az észak-pakisztáni Himalája Fő frontális feltolódási (MFT) és Fő határfeltolódási (MBT) zónája több szintaxist (beöblösödést) tartalmaz. Ezek mentén az általános K–Ny-i csapású feltolódásokat nagyjából É–D-i csapású szakaszok kötik össze, amelyeket a közvélekedés eltolódásos jellegű oldalsó rámpáknak tart. E feltolódási zónák mentén két területet: a Kalabagh város környékit és az Islamabadtól keletre–délkeletre fekvőt mutatjuk be, amelyek szerkezeti elemzése ezt a vélekedést megkérdőjelezi. Az itt bemutatott szeizmikus szelvények alapján a javasolt oldalsó rámpák nem észlelhetők, ellenben É–D-i tengelyű redőket és keleti vagy nyugati vergenciájú feltolódásokat térképezhetünk, melyek érintik a paleo-mezozoos kőzeteket és az oligo-mio-pliocén molasszt is.
A Surghar-hegység ÉK-i sarkát egymást váltó pikkelyek alkotják, amelyeknek kiemelkedő kambriumi–eocén magja van a kissé lenyesett miocén molassz alatt. Ezek az egymást váltó szerkezetek egy széles zónában dél felé legör - bül nek. Ebben a zónában kulisszaszerű transzpressziós Riedelek, kulisszaszerű redők és délre görbülő korábbi feltoló - dások találhatók. Az összes ilyen szerkezet egy széles képlékeny jobbos nyírási zónaként értelmezhető, mely defor - málja a korábban kialakult É–D-i tengelyű redőket és keleti vergenciájú feltolódásokat is (de a korábban javasolt Kalabagh eltolódás nem térképezhető).
A Hazara szintaxist nagy antiformként értelmezzük, amely meghajlította az MBT és Panjal feltolódásokat egy oligo-miocén molasszmag körül, mely maga is antiformot képez (BOSSARTet al. 1988). Modellünkben a nyugati ver - gen ciájú Balakot feltolódás és más, mélyebb vak feltolódások vannak ezen antiform magjában. A szintaxis déli folytatásában a miocénben tapasztalható redők folyamatosan nyomozhatók a Kelet-Potwar régiótól Nyugat-Kasmirig;
ezekben a szerkezetekben nem tapasztalható nagyobb törés. E szerkezetek szintén újrahajlítódtak, hogy egy nagy - szabású, É–D-i tengelyű antiformot alkossanak. A tágabb terület térképelemzése azt sugallja, hogy É–D-i tengelyű redők bőséggel találhatók az észak-indiai szegélyen.
Több független adat szól a harántirányú redők létezése mellett: földtani térképek (és űrfotók) elemzése; korábban mért paleomágneses deklináció-irányok, a deformációs ellipiszoidok tengelyirányainak szórása mind azt sugallják, hogy az eredeti szerkezetek nagyjából lineáris elrendeződésűek voltak, és később gyűrődtek meg regionális redőkbe, amelyek esetenként a beöblösödő szakaszokat magyarázzák. Ha a korábbi nagy feltolódások lineárisabbak voltak, az ezeken tapasztalható váltó szerkezetek az MBT esetében balos, az MFT esetében hol balos, hol jobbos nyírási kom - ponenst jeleznek a nagyméretű feltolódás mellett.
Korábbi (ZEITLER 1985) és most közölt alacsony hőmérsékletű termokronológiai korok egy általános K–Ny-i rövidülési eseményt körvonalaznak 4–5 Ma között az egész észak-indiai szegélyre. Valószínű azonban, hogy a harántirányú redők, dómok keletkezése már az oligocén folyamán megindult (DIPIETROet al. 2008). Az is világos, hogy a hosszabb É–D-i rövidülési időszakokat csak röviden szakították meg K–Ny-i epizódok.
Több lehetséges magyarázat van a K–Ny-i rövidüléses szerkezetek kialakulására egy általános É–D-i rövidülési rezsimben. Egyik szerint az egymást meredeken metsző törések elvégződése egy adott zónában (TREOLARet al. 1992) ellentétes forgásokat generál. Egy másik lehetőség a kulisszás redőződés egy nagy K–Ny-i jobbos vető mentén, szélesebb eltolódási zónában. Valószínűbb azonban, hogy a haránt irányú redőződés az egész indiai lemezt érintette, ezért a legkézenfekvőbb magyarázatot analóg modellek sugallják (REPLUMAZet al. 2012). Ezek szerint az észak felé haladó Indiai-táblát oldalról egymás felé konvergáló litoszférahatárok szegélyezik. Az észak felé haladáskor a szegélyek mentén kelet–nyugati rövidülés ébred és azokkal párhuzamosan ilyen irányú feltolódások, hegyláncok keletkeznek.
Tárgyszavak: Himalája előhegyei; szerkezeti elemzés, oldalsó rámpák, harántirányú redők, kiemelkedés-történet
Motto: Frank’s favourite joke: “An Earth scientist is falling off from the 100th floor of a skyscraper. At the third floor he says: “So far, so good”. All his observations were right. But the predictive power…”
DOI: 10.23928/foldt.kozl.2019.149.3.255
Preamble
Frank HORVÁTHwas an inspirational person, active at a perfect time for his profession. He lived the best time of Plate tectonics, at least in Hungary, where he actively con trib uted at the paradigm change. He also worked out and gave a lot of ideas about the tectonics and geophysical structure of the Pannonian Basin, his beloved hunting ground. However, he never stopped at borders, freely swinging between the different Mediterranean chains and between different topics such as palaeomagnetics, lithospheric structure, thermal evo lu tion of the lithosphere or the link between intraplate stresses and topographic features. He has always considered geology-geo - physics as an integral science, without subdivi sions and he always taught us to apply different branches of this vast king - dom (at least on an educated interpretational level). He always pushed his followers to have correct obser vations, but also to question the status quo and try to come up with surprising new models better explaining the obser vations. The topic of the paper was chosen to reflect his multidisciplinary approach in a plate-tectonic context. It also tries to challenge some inter - pretations that appear quite straightforward at a first ap- proach.
Introduction
The Himalayan chain has two major syntaxes at both eastern and western ends (Figure 1insert): the Namche Barwa and Nanga Parbat syntaxes sensu lato (e.g. WADIA 1931, GANSSER1964, BURG& PODLADCHIKOV1999; BAJOLETet al.
2013). These regions have always attracted attention. How ever, there are more syntaxes and re-entrants in smaller dimen sions especially in the western major syntaxis area. These syntaxes bend around several main fault zones that run along parts or the entire Himalaya (TREOLARet al. 1992).
The present paper deals with the NE Himalayan syntaxis area in Pakistan (Figure 1), however, its aim is not to explain the greater syntaxis (see e.g. BAJOLETet al. 2013; REPLUMAZ et al. 2012), but to give new data on some of the smaller syntaxes–re-entrants in the south. The Surghar and (greater) Hazara syntaxes will be examined in more detail (Figure 1).
These data indicate the presence of transversal folding, i.e.
folds of N–S, rather than E–W axial traces. The idea of E–W shortening and buckling of several structural units is not new; in fact early authors explained the major syntaxial areas by buckling (WADIA1931, GANSSER1964, TREOLARet al. 1992). Numerical modelling has also shown that buck - Abstract
The Himalayan foreland in N Pakistan, dissected by Main Frontal Thrust (MFT) and Main Boundary Thrust (MBT) contains spectacular salients and syntaxes. The lateral (N–S) boundaries between these salients and syntaxes around Kalabagh city and east–south-east of Islamabad were believed to host deep-seated lateral ramps with strike slip movements.
However, seismic data in these two sectors suggest that there are N–S trending folds and locally east- or west-vergent thrusts that affect the Palaeozoic–Palaeogene cover of the Indian shield, as well as the Miocene–Pliocene molasse sediments. The proposed lateral ramps cannot be followed on the seismic and nor on maps; instead, both maps and seismic data suggest folding, often on a regional scale of harder Palaeo–Mesozoic–Palaeogene and softer Oligo–Miocene–Pilo-Pleistocene cover.
The NE corner of Surghar Range is proposed to be formed of relaying thrust sheets with emergent heads composed of Palaeozoic–Palaeogene and its slightly detached Miocene molasse cover. These relaying imbricates are taken in a southward flexure generated by a major right lateral shear of a wide zone, where transpressive Riedel shears, en echelon anticlines and southwards flexed earlier thrust faults are the main elements (but a single, through-going Kalabagh fault is missing). The generation of mapped N–S trending folds and east-vergent thrusts preceded the formation of the wide shear zone and southwards flexing.
Hazara syntaxis is interpreted as a major antiform that re-folded MBT and Panjal thrust around Oligo-Miocene molasse, itself forming an antiform (BOSSARTet al. 1988). In our model we propose that the west-vergent Balakot thrust and deeper blind thrusts are in the core of this antiform. In the southern continuation we propose that folds in Miocene molasse continue from eastern Potwar region to western Kashmir and there appears no major break. These structures are also re-folded in a major antiform with N–S axial trend. Map analysis also suggests that N–S trending folds bending earlier main thrusts are occurring in a wide area south of the Indus–Tsangpo suture.
Several independent geological and geophysical observations including mapping, seismic analysis, earlier measurements of strain axes and of palaeomagnetic declinations suggest that the salients and syntaxes may have been much more linear in the past (although a total linearity is not realistic). It is proposed that the present-day undulating pattern may have been generated by N–S trending folds due to general (and episodic) E–W shortening. If the main fault zones were more linear, the relay pattern along their segments suggests a left lateral shear component along MBT and a mixed, locally left, locally right lateral component along MFT.
Earlier (ZEITLER1985) and now provided low temperature thermochronological ages strongly suggest a rather general episode of E–W shortening between 4–5 Ma for the whole northern Indian margin. However, there should have been original transversal dome formation as early as Oligocene (DIPIETROet al. 2008). It is also clear that longer N–S shortening and shorter E–W shortening episodes should alternate eventually in a very short time frame, since earthquake focal mechanisms (LISA&
KHWAJA2004, BURGet al. 2005) suggest the coexistence of E–W compression and NW–SE compression in Potwar.
There are several potential explanations for generating E–W shortening and related structures in a general N–S shortening regime. Possibilities range from fault terminations of thrust faults at high angles in a particular zone (TREOLARet al. 1992) to en echelon folding along a major right lateral E–W fault zone. However, we speculate that E–W shortening could be much more general, suggesting a mechanism that affects the whole of Indian plate. Possibly the best explanation is given by analogue models (REPLUMAZet al. 2012) proposing major, slightly convergent confining boundaries. If applied to the northwards advance of India, the northwards converging boundaries generate secondary E–W shortening and east-or west- vergent orogens parallel to these boundaries.
Keywords: Himalayan foothills; structural analysis; lateral ramps; transverse folding, uplift history
ling on a lithospheric scale is possible and probable (BURG
& PODLADCHIKOV 1999). However, mapping in the study area (GEE1980) suggested long, deep-rooted lateral ramps (MARSHAK2004) that link more linear E–W segments of major thrusts (Figure 2;dotted faults; e.g. MCDOUGALL&
KHAN1990, AHMADet al. 2010). These are best exemplified by generally accepted maps such as KAZMI& RANA(1982) or NIZAMUDDIN(1997), CRAIGet al. (2018, their Figure 7).
The proposed Kalabagh and Jhelum faults of ca N–S trend merit special attention and are in the focus of this paper (Figure 2). It will be shown that these structures do not exist as they are imagined and shown on maps. In contrast, instead of these faults, folds are observed with N–S axial trends.
Several competing hypotheses will be discussed to explain the possible reasons of E–W shortening during the obvious N–S shortening of Himalayan orogeny.
Methods
We intend to analyse two sectors: the NE corner of Surghar Range (Figure 2) where Kalabagh Fault was pro - posed and the eastern part of Potwar Plateau, where the
through-going Jhelum Fault was proposed (Figure 2). We analyse maps and selected seismic lines in these key areas.
Additionally, a set of different structural data are collected from literature (BOSSARTet al. 1988, BURGet al. 2005) that suggest the existence of N–S axial trend folds and E–W short en ing. Results of our low temperature thermo chrono - logic study (apatite fission track and [U–Th]/He) in the Pot - war Plateau are also given to offer some timing constraints for the deformation.
Regional geological framework
Himalaya is structurally dissected into several major units.
The limiting shear zones run along the entire chain. There are reportedly two suture zones: the Shyok and Indus su tu res (the latter also named Main Mantle Thrust) that separate Eurasian, Kohistan island arc and Indian origin rocks (TREOLARet al.
1992). South of the Main Mantle Thrust (MMT; Figure 2) we can find different parts of the Indian conti nent that is subthrust beneath the northern island arcs, microcontinents and finally the Eurasian plate (e.g. MATTAUER1983).
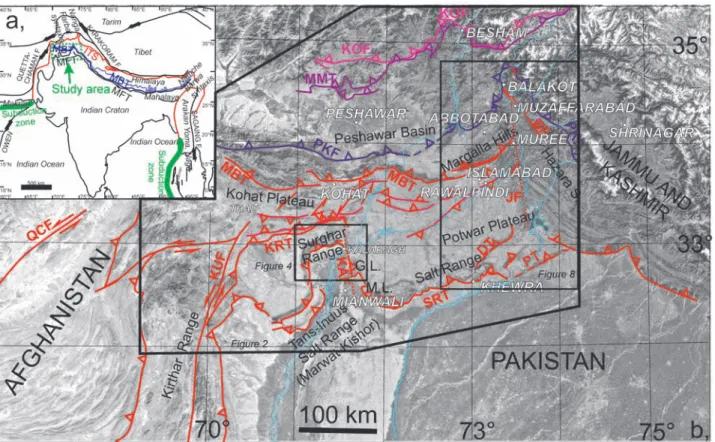
Figure 1.Location map. a) Main structures of the Himalayan region, after BAJOLETet al. (2013), modified. ITS = Indus–Tsangpo Suture; MBT = Main Boundary Thrust, MFT = Main Frontal thrust. b) Satellite image of the study area. Courtesy of Google Earth. Three later figures marked by boxes. G.L. = Gundi Lobe, M.L.
= Mussa Khel Lobe, QCF = Quetta-Chaman Fault, KOF = Kohistan Fault, MMT = Main Mantle Thrust, PKF = Panjal–Khairabad Fault, MF = Murree Fault, BF = Balakot Fault; MBT = Main Boundary Thrust, KMF = Khari Murat Fault, KUF = Kurram Fault, KRF = Karak Fault, SRT = Salt Range Thrust, DT = Domeli Thrust, PT = Pabbi Thrust. Stippled fault traces: supposed structures: KAF = Kalabagh Fault, JF = Jheelum Fault
1. ábra.A cikkben tárgyalt terület. a) a Himalája régió főbb szerkezetei, BAJOLETet al. (2013) alapján, módosítva. ITS = Indus–Tsangpo Suture, MBT = Main Boundary Thrust, MFT = Main Frontal Thrust. b) A tágabb terület műholdfotója. Köszönet a Google Earth-nek. A később bemutatott ábrákat keretek jelölik. G.L. = Gundi lebeny, M.L. = Mussa Khel lebeny. QCF = Quetta-Chaman Fault, KOF = Kohistan Fault, MMT = Main Mantle Thrust, PKF = Panjal-Khairabad Fault, MF = Murree Fault, BF = Balakot Fault, MBT = Main Boundary Thrust, KMF = Khari Murat Fault, KUF = Kurram Fault, KRF = Karak Fault, SRT = Salt Range Thrust, DT = Domeli Thrust, PT = Pabbi Thrust. Szaggatott vonallal a feltételezett törések: KAF = Kalabagh Fault, JF = Jheelum Fault
In Pakistan, the most important boundaries are the following (Figure 2). The Indus–Tsangpo (MMT) suture indicates the suture zone of the Indian continent-origin rocks and the Kohistan Island arc (TREOLARet al. 1992); however, a northern Kohistan Fault was also separated as an important younger boundary (DIPIETROet al. 2008). The Panjal–Khai - rabad (or Tarbela) thrust separates a series of northern thrust sheets, composed of older and younger Precambrian crystal - line basement, Cambrian granitic intrusion; erosional remains of a Palaeozoic sedimentary sequence; Permian alkali magmatites (both intrusive and effusive) and an older
Mesozoic assemblage related to rifting (Figure 2). These rocks all suffered varying degrees of metamorphism, from low grade in the south to high grade in the north (TREOLARet al. 1992), whereas south of the Panjal thrust rocks are non- to anchimetamorphic (BOSSARTet al. 1988). In maps east of Abbotabad, Panjal thrust continues in the north of the Hazara syntaxis above the ‘Panjal imbricates’ of BOSSART et al.
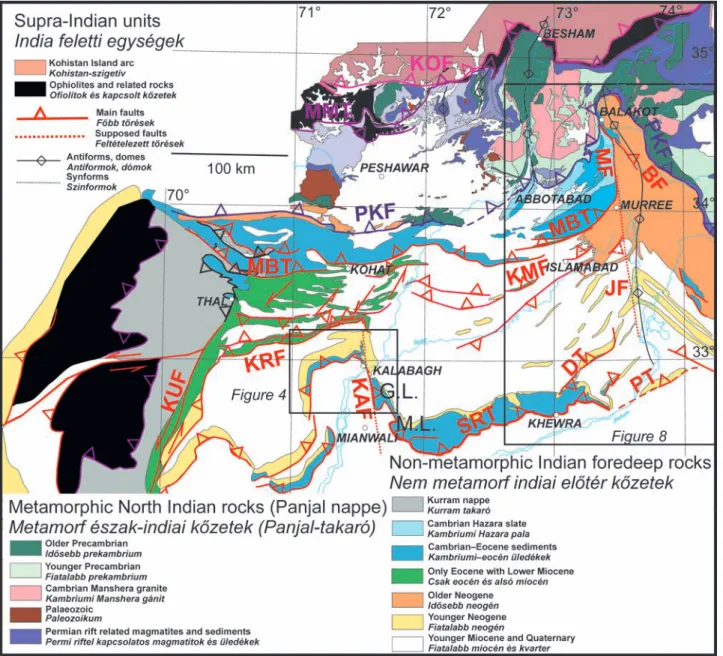
(1988), TREOLARet al. (1992). Further south of the meta - morphic Precambrian–Mesozoic succession comes a unit bordered on the south by the Main Boundary Thrust (Figure 2, MBT; TREOLARet al. 1992, BURGet al. 2005). This fault Figure 2. Simplified geologic map of the study area. Constructed after: CALKINS& OFFIELD(1974), GEE(1980), DIPIETROet al. (2008), GHAZIet al. (2014), JADOON
et al. (2015), GHANIet al. (2018). Kalabagh and Jhelum faults traced after KAZMI& RANA(1982). Later figures marked by boxes. G.L. = Gundi Lobe, M.L. = Mussa Khel Lobe. KOF = Kohistan Fault, MMT = Main Mantle Thrust, PKF = Panjal-Khairabad Fault, MF = Murree Fault, BF = Balakot Fault, MBT = Main Boundary Thrust, KMF = Khari Murat Fault, KUF = Kurram Fault, KRF = Karak Fault, SRT = Salt Range Thrust, DT = Domeli Thrust, PT = Pabbi Thrust. Stippled fault traces: supposed structures: KAF = Kalabagh Fault, JF = Jheelum Fault
2. ábra.A terület egyszerűsített földtani térképe, CALKINS& OFFIELD(1974), GEE(1980), DIPIETROet al. (2008), GHAZIet al. (2014), JADOONet al. (2015), GHANIet al. (2018) nyomán szerkesztve. A Kalabagh és Jhelum töréseket KAZMI& RANA(1982) nyomán rajzoltuk. G.L. = Gundi lebeny, M.L. = Mussa Khel lebeny. KOF = Kohistan Fault, MMT = Main Mantle Thrust, PKF = Panjal–Khairabad Fault, MF = Murree Fault, BF = Balakot Fault, MBT = Main Boundary Thrust, KMF = Khari Murat Fault, KUF = Kurram Fault, KRF = Karak Fault, SRT = Salt Range Thrust, DT = Domeli Thrust, PT = Pabbi Thrust. Stippled fault traces: supposed structures: KAF = Kalabagh Fault, JF = Jheelum Fault
runs mostly along a sharp topographic boundary, opposing non-metamorphic Meso zoic–Palaeogene rocks in hilly terrain to mostly Mio–Plio cene molasse sediments in the southern lowlands, plateaus. However, there is no major difference in the subsurface strati graphic composition of the southern lowlands and the northern hilly part, on either side of MBT. In other words, MBT is rather a sharp topographic boundary, just one of the many thrust faults that affect the non-metamorphic region. In the east, at the Margala Hills (Figure 1) the northern unit is composed of stacked imbri - cates and is thrust over the North Potwar Deformed Zone (NPDZ), yet another thrust imbricate zone (TREOLARet al.
1992, JASWALet al. 1997, JADOONet al. 1997). In this region, the amount of overthrust along MBT can be quite significant (see TREOLARet al. 1992 and later). In the west (Figure 2) the mainly Mesozoic rocks above MBT are thrust over the Kohat Plateau, where mostly Eocene rocks with their Miocene molasse cover are exposed (VESTRUMet al. 2011). However, the Mesozoic is preserved beneath the Palaeogene. In the westernmost part a nappe, Kurram unit, is found above the Mesozoic–Palaeogene (Figures 2, 3). This is composed of deep marine, mostly turbiditic sediments.
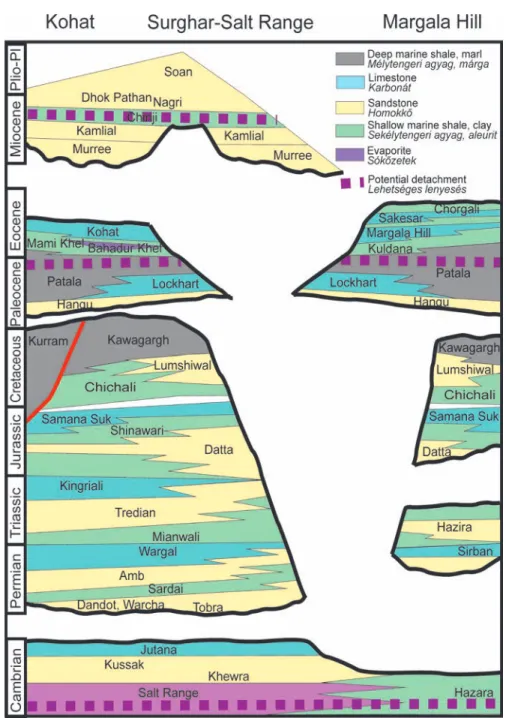
Even further south the Main Frontal Thrust (MFT) indicates a zone of southernmost thrusts which put Late Figure 3. Stratigraphic chart of the Pakistani Himalaya foothills area. Modified after GRÉLAUDet al. 2002, BURG
et al. 2005, GHANIet al. 2018
3. ábra. A pakisztáni Himalája előtér rétegtani táblája. GRÉLAUDet al. 2002, BURGet al. 2005, GHANIet al. 2018 nyomán, módosítva
Precambrian–Eocene sediments against their southern Plio- Pleistocene foredeep (Figure 2; YEATSet al. 1984, GRÉLAUD et al. 2002, GHANIet al. 2018). A continuous mountain chain (Figure 1) composed of the Trans-Indus Salt Range, the Sur - ghar Range and the Salt Range mark the southernmost edge of large thrusts. The Kohat and Potwar Plateaus provide the hinterland to this mountain chain and travel on their back towards the south. The trace of MFT is curvilinear, forming several syntaxes. The fault can be followed from the Kirthar Range until the eastern termination east of Khewra (Figure 1). The southernmost foreland seems only slightly de - formed and covered by very young (Pleistocene) sediments (YEATSet al. 1984, MEIGSet al. 1995, QAYYUMet al. 2015).
General stratigraphy
South of the Panjal–Khairabad Thrust the stratigraphy of the Indian shield is rather uniform (GEE1980). The first sediments on crystalline basement are a Late Proterozoic–
earliest Cambrian rock salt formation (Salt Range forma - tion; Figure 3) hosting one of the earth’s oldest salt mines at Khewra and at the origin of the worldwide sold ‘Himalayan salt’. This ductile rock is found at the basis of the southern - most thrusts of the Salt Ranges and provides a perfect detachment zone in the Potwar Plateau as well. It might be present in other parts (e.g. beneath the Surghar Range and Kohat Plateau) but not proven yet. The salt formation is overlain by a sequence of Cambrian continental–shallow marine formations including sandstones and dolostones.
The Cambrian formations can be 500–100 m thick (thick - ness being modified by salt tectonics; GHAZIet al. 2014).
After a long break in sedimentation and an uncon - formity, Permian glacial sandstones, tillites and conglo - merates, then carbonates are deposited, to be followed by an apparently concordant sequence of Triassic–Jurassic–Cre - ta ceous rocks (GHAZIet al. 2014). The individual formations may follow local hiatuses. However, a repetitive sequence of sandstones, marls, shallow water carbonates is regularly observed as controlled by eustatic sea level oscillations at the northern passive margin of the Indian plate.
A major unconformity with locally deep cutting erosion is observed in the Palaeocene. This unconformity probably indicates the first collision episode of the Indian margin with the Kohistan arc (TREOLAR et al. 1992). It erodes sediments towards the SE, so the Mesozoic and partly the Permian are missing in SE Potwar (GHAZIet al. 2014). The unconformity is overlain by sandstone, limestone and deep marine shale-marl deposited in a foredeep basin. The basin topography is gradually filled up by Eocene shale, clay, evaporite and several levels of shallow water limestone. The most prominent is the Kohat Limestone that forms smaller mountains and ridges in the Kohat Plateau(VESTRUMet al.
2011).
The total thickness of Permian to Palaeogene is 1 500–
2 000m in Kohat Plateau (VESTRUMet al. 2011), while it is reduced to 500–200 m in the Potwar Plateau and Margala
Hills. Locally, Palaeogene may thicken in Kohat because of tectonic reasons (GHANIet al. 2018).
Again a major break and an unconformity is observed at the top of Eocene (Figure 3). (Oligocene)–Miocene–Plio - cene–Pleistocene continental sediments are deposited local - ly in huge thickness (in excess of 6–7 km) on top of the older formations (GHAZIet al. 2014). Most of these sandstones- shales-conglomerates have fluvial origin and gradually fill up the subsiding Himalayan foredeep. The formations are diachronous and show strong lateral thickness variations (GRÉLAUDet al. 2002, GHAZIet al. 2014). Dating was mostly done on the basis of palaeo magnetic zonation, calibrated by rare radiometric ages of tuff horizons and even rarer fossil record (JOHNSONet al. 1982, 1986; MEIGSet al. 1995; GRÉLAUD et al. 2002); Eocene oldest ages for this molasse (BOSSART&
OTTINGER1989) have been revised to be at least Oligocene or younger (NAJMANet al. 2002). The Murree Formation, the oldest member of the molasse is generally assumed to range from 22 Ma to 18 Ma (e.g. JOHNSONet al. 1982, MEIGS et al. 1995, GRÉLAUDet al. 2002); this forma tion occupies most of the Hazara syntaxis core area as well as the mountains immediately SE of the Margala Hills (Figure 2).
It is also present in limited thickness in the Kohat Plateau.
The overlying Kamlial Sandstones range until 14–13 Ma (JOHNSONet al. 1982, GRÉLAUDet al. 2002). This formation is exposed in the cores of folds north of Soan syncline in Potwar and on fold limbs in Kohat Plateau (Figu re 2). The Chinji red shale-clay is discordantly overriding older molasse as well as eroded older sediments. This is the first Miocene cover on the Surghar and the Salt Ranges (MEIGSet al. 1995, GHANIet al. 2018). Its age spans to 10.8–10 Ma (JOHNSONet al. 1982, GRÉLAUDet al. 2002). The overlying Nagri and Dhok Pathan Formations span until 8.8–7.9 Ma and 5.7–5.1 (JOHNSONet al. 1982, GRÉLAUDet al. 2002). The youngest Soan Formation and local conglome rates, silts are Late Pliocene–Pleistocene in age.
Eastern Surghar Range
Surghar Range (Figures 1, 2, 4) is an exposure of Permian–Eocene rocks, topped by the Miocene molasse, that are all overthrust to the south on top of Plio–Pleistocene molasse (underlain by the same stratigraphy as the Hanging - wall; DANILCHIK & SHAH 1987, GHANI et al. 2018). The range is composed of three different segments: the Makar - wal segment of N–S, the Surghar segment of E–W and the Western Salt Range segment again of N–S orientation (Figu re 4). The latter is composed of individual lobes: the Gundi and Mussa Khel Lobes (MCDOUGALL& KHAN1990, GHANI et al. 2018; Figure 1). Along the range Jurassic–
Eocene sediments are exposed in the higher mountain part.
They are overridden by Late Miocene Chinji and Nagri Formations; younger terms of the molasse are also present further north and in the east, i.e. on the western Potwar Plateau (DANILCHIK & SHAH 1987). Cambrian–Palaeozoic forma tions are only exposed in the Western Salt Range,
while Permian–Triassic is exposed locally at the NW corner, between the Makarwal and Surghar segments. In other places the deepest exposed stratigraphic term is Jurassic (GEE1980, DANILCHIK& SHAH1987). According to own obser vations in both the Makarwal and the Surghar segments, the formations are folded into tight, eastward and southward facing folds with Jurassic cores. The inward limbs are subvertical to overturned; even Eocene, eventually also Late Miocene Chinji Formation take part in this fold - ing. Thrusts are either not exposed, or not evident on the surface; only a small portion at the central southern part of Surghar segment may expose the main thrust. In most of the range the main thrust (see later) remains blind and buried close to the surface (Figure 4).
In the eastern termination of the Surghar segment there are two relaying ranges of Palaeozoic–Eocene succession locally underlain by the Cambrian Salt Range formation.
The northern one terminates by an anticline plunging to the east; cut in the north by a steep E–W fault. The southern exposure, near Kalabagh has a main NW–SE orientation and is overlain by Miocene molasse. However, both are
eroded and overlain by a Pleistocene conglomerate (GEE 1980, YEATSet al. 1984, MCDOUGALL& KHAN1990, GHANI et al. 2018). All these structures are flanked from the SW by the ‘Cemetery fault’ (Figure 4; same authors). A smaller set of exposures is found in the continuation of this rock body south of Indus river, then terminates in a lenticular shape.
Further south another lenticular shape body is found in the direct continuation: the Gundi Lobe (Figure 4). While the Kalabagh lens is very tightly and complexly folded, the Gundi Lobe exhibits a tight, but simple anticline with a southern steep limb. In most maps (GEE1980, DANILCHIK&
SHAH1987, MCDOUGALL& KHAN1990, GHANIet al. 2018) this is underlain by a SW-facing thrust. Yet another exposure of Palaeogene strata is found in an imbricate directly beneath and south of the former thrust-fold structure.
In simple terms all the structures and formations seem to curve southwards, towards the Western Salt Range segment. The change in orientation occurs near the city of Kalabagh, at a spectacular break-through of the Indus river.
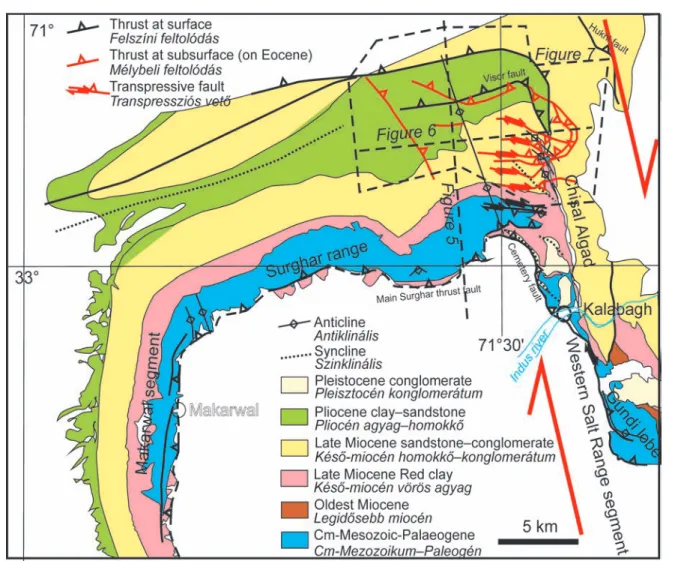
Longer fault segments on the western side of the Western Salt Range segment run NNW–SSE. The fault between the Figure 4.Simplified geological map of the Surghar Range, Western Salt Range area, after GEE(1980), DANILCHIK& SHAH(1987), own observations.
locations of later figures in stippled lines
4. ábra. ASurghar Range – Western Salt Range terület egyszerüsített földtani térképe, GEE(1980), DANILCHIK& SHAH(1987), nyomán, saját megfigye lé - sekkel módosítva. Későbbi ábrák helyei szaggatottal jelölve
Kalabagh and Gundi lenses apparently continues north - wards in a topographic low, called Chisal Algad (Figure 4), along which several small exposures of Salt Range salt plugs occur (GEE1980, YEATSet al. 1984, MCDOUGALL&
KHAN1990, GHANIet al. 2018). All authors suggest that the whole N–S oriented zone, from Chisal Algad to the Western Salt Range segment was a major Pleistocene right lateral shear zone (GEE1980, KAZMI& RANA1982, YEATS et al. 1984, MCDOUGALL& KHAN1990, AHMADet al. 2010, GHAZI et al. 2014 and their Figure 11, GHANI et al. 2018, their Figures 3, 12; CRAIG et al. 2018, their Figure 5), According to this interpretation a lateral ramp was gener - ated along Chisal Algad and its due south con tinuation that right laterally offset the Kalabagh and Gundi Lenses with respect to each other. The so defined Kalabagh Fault accounts for more than ten km right lateral offset (varying according to authors). Most authors (e.g. MCDOUGALL&
KHAN 1990, AHMAD et al. 2010) continue the Cemetery Fault northwards into a ‘Surghar Fault’ (not displayed on Figure 4) that runs until the eastern tip of the northern Cambrian–Eocene exposure. Accor ding to them the Kala - bagh lens was again right-lateral ly offset along the ‘Sur - ghar Fault’ from the northern exposures.
MCDOUGALL& KHAN(1990) described field exposures in detail, yet they did not find any exposed trace of a major right lateral fault. On the other hand, they did find several east-dipping thrusts offsetting even Quaternary conglome - rates and steeply dipping Pliocene sediments.
Own observations
Petroleum exploration in the region, and in the very corner in question produced helpful seismic sections, 3D cubes in a structurally very interesting area. In the following a N–S oriented, and an E–W oriented seismic section is shown, together with a time slice of a 3D cube.
The N–S oriented section (Figure 5) shows the Surghar Range hangingwall as a tabular slab with minor internal deformation, that is pushed onto its young foreland. There may be smaller local thrusts within the older formations of that foreland, close to the basal thrust of Surghar. However, due to a possible velocity-pull-up effect, the amount of imbrication and local uplift within the foothill zone is hard to estimate. The slab-like behaviour of the hangingwall geometry suggests a ductile detachment, i.e. possible pre - sence of Salt Range formation (in spite of the fact, that it is not exposed anywhere in Surghar–Makarwal segments).
The major thrust fault propagates upwards, but based on mapping it is not exposed; therefore, it should run blind along a shallow detachment within the Plio–Pleistocene.
The tight, southwards overturned folds seen in surface sections are not imaged by seismic because of technical limitations; they are drawn on the figure based on surface observations. There may be smaller thrusts both towards the south and towards the north on the back-limb of the thrust.
Some of these are quite steep and form WNW–ESE linear
segments with varying offsets in the eastern part of the 3D area (Figure 4; such faults are not seen on Figure 5 since they are found east of the section trace). Because of their steep dips it is suggested that these are transpressional faults. Right lateral offsets (shown on Figure 4) are just in - dicative because true offsets other than thrusts could not be revealed.
There are several folds, associated thrusts that can be interpreted within the Miocene succession (Figure 5). It seems that there are at least two detachment horizons within Miocene: one at its base (possibly Chinji Fm); another higher in the section (possibly higher in Nagri Fm see Figure 3). The surface structural expression of faults and thrusts might be entirely detached from the Cambrian–
Eocene level structures (Figure 5). This is also suggested by the map (Figure 4), where the surface structures (in black) do not correspond at all to the ones mapped on the top Eocene of the backlimb of the Surghar slab (in red).
The E–W section (Figure 6; taken from the 3D cube) shows surprising features. First, it displays a regional fold with roughly N–S axial trace just north of the eastern lobe of Surghar segment (Figure 4). This anticline can be followed not only in pre-Eocene but also in Miocene formations as Figure 5.N–S 2D seismic section across Surghar Range; uninterpreted and interpreted time sections. TWT = Two-way travel time. For location see Figure 4. Red indicates interpreted faults
5. ábra. É–D-i 2D szeizmikus időszelvény a Surghar-hegyláncon keresztül, értelme - zetlen és értelmezett változat. TWT = kétutas futási idő. A szelvény helyzete a 4.
ábrán. A vörös vonalak feltolódásokat jelölnek
well (Figure 6), therefore it should be a young feature. The anticline is also clearly seen by a minimal recess within the eastern termination of Surghar segment (Figure 4). All struc - tures, main Surghar Fault and Cemetery Thrust included are gently bent by this fold of NNE–SSW axial trace.
The eastern limb of this anticline (Figure 6) shows two imbricates with eastern vergency; Eocene and older rocks are clearly thrust on top of each other. Moreover, in the eastern - most part a deeper anticline within Eocene and older rocks are also seen. This deeper structure is clearly along the strike of the surface Western Salt Range segment. To be noted is the strong discrepancy between surface structures (tight anti - clines in Chisal Algad region) and those in the under lying Cambrian–Eocene succession. At least one detach ment in Miocene can be inferred (Figure 6). There is also no direct link between the surface and deep structures; presence of salt plugs within Miocene in Chisal Algad should be the result of salt extrusion and rise along a combination of faults in the lower and detached Miocene sections.
On the western limb of the anticline a steep thrust fault
with NNW–SSE orientation is seen (Figure 6). This fault has varying offsets and since it does not interrupt surface exposures (Figure 4), it is inferred to die out towards the south. However, this fault cannot be mistaken with the earlier proposed Kalabagh Fault.
The most surprising in the E–W seismic section (Figure 6) is the lack of any interruption, break, change in seismic reflection character along the main valley, Chisal Algad, the proposed trace of the regional, deep seated Kalabagh Fault.
Instead, Miocene reflectors above the two imbricates clearly suggest a tight anticline made of young rocks (Figure 6). These tight anticlines are also interpreted on the map (Figure 4) as a set of en echelon folds with NNW–SSE orientation.
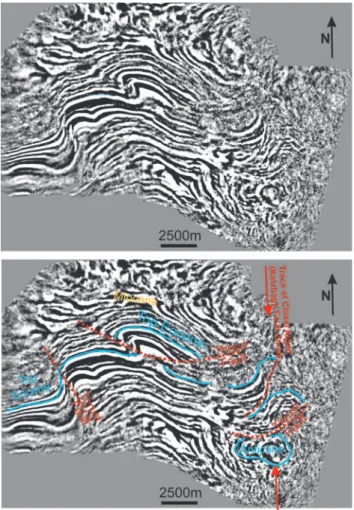
The time slice (Figure 7) shows the above described structural features in a map-view section. One can clearly identify the major, regional anticline (with a local imbricate structure in the north, see also Figure 4) and the two east- vergent imbricates (Figure 7) that have both a curvilinear, northwards flexed thrust surface. These eastwards thrust faults have a different map view (Figure 4) because the map
Figure 6. W–E 3D seismic section across northern limb of Surghar Range;
uninterpreted and interpreted time sections. For location see Figure 4. Red indicates interpreted faults
6. ábra.Ny–K-i 3D szeizmikus időszelvény a Surghar-hegylánc északi lejtőjén. A szelvény helyzete a 4. ábrán. A vörös vonalak feltolódásokat jelölnek
Figure 7. Time slice at 2.9 seconds from 3D cube, uninterpreted and inter - preted versions. Location on Figure 4. Note the absence of any deep-seated interruption, break along the trace of Chisal Algad valley, the supposed trace of Kalabagh Fault (red arrows). Red stippled lines indicate interpreted thrusts 7. ábra. 2,9 secundumos időszelet a 3D tömbből, értelmezetlen és értelmezett válto - zat. A szeizmikus felületen a vörös nyíllal jelölt csapásban (Chisal Algad-völgy) semmilyen mélyre hatoló lineáris, törésszerű elem (Kalabagh törés) nem látható.
A szaggatott vörös vonalak az értelmezett feltolódásokat jelölik
shows the fault cut-off at Top Eocene level and not at hori - zontal (i.e. iso-time) as the time slice. A smaller elliptical outline of the fold located at the deeper eastern part of Figu - re 6is also seen to the south of the top-eastward imbricates.
We can also see in the south-easternmost area, that the Surghar Range exposed part will curve southwards as the surface geology (Figure 4) suggests.
Again, the most surprising is that there is no apparent major boundary, break, offset along the proposed trace of the Kalabagh Fault that should be a deep-seated, regional lateral ramp (GEE 1980, KAZMI& RANA1982, YEATSet al. 1984, MCDOUGALL&
KHAN1990, AHMADet al. 2010, GHANIet al. 2018).
A closer look at the surface geology of the area (Figure 4) suggests that some deep structures are not detached from their Miocene cover. In the NW corner of Surghar Range, between the Makarwal and Surghar segments the Palaeo - zoic–Eocene rocks, together with their direct Mio cene cover both curve southwards towards Makarwal. It is interesting to note that in the internal, southern part of the curvature the Permian–Triassic–Jurassic strata are taken into N–S axial trace folds (Figure 4;DANILCHIK& SHAH1987). In the south- eastern portion between the Surghar and Western Salt Range segments Cambrian and its Miocene cover also turn south - wards together. However, in the NE part of the map, along Chisal Algad, one can observe that red Late Miocene clay (Chinji Fm), the oldest term of Miocene cover, turns north - wards across a syncline and forms a series of tight anticlinal cores (Figure 4). In the very heart of these, two tiny ex - posures of Cambrian salt occur. These tight anticlines are probably detached from the eastwards facing Eo cene-older imbricates at depth (Figsures 4, 6). The eastern side of the valley consists of Late Miocene–Pliocene formations in the cover of the red clays. Although there might be minor offset along local faults, no major, regional and pluri-kilometric fault is needed to explain the geology. In short, the regional, deep-seated Kalabagh Fault is not needed.
In the north, north of Chisal Algad the map (Figure 4) shows a series of curvilinear thrust faults that repeat parts of the Miocene section (Visor Fault system; DANILCHIK& SHAH 1987) or that cut up from the Eocene and die out in Miocene (Hukni Fault; GHANIet al. 2018). The eastern termination of both faults curve southwards. Since the southwards curva ture is apparently coherent with a southwards advancing Salt Range frontal thrust with respect to a trailing Surghar frontal thrust, most authors (GEE1980, KAZMI& RANA1982, YEATS et al. 1984, MCDOUGALL& KHAN1990, AHMADet al. 2010, GHAZI et al. 2014, GHANI et al. 2018) suggest that their proposed Kalabagh Fault should run along the Chisal Algad and be linked to the southwards flexed tip of Visor and/or Hukni (or only Visor) thrust faults. On the seismic (mostly on E–W lines, but not on Figure 6) the Visor fault can be indeed seen as a geometric unconformity within the Mio - cene. This is a relatively flat thrust that cannot be directly rooted into any mapped structure in the Cambrian–Eocene sequences. Eventually the limits of 3D volume do not enable to further detail that question.
Summarising the observations in this sector (Figure 4),
there are obvious indications of major N–S shortening, like the basal thrust along the Surghar segment. However, beside this (general) southwards structural transport there are multiple structures formed by E–W (ENE–WSW) shortening. In short, the local structures suggest much more folding of an originally more linear or slightly undulating orogen, than major right lateral or left lateral fault offsets along the N–S segments. Near Kalabagh and in particular along Chisal Algad, no regional, deep- or even shallow-seated fault could be observed and indeed, it is not needed to adequately explain the surface and deeper geological structures. On the eastern limb of the N–S trending fold a localised series of steep transpressive faults with E–W orientation are found in a wider zone with N–S orientation, along the Chisal Algad. A potential explanation for this zone is given in the Discussions.
Eastern end of Potwar Plateau and of Margala Hills
The region consists of four quite distinct geological areas (Figure 8): 1) the Margala Hills (BURGet al. 2005), limited to the south by the Main Boundary Thrust (MBT); 2) the North Potwar Deformed Zone (NPDZ; JASWAL et al.
1997; JADOONet al. 1997, 1999) south of MBT and north of the Soan syncline; 3) the Salt Range and its northwards limb, comprised between the Soan syncline and the Salt Range boundary thrust (GRÉLAUDet al. 2002), 4) finally the Hazara syntaxis, which is found to the east and north of the former areas (BOSSARTet al. 1988).
1) Margala Hills is a range gradually elevated from west to east up to 3 km asl (Figure 1). It is composed of Jurassic–
Eocene sediments, underlain by Late Proterozoic–Early Cambrian shales, the lateral equivalents of Salt Range form a - tion (e.g. BURGet al. 2005). The Eocene succession termin ates by the red Kuldana shales that may form a detachment. The Palaeocene Patala Shale may form an additional detachment (Figure 3). The sedimentary contact of Palaeo zoic and Jurassic is preserved in a northern unit, which has the same characteristics as the Margala Hills s.str, but which are found north of the Hazara–Natia Gali Thrust (Figures 8, 9; BURGet al. 2005). For some (e.g. TREOLARet al. 1992) the Margala Hills are composed of stacked imbricates; for some others (e.g.
BURGet al. 2005) one single unit builds up the area.
The exposed rocks are very intensely deformed; this is expressed as map scale folds and thrusts of different size (LATIF1968) to outcrop scale folds of different orientations.
BURGet al. (2005) give at least three different axial orient - ation for these folds: ENE–WSW; NW–SE and N–S. These measurements coincide with our observations (Figu re 9).
Faults are rarely exposed, nevertheless BURGet al. (2005) were able to reconstruct palaeo-tensors for 16 of their sites (the others did not satisfy their calculation criteria). Coin - cid ing with fold directions, the main sigma1 orientations were: NNW–SSE to NE–SW and E–W; with several strike slip type stress tensors. These authors emphasised the im - portance of transpression and imagined the Margala Hills as
a series of pop-up structures (BURGet al. 2005, their Figure 3) with relatively small allochthony.
Pre-Miocene rocks are overthrust towards the south onto the (Oligo-)Miocene molasse along the Main Boundary thrust (TREOLARet al. 1992, BURGet al. 2005). The amount of overthrust is debated: in the order of 100km (TREOLARet al. 1992) or just a couple of tens of km (BURGet al. 2005).
MBT may have different dips: it can be locally subvertical or even overturned, as also documented by BURGet al. (2005, their Figure 3) and our own observations. MBT runs at the northern outskirts of Islamabad, where it is expressed as the sudden rise of the mountain belt. Further east the topo - graphic expression is less pronounced. However, east of Murree city MBT turns to north and then to NNW–SSE orientation, where it is called Murree Fault and forms a sharp, subvertical surface with oblique-horizontal scars along the boundary to the Oligo-Miocene (Figure 8;BURG et al. 2005). General understanding (KAZMI& RANA1982, BOSSARTet al. 1988) suggests that the N–S portion of the fault (Murree Fault) is in fact a lateral ramp, linking the frontal parts of Margala Hills to the northern thrusts of Hazara syntaxis.
2) On the surface the NPDZ (Figures 2, 8) is char - acterised by vast exposures of the Murree and Kamlial Formations (Figure 3), the oldest terms of Miocene molasse. These are frequently crossed by ENE–WSW strik - ing thrusts and are affected by ENE–WSW axial direction folding (Figures 8, 9). A narrow long belt of similar orientation made of a major Eocene cored fold, the Khari
Figure 8. Blow-up geological map of the Margala Hills, Potwar, Hazara and Salt Range area. simplified and modified after CALKINS& OFFIELD(1974), BOSSART
et al. (1988), BURGet al. (2005), QAYYUMet al. (2015) and GHAZIet al. (2014), incorporating a manuscript map of S. AHMAD
PKF = Panjal–Khairabad Fault; MBT = Main Boundary Thrust; KMF = Khari Murat Fault;
KCR = Kala Chitta Range. Later figures marked as thin stippled lines. Red sticks around the Hazara syntaxis indicate long axes of strain ellipsoids measured by BOSSARTet al. (1988) 8. ábra.A Margala Hills, Potwar, Salt Range és a Hazara szintaxis egyszerűsített földtani térképe CALKINS& OFFIELD(1974), BOSSARTet al. (1988), BURGet al.
(2005), QAYYUMet al. (2015) és GHAZIet al. (2014) nyomán, S. AHMADkéziratos térképét felhasználva
PKF = Panjal-Khairabad Fault; MBT = Main Boundary Thrust; KMF = Khari Murat Fault; KCR
= Kala Chitta Range. Későbbi ábrák helyszíne vékony szaggatott vonallal. A Hazara-ív körüli vastag vörös pálcák deformációs ellipsziodok hossztengelyeit jelölik BOSSARTet al. (1988) alapján
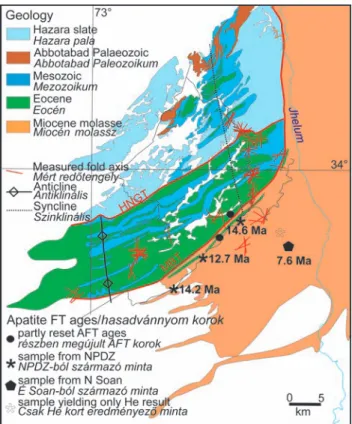
Figure 9. Simplified geological map of the Margala Hills and immediate southern foothills after LATIF(1968), incorporating a manuscript map of S.
AHMAD
HNGT = Hazara-Natia Gali Thrust; MBT = Main Boundary Thrust. Red sticks mark own fold axis measurements; data collected by L. CSONTOS, Á. SASVÁRI, T POCSAI, L KÓSA. Note the presence of N–S trending outcrop-scale folds. Same lithology key as for Figure 2 9. ábra.A Margala Hills és közvetlen deli előtere egyszerűsített földtani térképe.
HNGT = Hazara-Natia Gali Thrust MBT = Main Boundary Thrust; A vörös vonalak feltárásokban mért redőtengelyeket jelölnek by CSONTOSL., SASVÁRIÁ., POCSAI T., KÓSA L. mérései alapján. Megjegyzendő az É–D-i tengelyű redők jelenléte. A kőzet-jelkulcs megegyezik a 2. ábráéval
Murat Range, is exposed in the middle of this zone (Figures 2, 8). Taking subsurface infor mation (just west of our Figure 10) into consideration NPDZ was described as a stack of imbricates or a duplex structure by JASWALet al. (1997, their Figure 7), JADOONet al. (1997). The zone is formed by thin slices of the Cambrian–Eocene succession together with their Miocene cover; however, the same authors also suggest some detachment within the Mio cene. A very similar struc - ture was described across the Kha ri Murat Range by JADOON et al. (1999). However, the pro posed imbricates beneath the exposed Khari Murat Range were subsequently not con- firmed by drilling. All authors dea ling with NPDZ sug - gested the existence of a major back thrust on the northern limb of the Soan syncline. This should have acted as a hangingwall-backthrust to form a triangle zone beneath (JASWALet al. 1997, JADOONet al. 1999).
3) Salt Range is a long and wide set of Cambrian–Palaeo - zoic–Eocene exposures, onlapped by Late Miocene–Plio - cene, locally Pleistocene molasse (JOHNSON et al. 1982, GRÉLAUDet al. 2002, QAYYUMet al. 2015). On the northern back-limb the Late Miocene–Pliocene forms the gentle Potwar Plateau, taken into local folds; the latter being more and more frequent towards the east (Figure 8). The huge Soan syncline forms the northern regional structure to this area.
The southern edge is built of an escarpment made most ly by the Cambrian Salt Range formation and its Palae ozoic cover.
The basal shear zone is composed of salt (GRÉLAUDet al. 2002 and references therein). This basal shear zone terminates east of Khewra as a dead-end (QAYYUMet al. 2015; Figure 8). The Palaeozoic–Eocene exposures are closed by a complex set of exposures. The eastwards end of Salt Range is apparently flexed towards the NNW into the Chambal Range (Figure 8) then it is flexed towards the NE (TREOLAR et al. 1992, QAYYUM et al. 2015), some flexing being supported by palaeomagnetic data (TREOLARet al. 1992). The structure was analysed in detail by QAYYUMet al. (2015). According to their interpretation, the transversal Chambal segment was formed along a local lateral ramp oblique to the main Salt Range thrust. These authors also mention the Pabbi Fault (Figure 8) that runs in due continuation of the Salt Range trend but does not expose the older strata.
There is a set of NE–SW trending tight folds composed of Late Miocene–Pliocene formations on the eastern margin of this area. These structures were intensely explored for Petroleum (JADOONet al. 2015, their Figure 1). These were interpreted as deep imbricates or duplexes, similar to other parts of the NPDZ, although their transpressional character was also recognised (e.g. QAYYUMet al. 2015, their Figure 10). The core of these folds is composed of Cambrian–
Eocene strata, overlain by Miocene molasse. However, at least one detachment within the Miocene is possible and locally active; therefore the folds at surface do not neces - sarily fully represent the structure at depth (Figure 8).
4) The Hazara syntaxis has a curvilinear shape with an ENE–WSW oriented northernmost portion (CALKINS &
OFFIELD1974, BOSSARTet al. 1988; Figure 8). There are two thusts parallel to each other, but both affect the same
lithostratigraphic units with identical, weakly metamorphic Permian–Early Mesozoic rocks, mostly volcanites. CALKINS
& OFFIELD(1974) defined a small unit in the NE corner of the syntaxis that exposes Mesozoic rocks with Margala affinity. This zone was described by BOSSARTet al. (1988) as a ‘mélange’ zone, with the understanding of a sheared unit of Mesozoic rocks (Figure 8). As opposed to the overlying Permian–Early Mesozoic, this unit might belong to a dif - ferent structural unit (see later).
All around the syntaxis crystalline and Mesozoic rocks are thrust centripetally inwards over an Oligo–Miocene anchi - metamorphic clastic succession (CALKINS& OFFIELD1974, BOSSART et al. 1988; Figure 8). The originally inter preted Eocene ages of this molasse (BOSSART& OTTIGER1989) were later re-examined and because of younger radiometric ages NAJMAN et al. (2002) reinter preted the onset of Molasse sedimentation to not earlier than 25 Ma (Late Oligocene). The anchimetamorphic, cleaved clastic material in the centre gradually passes southwards to non-metamorphosed Lower Miocene Murree Molasses of the NPDZ. Near Muzaffarabad the molasse is underlain by Palaeogene and older rocks that are very similar to those exposed in the Margala Hills (BOSSARTet al. 1988; Figure 8). This Palaeogene is uplifted along the SW- verging Balakot Thrust fault and is taken into an asymmetric fold, suggesting a top-SW transport (BOSSARTet al. 1988).
BOSSART et al. (1988) measured strain ellipsoids in reduction spots of the Murree Formation. They suggested that deformation observed in the Murree Fm relates to a cigar-shaped strain ellipsoid with subvertical elongation and with a main flattening surface trending NNW–SSE. The two shortening axes were oriented ca NNW–SSE and ENE–
WSW. Based on their strain measurements they suggested massive ENE–WSW shortening within the syntaxis, resul - ting in ductile folding of the Murree Formation.
They also measured strain ellipsoids mostly in the amygdales of Permian basalt in the overthrust nappes above the Murree Fm (Figure 8). These markers (that are born under weakly metamorphic conditions) seem to be parallel with the main local thrust and may be indicating shortening perpendicular to the main thrust surfaces. In the northern portion, where the chain turns ENE–WSW, these strain markers also seem to turn, although some depart from the exact trend of the main thrust fault. They interpreted this pattern as an indication of top SW and top SSE shear.
Own observations
A regional dip line across the Margala Hills-NPDZ area until the Soan syncline is presented (Figure 10). Two wells of more than 4 200 m (northern well) and 5 300 m (southern well) are projected from 5 and 6 km into the section. The northern well went through multiple repetitions of the Eocene–Mesozoic succession: after encountering a topmost normal then overturned succession of Eocene–Cretaceous of ca 1 300 m thickness, it drilled a normal sequence of Eocene marl and subordinate limestone with Palaeocene
shale of ca 650 m thickness, then again a normal sequence of Eocene–Cretaceous of ca 1 500 m thickness with Palaeoce - ne shales at bottom of this section in a potentially overturned position; finally a disturbed succession of Eocene marl and a repetition of thin units of Palaeocene shale, limestone and thin Cretaceous (ca 600 m thick). Steep dips with often chaotic pattern characterised the whole drilled section. This fact together with the many potentially overturned sections suggest that the whole drilled assemblage is composed of tight, flat-lying folds. This is compatible with observations at surface (see the outcrop pattern on Figure 9).
When comparing the well section to the seismic a strong disharmony is observed. The tight, recumbent folds might not be imaged by seismic because of technical limitations, however, the steep dips should be somewhat displayed.
Instead, one finds rather continuous sets of reflectors form - ing a major antiformal stack (the core of which was drilled).
There might be two approaches: a) the seismic is totally irrelevant and shows only artefacts; b) the seismic shows basic units and structures, however cannot resolve the small- scale perturbations experienced by the well. Since the seismic pattern is rather consistent throughout the Margala Hills area, we believe rather the second option is true.
Therefore, the interpretation is adjusted to symbolically indicate the tight, flat folds which are themselves apparently re-folded into a major antiform.
Because of the sharp breaks and thrust faults observed in the northern well and also because of the excessive thick ness of drilled sediments compared to the reduced original thick–ness, it is necessary to introduce large thrusts between the individual drilled sucessions. We believe at least 4 imbricate sheets are documented by the well (separated by violet thrust surfaces on Figure 10). The uppermost one was not drilled, but projects above the well sequence. It is interesting to note that the highest sheet has a high thickness near MBT because of multiple possible repetitions along south-dipping back-thrusts. Because of thickness relations, it is possible that a small wedge of Mio - cene molasse is also captured beneath the topmost imbricate.
All these imbricate sheets are folded into the antiform. The lowermost imbricate is underlain by a major ramp-flat thrust that can explain formation of the antiformal stack. This fault cuts up to the mapped MBT trace, therefore it is suggested that this is indeed a branch of MBT. Large overthrust of minimum 20 km is proposed along this branch alone.
Below the described antiformal stack lies a rather tabular body indicated by continuous, strong reflections (Figure 10). Near surface, this unit projects to Upper Eocene units immediately south of MBT (Figures 8, 9). Towards the west this unit continues in the Kalachitta Range (Figure 8), yet another mountain with Margala Hills affinity Mesozoic. It is therefore proposed that the tabular body is in fact another branch of MBT, with considerable (ca 15 km) minimal offset.
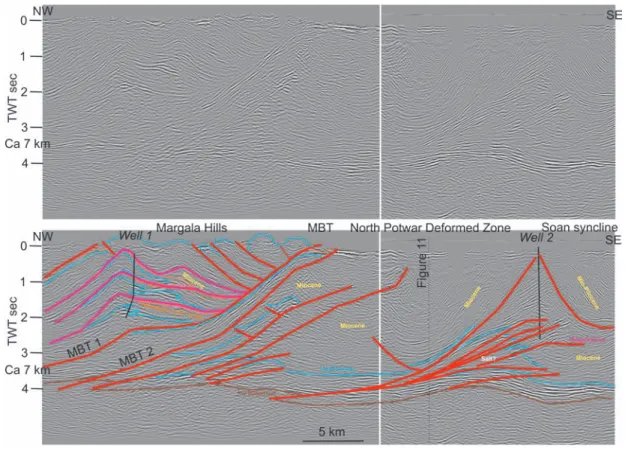
Figure 10. 2D seismic time section across Margala Hills and North Potwar Deformed Zone, uninterpreted and interpreted versions. MBT
= Main Boundary Thrust. For location see Figure 8. Yellow indicates Miocene bed
10. ábra. Szeizmikus szelvény a Fő-feltolódással párhuzamosan, attól délre. A szelvény nyomvonala a 10. ábrán szerepel. Ugyanaz a színkód, mint a 7. ábrán. A sárga egy miocén reflektort jelöl
Several other tabular units along steeper thrusts can be interpreted immediately beneath these branches of MBT (Figure 10). These may cut upwards from a smaller duplex structure at depth, however, the seismic definition of the latter is far from clear. These imbricates may explain some of the thrusts cutting through the Miocene section in this part of NPDZ (Figure 8). From the section it is not clear whether the thin Cambrian–Eocene succession is underlain by salt or not.
Further south the second well targeted a triangle zone proposed by JASWAL et al. (1997), JADOON et al. (1999) (Figure 10). In spite of the presence of strong reflectors in an antiformal pattern the well drilled only repeated Miocene molasse sediments; therefore this hypothesis needs some modification. Interpreting the section, a gentle upwarp is experienced at Basement and its immediate reflective Cambrian–Eocene sedimentary cover. However, this struc - ture might be uniquely due to velocity-pull-up. The reflec - tions above this warp are arranged in a fan-like pattern, very similar to the one interpreted in NPDZ by JASWAL et al.
(1997). It is believed that this fan indicates an imbricate structure of Cambrian–Eocene sediments floating above a reflection-free zone that possibly represents the Cambrian salt sequence (Figure 10). In summary, an imbricate stack does seem to exist, however, it does not reach as high as
proposed by earlier authors (JASWALet al. 1997, JADOONet al. 1999). North and south of this structure two synclines are imaged in the Miocene succession. While the northern seems to conformably overly the proposed Eocene reflector, the southern one that is the Soan syncline seems to be detached from the Eocene along at least one detachment within the Miocene (Figure 10). Further, the reflection pattern also confirms the hangingwall-backthrust along the northern limb of Soan syncline, proposed by JASWALet al.
(1997) and JADOONet al. (1999).
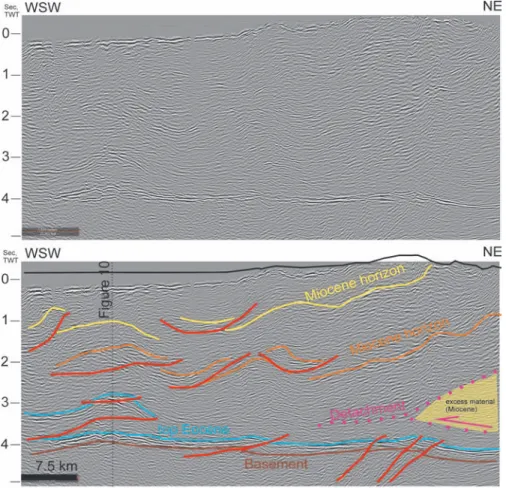
A regional E–W 2D seismic line (Figure 11) parallel and immediately to the south of the MBT shows the E–W structure of the NPDZ until the supposed trace of Jhelum Fault (latter not being covered by the section). The topo - graphy rises towards the east, while the basement and its Cambrian–Eocene sedimentary cover (strong reflections near the base of section, Figure 11) seem to undulate and gently subside towards the east. Moreover, in the eastern portion of the line, westwards dipping reflectors within the basement suggest a set of east-vergent thrusts/imbricates within the basement. The section indicates that major folds with N–S axial trace do exist in the young Miocene cover (Figure 11). Some of those may be just oblique sections of top-south imbricates, but there are some that are clearly imaged by the Eocene reflector as well.
Together with topography Miocene horizons are also up - lifted towards the east (Figure 11). These undulating horizons are then truncated by topo - graphy, so their uplift should have been even more important than the uplift deduced from topographic elevation. The geo - metry of eastwards subsiding basement and overlying Camb - rian–Eocene cover and Miocene is not conformable (Figure 11).
In other words, the upper and lower structures are clearly de - tached, and indeed there are multiple potential detachment horizons within shaly sequences of Miocene molasse. The space problem between the eastwards rising Miocene and eastwards subsiding Eocene basement may be resolved by a triangular shaped body, that could be a tectonically inserted excess mass of Miocene molasse, indicated by yellow shading on Figure 11.
This mass could ride a west- vergent blind thrust (see later).
N–S axial trace folds can be also inferred from map analysis.
Figure 11. 2D seismic time section parallel to and south of Main Boundary thrust in North Potwar Deformed Zone, uninterpreted and interpreted versions. MBT = Main Boundary Thrust. Orange and yellow indicate different Miocene horizons. For location see Figure 8
11. ábra. Szeizmikus szelvény a MBT feltolódással párhuzamosan, attól délre. Naranccsal és sárgával különböző miocén szinteket jelöltünk. A szelvény nyomvonala a 8. ábrán látható