Article
The Leniency of Personal Bankruptcy Regulations in the EU Countries
György Walter * and Jens Valdemar Krenchel
Citation: Walter, György, and Jens Valdemar Krenchel. 2021. The Leniency of Personal Bankruptcy Regulations in the EU Countries.
Risks9: 162. https://doi.org/
10.3390/risks9090162
Academic Editor: Stelios Markoulis
Received: 28 July 2021 Accepted: 30 August 2021 Published: 6 September 2021
Publisher’s Note:MDPI stays neutral with regard to jurisdictional claims in published maps and institutional affil- iations.
Copyright: © 2021 by the authors.
Licensee MDPI, Basel, Switzerland.
This article is an open access article distributed under the terms and conditions of the Creative Commons Attribution (CC BY) license (https://
creativecommons.org/licenses/by/
4.0/).
Department of Finance, Corvinus University of Budapest, F˝ovám tér 8, 1093 Budapest, Hungary;
jvk@krenchel.net
* Correspondence: gyorgy.walter@uni-corvinus.hu
Abstract:Discussions on personal bankruptcy regulations are usually focused on the controversial effects of leniency on society, economy, financial markets, entrepreneurship, and labour supply.
However, the methodology of measuring leniency has been limited to one-time legislative changes or some elements of the US personal bankruptcy system. In contrast, we create a composite index of personal bankruptcy legislations. We calculate the composite index for 25 EU countries and the US as a benchmark, validate the results, and rank the countries according to the leniency of their personal bankruptcy systems. We analyse the index scores by region, law origin, and the age of the regime.
We conclude that the systems show high heterogeneity and cannot be clustered by region or legal origin assumed based on former studies. However, there is a strong association between leniency and the age of legislation. Results indicate that personal bankruptcy policies in the EU are usually launched as creditor-friendly and are later shifted to a more lenient direction.
Keywords:personal bankruptcy; fresh start; leniency; public policy; EU JEL Classification:K35; G28; J18; O52
1. Introduction
Although personal bankruptcy (also named consumer bankruptcy) dates back to ancient times, the US bankruptcy legislation is regarded as the first and benchmark regime in modern societies. In modern terminology, personal bankruptcy law ‘is the legal process for resolving the debts of insolvent individuals, married couples, / . . . / entrepreneurs, and small business owners’ (White 2015, p. 3). After the acceptance of the US Bankruptcy Code in 1979, personal bankruptcy regimes have expanded all over the world. Focusing on Europe (Graziano et al. 2019), legislations were first passed in the Western European countries (Great Britain 1986; France 1989; Germany 1994; Austria 1995; Belgium and the Netherlands 1998–1999; Ireland 2012) and Scandinavian countries (Denmark 1984; Sweden, Finland, and Norway 1994). From 2000, more countries introduced personal bankruptcy legislations in Central and South-Eastern Europe: Slovakia (2006); Slovenia (2008); Czech Republic (2008); Poland (2009); Hungary (2015); Croatia (2015); Romania (2018). Personal bankruptcy regulation also exists in South-Europe: Spain (2013), Portugal (2004), Greece (2010), and Italy (2012). Baltic countries (Estonia, Latvia, Lithuania) have also implemented the regulatory framework over the last 10–15 years.
The diverse approaches, structures, and legislative solutions lead to different focuses in politics and scientific papers. Discussions about personal bankruptcy can be generally categorised as (1) comparative analyses; (2) evaluation of the social insurance and the relation of a fresh start, leniency to the incentives for entrepreneurship, the effect on labour supply; and (3) moral hazard issues, the question of discharge, relief of debt, a fresh start, and potential abuses; and (4) stigmatisation of the participants.
A key point in the comparative analyses of the systems is the attitude of legislators towards leniency and its consequences on the economy and society. This complex question
Risks2021,9, 162. https://doi.org/10.3390/risks9090162 https://www.mdpi.com/journal/risks
Risks2021,9, 162 2 of 20
of leniency versus negative and positive social, economic, financial effects is always centred in discussions among policymakers as well.
The terms describing leniency in the literature are related to the conditions of debt relief, possible discharges, and the opportunity for a fresh start. Debt relief refers to general measures taken to make it easier for a debtor to repay debts through deferral payments, easing debt service payments, or discharge. The discharge could be partial or full, and the borrower is relieved fully or partly from its obligations to a lender. The definition of a fresh start is connected to both debt relief and discharge. According to the Supreme Court Decision of 1934 by the US Courts, a fresh start
gives to the honest but unfortunate debtor a new opportunity in life and a clear field for future effort, unhampered by the pressure and discouragement of preexisting debt. / . . . / This goal is accomplished through the bankruptcy discharge, which releases debtors from personal liability from specific debts and prohibits creditors from ever taking any action against the debtor to collect those debts. (US Courts)
Bankruptcy procedures last until the borrowers receive a fresh start. In this complex process, we can define three phases and three milestones. The first phase lasts until the milestone of signing the first agreement/settlement between the creditors and borrower (either based on an out-of-court or juridical decision). The second phase lasts until the date when the specific agreement is fulfilled in either of the promoted regimes. Finally, due to possible legislative steps, there could be further restrictions (called stigmas) for the borrower even after being officially relieved from the obligations. These stigmas typically start in the first and second phase and can continue after the official discharge in the third phase to the third milestone. Based on the general definition, if the borrower passes the second milestone, they receive a fresh start.
Leniency as a common term has a broader meaning than just discharge or a fresh start.
The level of leniency of a personal bankruptcy system shows how the system handles the defaults of private individuals and entrepreneurs with unlimited liabilities, how easy or difficult it is for borrowers to achieve a fresh start, and, additionally, how harsh or lenient various possible stigmas are after receiving a fresh start. Although leniency is a key factor for policymakers and researchers to compare systems and analyse the effects, the measure of leniency was always limited to one-time events of legislative changes or some selective elements (such as homestead exemptions, judicial customs) of the US federal system. With this approach, the comparison and ranking of different legislations as well as cross-country analysis of leniency as a factor affecting the economy and society were not possible.
Our aim of the research is to construct a composite index, which includes all the characteristics and elements, in proportion to its importance, that the literature identified with leniency. We aim to develop an index that enables researchers to measure the impact of changes and the impact of cross-sectional differences in the leniency level of local legislations on the economic sector (entrepreneurship, credit market, labour supply). It develops a new option for researchers, where changes in leniency have been identified with one-off major reforms or one leniency element (exemption differences) so far. Finally, with the help of the leniency dimensions and index, we aim to compare and rank the personal bankruptcy legislative systems of all EU countries from the leniency aspect, to analyse the differences and similarities. We also aim to provide a tool for policymakers to understand the leniency-nature and the status of the local legislations relative to other countries and identify points where changes could make a significant shift if it is intended.
In the next sections, we first show how the literature identified and used leniency in comparative analyses and other research fields so far. Then, we introduce a new complex index for measuring leniency, which enables cross-country analyses and improves our understanding of the changes in given bankruptcy regimes. Finally, we measure, rank and analyse the leniency of the bankruptcy regimes of 25 EU countries, analysing the legislative environment in force in the countries in the year of 2020.
2. Literature Review
Personal bankruptcy regimes are of a great variety in the world, including the Eu- ropean countries. One important group of personal bankruptcy literature includes com- parative analyses. There is a grouping opportunity based on the general approach and whose interests—the debtors or the creditors—are more represented in the process. It is a widely accepted view that the debtors’ rights and interests are more preferred in the US, where the legislations are more lenient than in continental European countries, where creditor-friendly personal bankruptcy legislations are traditional.Efrat(2002, pp. 82–87) grouped the countries in the world based on the availability, certainty, and promptness of debt forgiveness as follows: conservatives have no discharge or fresh starts available; the moderate group consists of a chance for discharge and a fresh start; and liberals are those countries where a quick and automatic fresh start is available either via straight bankruptcy or through repayment settlements.Ramsay(2007,2012) discussed comparative consumer bankruptcy and described the main features of regulation, such as the influence of the US in introducing a fresh start in the legislations of European countries. He explained the differences based on the path-dependence of legal institutions, cultural differences, law origin or political interests, and the influence of different groups in society.Heuer(2014) classified consumer bankruptcy regimes into 15 advanced economies of the world. He identified a ‘common core’ of bankruptcies and defined four clusters of models (market, restriction, liability, and mercy model) based on fresh-start opportunities and restrictions.
In an extensive study (Graziano et al. 2019), the legislations of 30 European countries were presented and compared by country experts based on the same characteristics and dimensions of the systems (access, discharge, processes, competent courts, debtors’ and creditor’s position, costs, etc.).Kilborn(2020)presented acomparativeexploration of the personal bankruptcy systems of Russia and some countries in Europe and North America.
He focused on the eligibility and cost dimensions of the systems and revealed parallels with the structure of Russia and the benchmark countries. Ramsay(2020)discussed the implementation of the English Debt Relief Order of 2009 as a procedure for low-income debtors. He did comparative research of NINA (No-Income-No Asset) procedures in several countries such as Ireland, New Zealand,SouthAfrica but also referred to European jurisdictions (e.g., in Germany) where this solution was not allowed.
If consumer protection is reduced, there are three effects on consumers and debtors.
Firstly, debtors lose some of their existing protections (influencing entrepreneurship devel- opment). Secondly, there is an indirect effect of consumers receiving lower prices, which is debtors’ lower interest rates, and thirdly, there is a demand-expansion effect leading a new debtor to enter the market. These effects on the credit market are called “credit rationale” (Alexandrov and Jimenez 2017). Therefore, besides comparative analysis, the second relevant big group of literature we discuss here relates to this relationship among leniency, fresh start, the intensity of the insurance effect (the appearance of labour incen- tives, the entrepreneurial incentives), the existence of credit rationale, and their net effect on society. We can categorise these studies based on their main focuses—effect of leniency on entrepreneurship, credit rational, labour supply—in three subgroups.
The first subgroup focused on the effect of fresh start and leniency on entrepreneurial activity, whether more lenient personal bankruptcy systems made a positive effect on entrepreneurial activity.Fan and White(2003) concluded that greater state-level exemptions were associated with an increase in overall entrepreneurship. They exploited variation in the homestead exemption across US states, and one of the main findings was that the probability of owning a business was significantly higher in states with unlimited rather than low exemptions. Agarwal et al. (2005) analysed the impact of bankruptcy homestead and personal property exemption levels in different states on the likelihood of small business owners filing. Based on the files in the years 2000–2002, they found that the likelihood increased with gradually higher exemption levels.Lee et al.(2008) presented a real options perspective to present how entrepreneur-friendly bankruptcy encouraged entrepreneurship developments. Armour and Cumming(2008) used aggregated data
Risks2021,9, 162 4 of 20
from 15 countries in North America and Europe in 1990–2005 to analyse the conditions of discharge on entrepreneurship. They created and scored bankruptcy indices to evaluate the effect. They found that the lenient bankruptcy laws measured by the conditions of discharge significantly increased self-employment rates. Some papers conflicted with the results of the positive entrepreneurial effect of lenient systems.Cumming and Li(2013) examined the business starts and deaths on data over 1995–2010 concerning several aspects of public policy in the US. It showed a positive impact from the homestead exemption on entrepreneurship development only among the states in the bottom quartile and otherwise highlighted a negative impact.Patel and Devaraj(2021) examined the state-level exemption changes in the US and their effect on entrepreneurial activity. However, their results did not support the view that asset protection in personal bankruptcy systems improved entrepreneurial activity.
The second subgroup focused on the appearance of credit rationale due to a fresh start and leniency, whether more lenient personal bankruptcy systems created credit rational.
Berkowitz and White(2004) examined homestead exemptions across US states, they found that small firms with more lenient exemptions faced higher interest rates and face credit rational. White(2007) argued that the change to a less lenient system resulted from the BAPCPA led to a significant increase in the volume of revolving household debts. Some papers did not support the appearance of credit rationing. Pavan(2008) analysed the exemption level, the accumulation of wealth, and the tighter credit constraints. The study found that the net effects of changes in exemption on insurance and credit constraints were very small, and a more lenient policy reduced the net durable wealth in the first half of the life cycle.Simkovic(2009) examined the credit card industry and found little evidence that credit conditions for consumers improved due to the introduction of BAPCPA.Hintermaier and Koeniger(2011) also analysed homestead exemptions in the states of the US and found that bankruptcy regulation had only a small effect on the quantity and price of unsecured debt.
Although a relatively large number of studies examined the relationship between leniency systems, fresh start, credit rational, and entrepreneurship, only a few papers—in the third subgroup—have analysed the relationship between fresh start and credit rationale to labour supply or labour incentives (e.g.,Li et al. 2017;Han and Li 2007,2011). A recent study byChen et al.(2020) examined the effect of changes in personal bankruptcy systems on labour supply from the employer’s sides. They analysed whether and how changes in personal bankruptcy laws and the access of individuals to bankruptcy protection affected labour costs and corporate policies. They concluded that after a negative change in leniency, firms followed more conservative policies to mitigate employees’ expected welfare losses.
The literature dominantly focused on the US market and federal legislation, while fewer papers dealt with European countries.Davydenko and Franks(2008) examined the bankruptcy law and its effect on the credit market in some European countries (France, Germany, and the UK) based on firm data. Fossen and König(2015) andFossen(2014) focused on the effect of the reform of the Insolvency Code of Germany in 1999; the change led to a more lenient direction.Jia(2015) analysed the diverse welfare impact on workers and entrepreneurs in Europe.
Summarising the role and appearance of leniency in the literature presented above, these studies typically explored the overall effect of introducing the institution of fresh start under different legal circumstances or analysed a one-time change of new lenient or strict measures. They focused on the possible effects of a single event-though unable to measure the magnitude of the reform—on employment and entrepreneurship along with the results on the financial market (access to loans, prices, etc.). A typical field for such research is the introduction of stricter measures of BAPCPA in 2005 in the US (such asAlexandrov and Jimenez 2017;Simkovic 2009;White 2007) or a major reform in a country (e.g., the reform in Germany, seeFossen and König 2015;Fossen 2014). By characterising leniency for similar purposes, other papers highlighted some specific elements of the legislative systems, either by carrying on an empirical analysis or developing theoretical models.
These papers typically characterised leniency with the homestead exemption levels of the different federal state-level legislations (e.g.,Cumming and Li 2013;Hintermaier and Koeniger 2011;Pavan 2008;Agarwal et al. 2005;Berkowitz and White 2004;Berkowitz and White 2004;Fan and White 2003).
Based on the literature reviewed, we identified a research gap from two aspects. First, besides one-time events as a trigger and the differences in exemptions regulation that the literature regularly applied, there were no complex indicators constructed to describe and measure leniency level and the changes in leniency. To fill this gap and construct a composite measure, former comparative and descriptive analyses help us to identify the important indicators and dimensions of bankruptcy legislations, to compare and group regulations in the end. These papers described the main elements of the systems, in addition to the factors of leniency, and made some comparisons and analyses based on selected characteristics but not based on a composite index including all relevant aspects.
We found one research that built and scored indicators to describe the fresh start and bankruptcy characteristics of personal bankruptcy systems.Armour and Cumming(2008) created and scored six bankruptcy indicators (called ‘indices’: availability of discharge, years to discharge, minimum debt, exemptions, disabilities, the possibility of agreeing on a composition) to evaluate the effect on self-employment. We incorporate most of these indicators into our model, together with the elements of leniency used by other comparative studies in one composite index that creates the possibility for comparison and ranking. This index substantially broadens the number of indicators to characterise the seven main dimensions relative to any other comparative or policy-effect studies.
Secondly, most of the comparative papers focused on a group of selected developed countries of Europe, North America, or Asia, but typically not explicitly on Europe or not on the whole EU. We found one extensive study about the EU and other European countries (the book ofGraziano et al. 2019). They thoroughly described the legislation in a structured way and made some comparative analyses (see the chapter of Sajadova inGraziano et al.
2019) but did not select, identify, measure, compare in full, or rank the leniency elements of the countries and evaluate the leniency level that we do in our research presented in the next section.
3. Construction of a Composite Index of Leniency
Composite indicators gained great popularity in research during the last decades, resulting in a large amount of literature describing the methodology and ways of building composite indicators and indices. Greco et al. (2019) gave a complex review of the literature describing the methodological framework of constructing composite indices.
For the development of composite indices,OECD(2008) described the methodology as a 10-step process that serves as a checklist. In comparing the legislation of different countries, we also considered the methodology used byLa Porta et al.(1998) for similar purposes.
The level of leniency of a personal bankruptcy system describes how the system handles the defaults of private persons and entrepreneurs with unlimited liabilities, how easy or difficult it is for borrowers to achieve a fresh start, and how stigmatic the life of the borrower is after receiving the fresh start. More lenient systems enable a fresh start more easily, and the stigmas afterwards are less severe; in a less lenient system, a fresh start is either not offered at all or only after a restrictive, long, stigmatic, uncomfortable, expensive, and complex process with additional stigmas.
Leniency is, thus, an aggregative term that we characterise byseven main dimensionsof personal bankruptcy legislations: (1) accessibility, the existence of straight bankruptcy1; (2) eligibility; (3) costs; (4) complexity; (5) process; (6) conditions for discharge at debt restructuring; (7) stigmas of filing. These dimensions partly correspond to the categories defined byWhite(2007), who analysed the systems of some selected countries (US, France, Germany, England, Canada). She compared the bankruptcy policies based on the trade-off between providing insurance to debtors versus punishing default. She also used seven categories for the selection: the amount of debt discharged, asset exemptions, income
Risks2021,9, 162 6 of 20
exemptions, fraction of income above the exemption that debtors must use to repay, length of the repayment obligations, bankruptcy costs, and bankruptcy punishments. These categories correspond to our dimensions of ‘process’, ‘conditions of discharge’, ‘costs’, and
‘stigmas’, but we completed them with several other dimensions and indicators.
We break down the seven main dimensions into35 specific indicators. The seven groups of indicators altogether describe the dimensions and phenomena. Our dimensions and categories also follow the structure of the comparative analysis and country report of 30 European consumer bankruptcy legislations ofGraziano et al.(2019), who described regimes based on the possible processes, costs, discharge conditions, status of debtors, and creditors, supervision, and officeholders’ roles.
By data selection, we examined and analysed the regime of 25 EU countries and the US as a benchmark. Two countries (Bulgaria and Malta) currently have no personal bankruptcy regulations. We created indicators based on questions that are formulated for each subdimension. We obtained the data from complex legislations, which sometimes include different laws and judicial customs. By setting the indicators, we examined each country’s regime in parallel with the comparative research in this field (Armour and Cumming 2008;Graziano et al. 2019). Legislative solutions in Europe are highly diverse.
We searched for data that, first, unequivocally characterise the selected phenomenon and, secondly, could be detected in all the legislations. Data and indicators must also be comparable in different countries, and potential answers must be separative, covering all or most of the possible alternatives included in the legislation. Answers based on metric indicators (such as the cost of filing, volume of deposit, length of repayments, number of regimes, or number of years for restrictions, etc.) are typically unambiguous. However, non-metric indicators reflect various potential activities (events, constraints, income types, credit types, benchmarks, types of punishment, etc.), which are listed in different ways for each regime, and where legal concepts are fragmented in their definition or scope across EU jurisdictions. The formulation of these indicators must cover all the main possibilities in different local legislations. In some cases, indicators refer to a phenomenon that can be answered unambiguously (such as who drafts the repayment plan first, who bears the cost, whether the pre-action stage exists or not). In a few cases, however, subjective expert opinions need to be obtained regarding the complexity. Missing or doubtful data are completed based on consultations with the country’s legal experts.
We improved the data collection, indicator definitions, and data quality parallel to the analysis of laws and by discussing preliminary results with experts from 19 countries.
These experts, specialised in their local regime, validated the indicator scores of their countries. The created dimensions and indicators are detailed in Table1. Based on the comparative studies mentioned in the literature review section, we believe that these indicators are equally important to describe a dimension, and these dimensions altogether characterise the phenomena of leniency properly.
Similar to former studies (La Porta et al. 1998;Armour and Cumming 2008), we chose a categorical scale assigning a score to each indicator. Categories are numerical: zero, one, or two. The higher the score, the more lenient the given phenomenon to the borrower. In the case of metric indicators, we determined thresholds based on the frequency and ranking of the data collected from the legislations to obtain the final scores. These thresholds appear based on the length of payment period, benchmark of necessary repayment, length of stigma for a new discharge, court fee, and deposit level.
As there are different numbers of indicators in each dimension, we aggregated the indicators at two levels. On both levels, we applied the linear aggregation as all individual indicators have the same measurement unit, and scores are all expressed on the same interval scale. In this case, compensability is admitted.
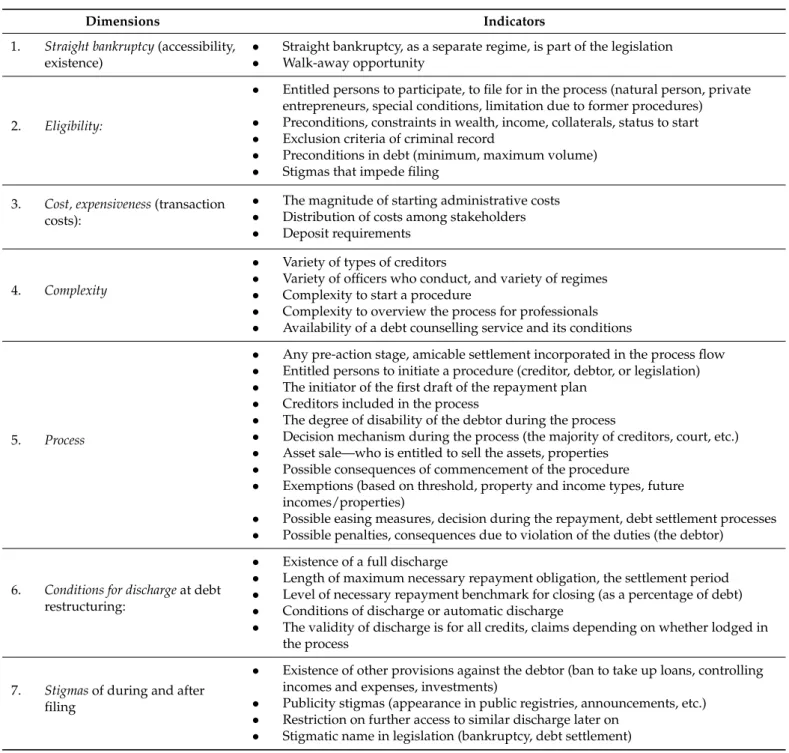
Table 1.Dimensions and indicators.
Dimensions Indicators
1. Straight bankruptcy(accessibility, existence)
• Straight bankruptcy, as a separate regime, is part of the legislation
• Walk-away opportunity
2. Eligibility:
• Entitled persons to participate, to file for in the process (natural person, private entrepreneurs, special conditions, limitation due to former procedures)
• Preconditions, constraints in wealth, income, collaterals, status to start
• Exclusion criteria of criminal record
• Preconditions in debt (minimum, maximum volume)
• Stigmas that impede filing 3. Cost, expensiveness(transaction
costs):
• The magnitude of starting administrative costs
• Distribution of costs among stakeholders
• Deposit requirements
4. Complexity
• Variety of types of creditors
• Variety of officers who conduct, and variety of regimes
• Complexity to start a procedure
• Complexity to overview the process for professionals
• Availability of a debt counselling service and its conditions
5. Process
• Any pre-action stage, amicable settlement incorporated in the process flow
• Entitled persons to initiate a procedure (creditor, debtor, or legislation)
• The initiator of the first draft of the repayment plan
• Creditors included in the process
• The degree of disability of the debtor during the process
• Decision mechanism during the process (the majority of creditors, court, etc.)
• Asset sale—who is entitled to sell the assets, properties
• Possible consequences of commencement of the procedure
• Exemptions (based on threshold, property and income types, future incomes/properties)
• Possible easing measures, decision during the repayment, debt settlement processes
• Possible penalties, consequences due to violation of the duties (the debtor)
6. Conditions for dischargeat debt restructuring:
• Existence of a full discharge
• Length of maximum necessary repayment obligation, the settlement period
• Level of necessary repayment benchmark for closing (as a percentage of debt)
• Conditions of discharge or automatic discharge
• The validity of discharge is for all credits, claims depending on whether lodged in the process
7. Stigmasof during and after filing
• Existence of other provisions against the debtor (ban to take up loans, controlling incomes and expenses, investments)
• Publicity stigmas (appearance in public registries, announcements, etc.)
• Restriction on further access to similar discharge later on
• Stigmatic name in legislation (bankruptcy, debt settlement)
As most composite indices (OECD 2008, p. 31), we used equal weights (EW) with linear aggregation for different numbers of indicators within one dimension; we considered all the selected indicators of a dimension equally important to characterise each specific dimension. This is consistent with the quantitative research ofLa Porta et al. (1998), who also used linear weighted average in creating indicators to compare legal systems of countries.
However, it is disputable as to which dimension is more important to characterise the overall leniency. Therefore, we applied a budget allocation process (BAP) with experts and used linear aggregation to calculate the composite index from seven main dimensions. The advantage of BAP is that it is transparent, straightforward, and “proper weights are based here by expert opinion that could better reflect policy priorities” (OECD 2008, p. 31). The prerequisites of applying the method referred to in the literature—less than 10 dimensions
Risks2021,9, 162 8 of 20
and a diversified expert panel of more than 10 members—are met (Greco et al. 2019;Zhou et al. 2012;OECD 2008). We selected a panel of 16 experts to estimate weights with different professional backgrounds (academics, practitioners, lawyers, economists) from 15 different EU countries.
We asked about their judgments of the relative importance of the respective indicator groups (dimensions). Finally, we calculated the average of the weights given by the experts.
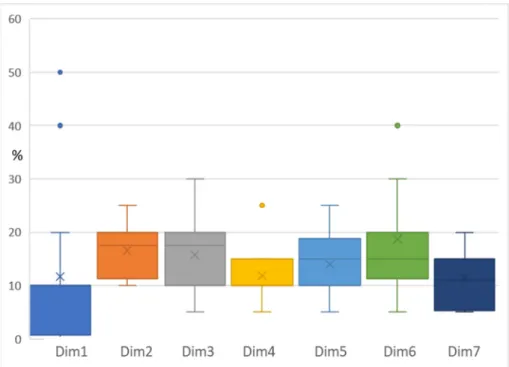
These average weights of the main dimensions were used for the calculation of the final composite indices for all the countries. The weights (and how they differ from a potential EW aggregation) and the main descriptive statistics of the BAP are given in Table2and Figure1.
Table 2.BAP Weights vs. EW weights and their statistics.
Equal Weights BAP Weights
Dim1: Straight bankruptcy 14.3% 11.7%
Dim2: Eligibility criteria 14.3% 16.6%
Dim3: Cost 14.3% 15.8%
Dim4: Complexity 14.3% 11.9%
Dim5: Process 14.3% 13.9%
Dim6: Conditions for discharge 14.3% 18.8%
Dim7: Stigmas 14.3% 11.4%
Note to Table1. Three dimensions—condition of discharge, eligibility, and costs—were found to be dominant in the evaluation of the expert panel. These dimension scores become dominant in the final composite index scores.
Risks 2021, 9, x FOR PEER REVIEW 8 of 21
However, it is disputable as to which dimension is more important to characterise the overall leniency. Therefore, we applied a budget allocation process (BAP) with experts and used linear aggregation to calculate the composite index from seven main dimen- sions. The advantage of BAP is that it is transparent, straightforward, and “proper weights are based here by expert opinion that could better reflect policy priorities” (OECD 2008, p. 31). The prerequisites of applying the method referred to in the literature—less than 10 dimensions and a diversified expert panel of more than 10 members—are met (Greco et al. 2019; Zhou et al. 2012; OECD 2008). We selected a panel of 16 experts to estimate weights with different professional backgrounds (academics, practitioners, lawyers, econ- omists) from 15 different EU countries.
We asked about their judgments of the relative importance of the respective indicator groups (dimensions). Finally, we calculated the average of the weights given by the ex- perts. These average weights of the main dimensions were used for the calculation of the final composite indices for all the countries. The weights (and how they differ from a po- tential EW aggregation) and the main descriptive statistics of the BAP are given in Table 2 and Figure 1.
Table 2. BAP Weights vs. EW weights and their statistics.
Equal Weights BAP Weights
Dim1: Straight bankruptcy 14.3% 11.7%
Dim2: Eligibility criteria 14.3% 16.6%
Dim3: Cost 14.3% 15.8%
Dim4: Complexity 14.3% 11.9%
Dim5: Process 14.3% 13.9%
Dim6: Conditions for discharge 14.3% 18.8%
Dim7: Stigmas 14.3% 11.4%
Note to Table 1. Three dimensions—condition of discharge, eligibility, and costs—were found to be dominant in the eval- uation of the expert panel. These dimension scores become dominant in the final composite index scores.
Figure 1. BAP Weights and EW weights statistics. Note to Figure 1. Opinions on whether straight bankruptcy is an important element of leniency were very heterogenous (Dim1), resulting in an average weight of 12%. The least important dimension is stigma (Dim7) with less volatility.
Figure 1.BAP Weights and EW weights statistics. Note to Figure1. Opinions on whether straight bankruptcy is an important element of leniency were very heterogenous (Dim1), resulting in an average weight of 12%. The least important dimension is stigma (Dim7) with less volatility.
Based on the expert opinions, three dimensions were found to be dominant in the evaluation: eligibility, costs, and the condition of discharge. It is worth mentioning that the opinions on whether straight bankruptcy is an important element of leniency were very heterogenous, while eligibility to straight bankruptcy was the focus of the well-known conservative BAPCPA reform.
4. Results and Discussion
We performed a cross-sectional analysis focusing on the year of 2020, when the database is fully available for each country. We analysed the actual legislative environment in force in the countries in the year 2020, although we also considered a longer period from the first legislation considered (1979 (US)–2020) to better understand the structure of the system due to the occasional main reforms.
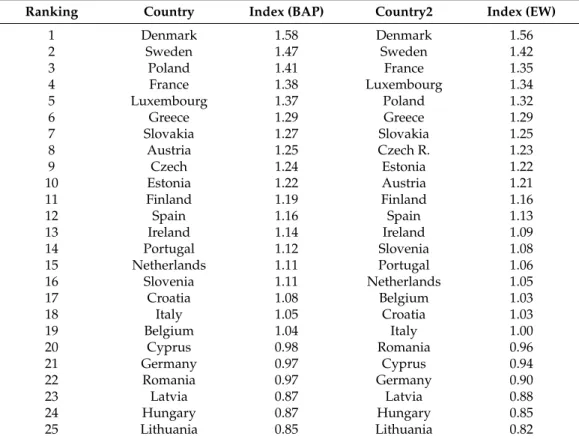
We scored the 35 indicators for the 25 countries, which were validated by 19 experts.2 After aggregating the scores, we calculated country indices, which can theoretically range from 0 to 2, and ranked the countries (Table3), creating a leniency map of Europe (Figure2).
We also compared the BAP aggregation results with an EW aggregation of the dimensions.
As a result, country indices range from 0.8 to 1.6. The benchmark index of the US legislation is 1.37, placing the US among the top five countries in the ranking. There are no significant changes in the ranking if we use EW instead of BAP.
Table 3.Leniency ranking of countries based on BAP and EW aggregation.
Ranking Country Index (BAP) Country2 Index (EW)
1 Denmark 1.58 Denmark 1.56
2 Sweden 1.47 Sweden 1.42
3 Poland 1.41 France 1.35
4 France 1.38 Luxembourg 1.34
5 Luxembourg 1.37 Poland 1.32
6 Greece 1.29 Greece 1.29
7 Slovakia 1.27 Slovakia 1.25
8 Austria 1.25 Czech R. 1.23
9 Czech 1.24 Estonia 1.22
10 Estonia 1.22 Austria 1.21
11 Finland 1.19 Finland 1.16
12 Spain 1.16 Spain 1.13
13 Ireland 1.14 Ireland 1.09
14 Portugal 1.12 Slovenia 1.08
15 Netherlands 1.11 Portugal 1.06
16 Slovenia 1.11 Netherlands 1.05
17 Croatia 1.08 Belgium 1.03
18 Italy 1.05 Croatia 1.03
19 Belgium 1.04 Italy 1.00
20 Cyprus 0.98 Romania 0.96
21 Germany 0.97 Cyprus 0.94
22 Romania 0.97 Germany 0.90
23 Latvia 0.87 Latvia 0.88
24 Hungary 0.87 Hungary 0.85
25 Lithuania 0.85 Lithuania 0.82
Note to Table3. Scores range theoretically from 0 to 2, from less to more lenient. The benchmark index of the United States is 1.37. No significant changes can be detected in the ranking if we use EW instead of BAP.
Table4presents the dimension scores of the countries that signed their relative devi- ation to the mean with colour. It shows that countries ranked as least lenient reach high scores in some dimensions. We expected the US Bankruptcy Code to be at the top; however, as can be seen, in some aspects (‘cost’ and ‘stigma’), it is less lenient than the average of the EU, although it offers the institution of the straight bankruptcy. The correlation matrix of the dimensions shows no strong correlations among the dimensions; the correlation coefficients range from−0.1 to 0.4, and except for one, the correlations are not significant.3
Risks2021,9, 162 10 of 20
Risks 2021, 9, x FOR PEER REVIEW 10 of 21
Figure 2. Leniency map of the EU. Created by ©2021 TomTom GeoNames. Note to Figure 2. The deeper the colour of the county on the map, the more lenient the country’s system is.
Table 4 presents the dimension scores of the countries that signed their relative devi- ation to the mean with colour. It shows that countries ranked as least lenient reach high scores in some dimensions. We expected the US Bankruptcy Code to be at the top; how- ever, as can be seen, in some aspects (‘cost’ and ‘stigma’), it is less lenient than the average of the EU, although it offers the institution of the straight bankruptcy. The correlation matrix of the dimensions shows no strong correlations among the dimensions; the corre- lation coefficients range from −0.1 to 0.4, and except for one, the correlations are not sig- nificant.3
Table 4. The dimension scores and final leniency index with BAP aggregation.
SB_DIM EL_DIM CO_DIM CX_DIM PR_DIM DC_DIM ST_DIM Leniency Index
Denmark 1 1.40 2.00 1.60 1.82 1.60 1.50 1.58
Sweden 0 1.80 2.00 1.40 1.36 1.60 1.75 1.47
Poland 1 1.40 2.00 0.80 1.55 2.00 0.50 1.41
France 0.5 1.60 2.00 1.40 1.73 1.00 1.25 1.38
Luxembourg 0 1.60 2.00 1.40 1.45 1.20 1.75 1.37
Greece 2 1.80 0.33 1.00 1.27 1.60 1.00 1.29
Slovakia 1 1.60 1.67 1.00 1.45 1.00 1.25 1.27
Austria 1 1.20 1.33 1.00 1.36 1.60 1.00 1.25
Czech R. 1 1.20 1.00 2.00 1.27 1.40 0.75 1.24
Estonia 1 1.40 0.33 1.80 1.64 1.40 1.00 1.22
Finland 0 0.40 1.67 1.80 1.18 1.80 1.25 1.19
Spain 1 1.40 1.67 1.00 1.36 1.00 0.50 1.16
Ireland 1 1.60 0.67 0.60 1.18 1.60 1.00 1.14
Figure 2.Leniency map of the EU. Created by ©2021 TomTom GeoNames. Note to Figure2. The deeper the colour of the county on the map, the more lenient the country’s system is.
Table 4.The dimension scores and final leniency index with BAP aggregation.
SB_DIM EL_DIM CO_DIM CX_DIM PR_DIM DC_DIM ST_DIM Leniency Index
Denmark 1 1.40 2.00 1.60 1.82 1.60 1.50 1.58
Sweden 0 1.80 2.00 1.40 1.36 1.60 1.75 1.47
Poland 1 1.40 2.00 0.80 1.55 2.00 0.50 1.41
France 0.5 1.60 2.00 1.40 1.73 1.00 1.25 1.38
Luxembourg 0 1.60 2.00 1.40 1.45 1.20 1.75 1.37
Greece 2 1.80 0.33 1.00 1.27 1.60 1.00 1.29
Slovakia 1 1.60 1.67 1.00 1.45 1.00 1.25 1.27
Austria 1 1.20 1.33 1.00 1.36 1.60 1.00 1.25
Czech R. 1 1.20 1.00 2.00 1.27 1.40 0.75 1.24
Estonia 1 1.40 0.33 1.80 1.64 1.40 1.00 1.22
Finland 0 0.40 1.67 1.80 1.18 1.80 1.25 1.19
Spain 1 1.40 1.67 1.00 1.36 1.00 0.50 1.16
Ireland 1 1.60 0.67 0.60 1.18 1.60 1.00 1.14
Portugal 0 1.20 1.67 1.00 1.18 1.40 1.00 1.12
Netherlands 0 0.80 1.33 1.60 1.09 1.80 0.75 1.11
Slovenia 0.5 1.40 0.33 1.80 1.18 1.60 0.75 1.11
Croatia 0.5 1.20 1.33 1.00 1.45 1.25 0.50 1.08
Table 4.Cont.
SB_DIM EL_DIM CO_DIM CX_DIM PR_DIM DC_DIM ST_DIM Leniency Index
Italy 0 1.80 0.67 0.80 1.45 1.25 1.00 1.05
Belgium 1 0.20 1.67 0.67 1.09 1.40 1.25 1.04
Cyprus 0.5 1.25 0.67 1.00 0.91 1.50 0.75 0.98
Germany 0 1.80 0.67 0.60 1.09 1.40 0.75 0.97
Romania 0.5 0.60 1.67 0.67 1.45 0.80 1.00 0.97
Latvia 0 0.40 0.33 2.00 1.45 1.20 0.75 0.87
Hungary 0 0.40 1.67 1.00 1.32 0.80 0.75 0.87
Lithuania 0 0.60 0.67 0.80 1.27 1.40 1.00 0.85
US 2.00 1.60 0.67 1.40 1.82 1.40 0.75 1.37
Note to Table4. Green scores represent leniency-dimension-score above, red scores represent below-the-mean of the given dimension.
Codes: SB = straight bankruptcy; EL = eligibility; CO = cost; CX = complexity; PR = process; DC = discharge; ST = stigma.
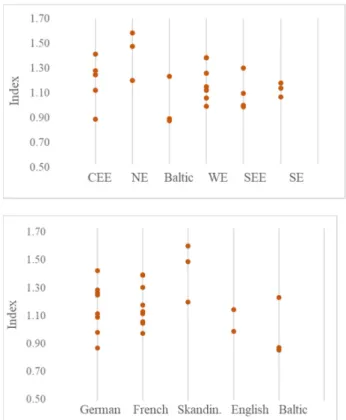
Grouping the index scores based on the regional position of the country (Figure3), we see that no homogeneity is visible due to the extreme scores of some countries. In the
‘younger’ region of CEE, some are positioned out of the main group. This means that countries that typically launched their systems earlier and made reforms in a more lenient direction ever since (such as Poland in 2009 and Slovakia in 2017) have higher scores, and the recently launched systems in Hungary and Romania are less lenient. In South-Eastern Europe, Greece stands far apart from the core group with its more lenient system. In the northern part of Europe, Scandinavia seems to form a different group from the Baltic countries, running a generally more lenient system. Estonia is visibly more lenient than the other Baltic countries. In Western Europe, leniency seems to be very heterogeneous, with index scores ranging from 0.97 to 1.37. On the other hand, the leniency levels in the group of countries of South Europe are closer.
Portugal 0 1.20 1.67 1.00 1.18 1.40 1.00 1.12
Netherlands 0 0.80 1.33 1.60 1.09 1.80 0.75 1.11
Slovenia 0.5 1.40 0.33 1.80 1.18 1.60 0.75 1.11
Croatia 0.5 1.20 1.33 1.00 1.45 1.25 0.50 1.08
Italy 0 1.80 0.67 0.80 1.45 1.25 1.00 1.05
Belgium 1 0.20 1.67 0.67 1.09 1.40 1.25 1.04
Cyprus 0.5 1.25 0.67 1.00 0.91 1.50 0.75 0.98
Germany 0 1.80 0.67 0.60 1.09 1.40 0.75 0.97
Romania 0.5 0.60 1.67 0.67 1.45 0.80 1.00 0.97
Latvia 0 0.40 0.33 2.00 1.45 1.20 0.75 0.87
Hungary 0 0.40 1.67 1.00 1.32 0.80 0.75 0.87
Lithuania 0 0.60 0.67 0.80 1.27 1.40 1.00 0.85
US 2.00 1.60 0.67 1.40 1.82 1.40 0.75 1.37
Note to Table 4. Green scores represent leniency-dimension-score above, red scores represent below-the-mean of the given dimension. Codes: SB = straight bankruptcy; EL = eligibility; CO = cost; CX = complexity; PR = process; DC = discharge; ST
= stigma.
Grouping the index scores based on the regional position of the country (Figure 3), we see that no homogeneity is visible due to the extreme scores of some countries. In the
‘younger’ region of CEE, some are positioned out of the main group. This means that countries that typically launched their systems earlier and made reforms in a more lenient direction ever since (such as Poland in 2009 and Slovakia in 2017) have higher scores, and the recently launched systems in Hungary and Romania are less lenient. In South-Eastern Europe, Greece stands far apart from the core group with its more lenient system. In the northern part of Europe, Scandinavia seems to form a different group from the Baltic countries, running a generally more lenient system. Estonia is visibly more lenient than the other Baltic countries. In Western Europe, leniency seems to be very heterogeneous, with index scores ranging from 0.97 to 1.37. On the other hand, the leniency levels in the group of countries of South Europe are closer.
Figure 3.Index scores grouped by region and by law origin. Note to Figure3. No homogeneity is visible based on the regional position or law origin.
Risks2021,9, 162 12 of 20
We also grouped the index scores based on law origin as a possible explanation for similarities. Figure 3shows that French law origin countries tend to have closer leniency levels. However, other counties with similar law origin backgrounds do not form homogenous groups.
We ran a cluster analysis based on the dimension scores. The hierarchical cluster analysis shows no reasonable clusters with different distance measures. The elbow method confirms that no informative clusters can be determined. Cluster analysis based on three main dimensions (eligibility, expensiveness, discharge) results in more separable clusters.
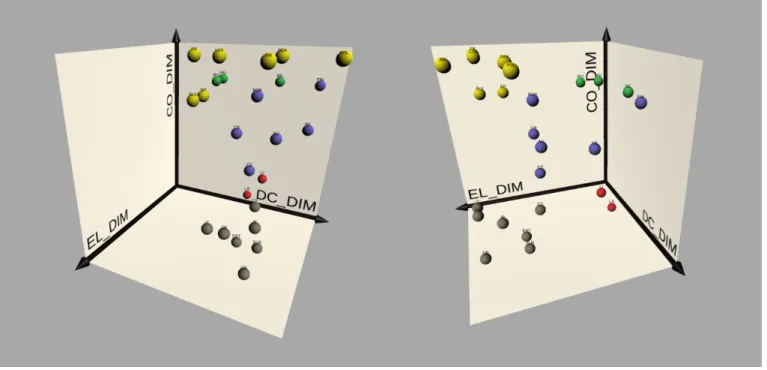
In this case, the elbow analysis suggests three to four, with a maximum of five clusters (AppendixA.3). After calculating the K-Mean clusters for three, four, and five clusters based on the three dimensions (AppendixA.4), it seems that the K-Mean cluster analysis of five clusters is the only one that induces some intuitive explanations (Figure4).
Risks 2021, 9, x FOR PEER REVIEW 12 of 21
Figure 3. Index scores grouped by region and by law origin. Note to Figure 3. No homogeneity is visible based on the regional position or law origin.
We also grouped the index scores based on law origin as a possible explanation for similarities. Figure 3 shows that French law origin countries tend to have closer leniency levels. However, other counties with similar law origin backgrounds do not form homog- enous groups.
We ran a cluster analysis based on the dimension scores. The hierarchical cluster analysis shows no reasonable clusters with different distance measures. The elbow method confirms that no informative clusters can be determined. Cluster analysis based on three main dimensions (eligibility, expensiveness, discharge) results in more separable clusters. In this case, the elbow analysis suggests three to four, with a maximum of five clusters (Appendix A.3). After calculating the K-Mean clusters for three, four, and five clusters based on the three dimensions (Appendix A.4), it seems that the K-Mean cluster analysis of five clusters is the only one that induces some intuitive explanations (Figure 4).
Figure 4. K-mean cluster analysis 3D scatterplot. Note to Figure 4. K-mean cluster analysis for three dimensions (eligibility, cost, discharge): The country-plots with the same colours belong to the same cluster based on the three dimensions of eligibility, cost, and condition of discharge.
Despite some possible intuitive grouping explanations (such as regional similarities in the clusters of Lithuania and Latvia as red plots; Romania and Hungary as green plots, or Austria-Czech R.-Croatia as blue plots), no overall explanation can be made. Generally, these analyses confirm our view that the legislations are very heterogenous from the leni- ency structure point of view, and clear and informative clusters based on the dimensions or final scores cannot be formed.
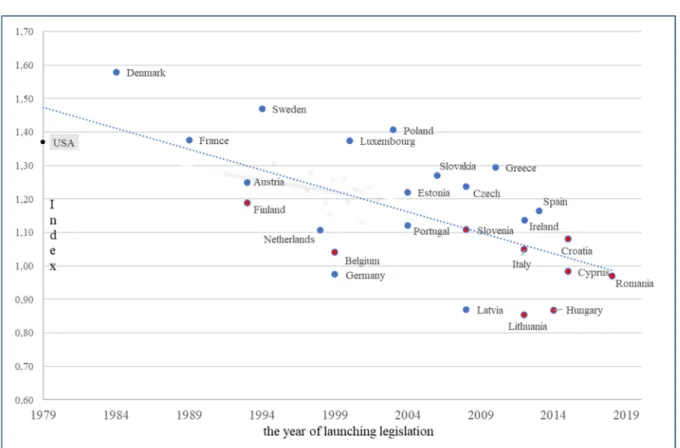
We also analyse the association between the age of the legislation (age indicates the difference between 2020 and the year of launching the first personal bankruptcy legisla- tion in the country) and the leniency level. A visible association can be detected in the scatterplot (Figure 5), which is confirmed by a correlation calculation with a coefficient of 0.67 and high significance. The older the legislation, the more time has passed since its first implementation, the more lenient it is.
We do not analyse all the interim changes in the history of the countries in detail to identify all the leniency shifts since their launch. However, we identify the countries that Figure 4.K-mean cluster analysis 3D scatterplot. Note to Figure4. K-mean cluster analysis for three dimensions (eligibility, cost, discharge): The country-plots with the same colours belong to the same cluster based on the three dimensions of eligibility, cost, and condition of discharge.
Despite some possible intuitive grouping explanations (such as regional similarities in the clusters of Lithuania and Latvia as red plots; Romania and Hungary as green plots, or Austria-Czech R.-Croatia as blue plots), no overall explanation can be made.
Generally, these analyses confirm our view that the legislations are very heterogenous from the leniency structure point of view, and clear and informative clusters based on the dimensions or final scores cannot be formed.
We also analyse the association between the age of the legislation (age indicates the difference between 2020 and the year of launching the first personal bankruptcy legislation in the country) and the leniency level. A visible association can be detected in the scatter- plot (Figure5), which is confirmed by a correlation calculation with a coefficient of 0.67 and high significance. The older the legislation, the more time has passed since its first implementation, the more lenient it is.
We do not analyse all the interim changes in the history of the countries in detail to identify all the leniency shifts since their launch. However, we identify the countries that introduced reforms in the past. Basically, most of them shifted their respective regime to a more lenient system. The exceptions are the US BAPCPA reform of 2005 in the United States, the correction in Greece in 2013, and the changes in the Netherlands in 2008. We marked
Risks2021,9, 162 13 of 20
countries based on if any ‘leniency reform’ was made after launching or no considerable change in the regulation was introduced. In the scatterplot (Figure5), the countries with no significant reform yet (marked with red) are typically in the less lenient region, relative to countries that have already undergone a considerable reform (marked with blue).
introduced reforms in the past. Basically, most of them shifted their respective regime to a more lenient system. The exceptions are the US BAPCPA reform of 2005 in the United States, the correction in Greece in 2013, and the changes in the Netherlands in 2008. We marked countries based on if any ‘leniency reform’ was made after launching or no con- siderable change in the regulation was introduced. In the scatterplot (Figure 5), the coun- tries with no significant reform yet (marked with red) are typically in the less lenient re- gion, relative to countries that have already undergone a considerable reform (marked with blue).
Figure 5. Leniency and the age of legislation. Note to Figure 5. Association between the age of the legislation and the leniency level can be detected. Plots with red are countries where no significant reform was made, while countries marked with blue represent significant modification.
We divide the countries (and, thus, also the timeline) into two parts. The first group includes the more developed Western European (WE) and North European (NE) coun- tries, which typically launched their systems earlier. The second group consists of the late- comers in the CEE, SE, and SEE. We create two scatterplots (Figure 6) for the two groups.
Figure 5.Leniency and the age of legislation. Note to Figure5. Association between the age of the legislation and the leniency level can be detected. Plots with red are countries where no significant reform was made, while countries marked with blue represent significant modification.
We divide the countries (and, thus, also the timeline) into two parts. The first group includes the more developed Western European (WE) and North European (NE) countries, which typically launched their systems earlier. The second group consists of the latecomers in the CEE, SE, and SEE. We create two scatterplots (Figure6) for the two groups.
Figure6also visibly supports the association between leniency and the age of regime in the two separate groups, especially among the CEE-SE-SEE countries.
Our results are consistent with the comparative literature in several aspects. As expected, the leniency level of the US is high relative to the average of EU countries. The US system was the first personal bankruptcy legislation to introduce discharge, belong to the “liberal camp” ofEfrat(2002) and the “market model” cluster ofHeuer(2014), and give the most insurance value to individuals (Jia 2015). The EU countries’ systems, in general, reflect the interest of the policymaking of the financial market and banking sector more (Ramsay 2012). On the other hand, despite our expectations, some European countries have already reached the leniency level of the US due to the major reforms, which shifted the leniency up (see Sweden, Denmark, Poland, France). We must also consider that the BAPCPA reform of 2005 decreased the leniency of the US system, and its leniency level must have been higher at that time. It was likely to be above the current level of the most lenient European regulations and likely to be far above the leniency level of European countries in 2005. This result can also explain why the US reforms were urged before 2005.
Risks2021,9, 162 14 of 20
Risks 2021, 9, x FOR PEER REVIEW 14 of 21
Figure 6. Leniency and the age of legislation in different regions (WE and NE vs. CEE, SE, and SEE).
Note to Figure 6. Association between leniency and the age of regime is especially visible among the CEE-SEE countries that launched their systems later.
Figure 6 also visibly supports the association between leniency and the age of regime in the two separate groups, especially among the CEE-SE-SEE countries.
Our results are consistent with the comparative literature in several aspects. As ex- pected, the leniency level of the US is high relative to the average of EU countries. The US system was the first personal bankruptcy legislation to introduce discharge, belong to the
“liberal camp” of Efrat (2002) and the “market model” cluster of Heuer (2014), and give the most insurance value to individuals (Jia 2015). The EU countries’ systems, in general, reflect the interest of the policymaking of the financial market and banking sector more (Ramsay 2012). On the other hand, despite our expectations, some European countries have already reached the leniency level of the US due to the major reforms, which shifted the leniency up (see Sweden, Denmark, Poland, France). We must also consider that the BAPCPA reform of 2005 decreased the leniency of the US system, and its leniency level Figure 6.Leniency and the age of legislation in different regions (WE and NE vs. CEE, SE, and SEE).
Note to Figure6. Association between leniency and the age of regime is especially visible among the CEE-SEE countries that launched their systems later.
Our results are also consistent with the view that the personal bankruptcy legislation of the EU is very heterogenous among the countries based on the institutional path, ideology, or the interest groups in the economy and society (Ramsay 2012). The lack of heterogeneity can also be seen in papers urging for harmonisation (e.g.,Niemi 2012). The differences in leniency explain why an EU regulation was also implemented (EU n.d.) on insolvency procedures to avoid the so-called ‘forum shopping’, the arbitraging opportunities among different county regulations. However, our calculation contradicts the clustering results of the previous study ofHeuer(2014) as our clusters only partly correspond to the ‘mercy model’ of Scandinavian countries or the ‘liability model’ of Germany and Austria. Denmark and Sweden are ranked on the top and in the same cluster; however, Finland is in a different group, and Austria and Germany do not belong to the same groups either. However, we must also mention that there was a major reform in Austria since that study that modified its leniency. As in other comparative legislation research (La Porta et al. 1998), we can
assume that the law origin is associated with the leniency level. Our results show that French law origin countries tend to have closer leniency levels. However, other counties with similar law-origin backgrounds do not form homogenous groups.
In addition to presenting rankings, comparative description, and showing the hetero- geneity of the systems, one of the most important results is the association between age and leniency. It seems that the older the legislation, the more lenient it becomes. This supports the hypothesis that countries’ personal bankruptcy regulations are usually launched as more creditor-friendly and are later shifted to a more lenient direction. We do not find an explanation or similar conclusions in the literature. We assume that countries’ bankruptcy regulations are usually rather strict at launch, due to fear of potential abuse.
5. Conclusions
A large part of the literature on personal bankruptcy focused on the effects of fresh start and the level of leniency on society, financial markets, entrepreneurship, and labour supply. However, measuring leniency in these papers was limited to one-time legislative changes or a few characteristics such as homestead exemptions. To fill this research gap, we create a compact measure of the leniency, collecting the relevant categories and developing the main dimensions based on former studies of the comparative literature in this field.
These dimensions prove to be independent and, after aggregation, could be used to rank countries, identify differences, set a basis for analysing the differences across countries, and measure changes in the legislation. The composite index enables researchers and policymakers to accomplish comparative analyses and to identify the effect of differences and changes in the legislation on the economic factors in a more complex way than formerly discussed in the literature.
In the second part of the research, we use this composite index framework to measure, rank, and compare the leniency of the EU countries’ legislations and the US regime as a benchmark. Fulfilling this additional research gap and focusing only on all countries in the EU, we systematically assess all the countries by scoring the categories, and we finally aggregate the scores applying the elaborated methodology. Based on the index scores, we rank the countries and identify the more and less lenient regimes. By analysing scores based on region, law origin, and cluster analysis, we conclude that systems inside the EU are very heterogenous and no real clusters with intuitive explanation can be detected.
Though heterogeneity was expected to some extent based on the literature, we note that neither the law origin nor regionality supports any strong association with leniency, which contradicts former studies and assumptions, and it shows higher diversity than expected.
Our scores and ranking correspond to the literature concerning that the US system is regarded as traditionally very lenient; however, it contradicts our expectation in the sense that some of the European countries seem to reach or even exceed this level due to the major reforms (debtor-friendly in the EU, restrictive in the US) implemented in the last 10–20 years.
On the other hand, it is an important novelty of our research that there is a strong association between leniency level and the legislation age. Charts and correlations support the hypothesis that the older a legislation, the more lenient it is. We assume that countries’
bankruptcy regulations are usually rather strict at launch and are later shifted to a more lenient direction. This result raises the need for further research to understand the political, economic background or possible causality.
As regards the limitation of our research, it is a cross-sectional analysis and shows the leniency level of the countries based on the regulation valid in these countries in 2020.
When new major reforms are implemented, our results and conclusions could change;
therefore, continuous monitoring and updates in the scoring and calculations are necessary.
Furthermore, our study focuses only on the EU. Some European countries that virtually play an important role in Europe (e.g., Great Britain, Switzerland, Norway, or Russia) are not in the scope. Finally, the scoring is sensitive to the interpretation of the wide variety, hardly comparable legislative formulations, the different legal structures, the possible