Dynamic classification using case-specific training cohorts outperforms static gene expression signatures in breast cancer
Balazs Gy}orffy1,2,3, Thomas Karn4, Zsofia Sztupinszki1, Boglarka Weltz3, Volkmar M€uller5and Lajos Pusztai6
1MTA TTK Lend€ulet Cancer Biomarker Research Group, Budapest, Hungary
22nd Department of Pediatrics, Semmelweis University Budapest, 1094 Budapest, T}uzolto utca 7-9, Hungary
3MTA-SE Pediatrics and Nephrology Research Group, Bokay u. 53, H-1083, Budapest, Hungary
4Department of Obstetrics and Gynecology, J. W. Goethe-University, Frankfurt, Germany
5Department of Gynecology, University Medical Center, Martinistrasse 52, 20246 Hamburg, Germany
6Yale Cancer Center Genomics Program, Yale Cancer Center, Yale School of Medicine, New Haven, CT, USA
The molecular diversity of breast cancer makes it impossible to identify prognostic markers that are applicable to all breast cancers. To overcome limitations of previous multigene prognostic classifiers, we propose a new dynamic predictor: instead of using a single universal training cohort and an identical list of informative genes to predict the prognosis of new cases, a case-specific predictor is developed for each test case. Gene expression data from 3,534 breast cancers with clinical annota- tion including relapse-free survival is analyzed. For each test case, we select a case-specific training subset including only molecularly similar cases and a case-specific predictor is generated. This method yields different training sets and different predictors for each new patient. The model performance was assessed in leave-one-out validation and also in 325 independ- ent cases. Prognostic discrimination was high for all cases (n53,534, HR53.68,p51.67E256). The dynamic predictor showed higher overall accuracy (0.68) than genomic surrogates for Oncotype DX (0.64), Genomic Grade Index (0.61) or Mam- maPrint (0.47). The dynamic predictor was also effective in triple-negative cancers (n5427, HR53.08,p50.0093) where the above classifiers all failed. Validation in independent patients yielded similar classification power (HR53.57). The dynamic classifier is available online at http://www.recurrenceonline.com/?q5Re_training. In summary, we developed a new method to make personalized prognostic prediction using case-specific training cohorts. The dynamic predictors outperform static mod- els developed from single historical training cohorts and they also predict well in triple-negative cancers.
In the last decade, numerous multigene prognostic tests have been developed for breast cancer.1–4 All of these assays were developed from relatively small training sets and the informa- tive genes were selected from molecularly heterogeneous can- cers. For example, the 70 genes included in MammaPrint were defined from a mixed cohort of 78 estrogen receptor
(ER)-positive and -negative cases.4 The 21 genes in Oncoty- peDX were derived from 233 ER positive, lymph node nega- tive patients and the 97 genes of the Genomic Grade Index (GGI) were selected from 64 ER positive tumors.3 Although the prognostic performance of these assays has been validated in independent cases, their predictive performance may not be optimal due to the small and heterogeneous training sets that were used for assay discovery.5–7
Twenty years after the development of the first gene expres- sion arrays, several thousands of gene expression profiles with clinical annotation are now available for breast and other can- cers.8,9We hypothesize that by using much larger and molecu- larly more homogeneous training sets it should be possible to improve the accuracy of multi-gene prognostic signatures. To maximize the representativeness of the training cohort for the actual test case, we select the molecularly most similar cases from a large training case pool of >3,500 cases. We use this case- matched training cohort to develop a unique, case-specific pre- dictor which is applied to the test case. This method defines a new training sub-cohort for each new case and selects a new set of informative genes. This dynamic classification process is con- ceptually similar to leave-one-out cross validation, except that predictors are not built from the entire training cohort but only from a subset with the greatest similarity to the test case. For case-specific training set selection, we did not use clinical
Cancer Genetics
Key words:breast cancer, gene expression, survival
Additional Supporting Information may be found in the online version of this article.
This is an open access article under the terms of the Creative Commons Attribution-NonCommercial-NoDerivs License, which permits use and distribution in any medium, provided the original work is properly cited, the use is non-commercial and no modifications or adaptations are made.
Grant sponsor:OTKA K108655;Grant sponsor:Predict project;
Grant number:259303 of the EU Health.2010.2.4.1.-8 call;Grant sponsor:Breast Cancer Research Foundation, New York DOI:10.1002/ijc.29247
History:Received 1 May 2014; Accepted 25 Sep 2014; Online 1 Oct 2014
Correspondence to:Balazs Gy}orffy MD, PhD, MTA TTK Lend€ulet Cancer Biomarker Research Group, Magyar tudosok k€orutja 2., H-1117, Budapest, Hungary, Tel.:1[36305142822], E-mail:
gyorffy.balazs@ttk.mta.hu
Cancer Genetics
International Journal of Cancer
information such as clinical stage or nodal status because the clinical variables have no strong molecular signatures associated with them and appear to be independent of molecular variables when predicting relapse-free survival.
We compared the predictive performance of the dynamic classifier to three commonly used static predictors including genomic surrogates of the 21-gene Oncotype DX recurrence score, the 70-gene MammaPrint prognostic signature and the 97-gene GGI. We also built an internet-based dynamic prog- nostic classification tool that could be used to classify new cases and independently validate our method.
Material and Methods Database construction
In order to establish the largest possible pool of potential training cases for predictor building, we assembled all breast cancer gene expression datasets published in GEO (http://www.ncbi.nlm.nih.
gov/geo/) that had clinical annotation and were generated using the HG-U133_A and HG-U133_Plus_2.0 arrays. We identified a total of 6,197 cases in 25 datasets. We have performed a quality check for all arrays as described previously.10We removed dupli- cate samples (n51,418)—when multiple GEO entries for the same case existed we retained the first published copy of an array.11The raw .CEL files were MAS5 normalized in R (http://
www.r-project.org) using the affy library.12 MAS5 was used because it performed among the best normalization methods compared to RT-PCR measurements in our previous study.13 For predictor building only probe sets that were measured by both Affymetrix arrays (n522,277) were used. We also per- formed a second scaling normalization to set the average expres- sion of each array to 1,000 to reduce batch effects [the value of 1,000 was chosen as this is close to the average of the mean expression using factory-default normalization settings for HG- U133_A (700) and HG-U133_Plus_2.0 arrays (1,400)]. Only probe sets with a maximal expression value of over 1,000 in at least one sample were retained for predictor building. For genes targeted by multiple probe sets only the JetSet best probe set14 was used. The final number of probe sets/genes included in the training database pool for each case wasn59,886.
Selection of case-specific training subset and molecular classification
To select samples for model building (training subset), we identified cases that were most similar to the test case by
computing Euclidean distance with the “dist” function in R to yield a global similarity matrix using the gene expression data for all genes. This distance is computed between the test case and each of the samples in the database. We ranked cases by this similarity metric and to study the effect of train- ing set size on predictor performance we built predictors from the top 100/200/300/400/500 cases most similar to the test case.
Informative genes were selected for predictor model build- ing by performing a univariate Kaplan–Meier survival analy- sis for relapse-free survival for each gene using the median expression values as cutoff.15 Multivariate analysis was not performed at this stage due to many missing values of clini- cally important variables (grade, nodal status, etc.). Genes were ranked by p value and hazard ratio and the average expression of the top 3/5/10/25/50/100/200 genes were used to make a prognostic prediction. Since some genes correlate positively with survival and have higher expression values in the good prognosis group while others show the opposite relationship, for each gene the difference to the median in the training set is used. In case the hazard ratio is <1, the expression value is inverted to a negative value.
Finally, the average expression of the informative genes in the test case is compared to the median of the average expression of these genes in the training set (“molecular clas- sification”). The test case is predicted to have good prognosis if the average expression of the informative genes is in the expression range of the training cohort that has the better outcome. (For example, in case patients in the training set having expression range above the median have a better prognosis, and the average expression of the informative genes in the investigated patient is also above the median, then this patient is designated as one with good prognosis.)
Adjustment for clinical risk
Since selection of the training set cases is driven by molecular similarities to the test case, the resulting training cohort could have unbalanced clinical features that could skew over- all prognostic prediction. For example, if the training cohort includes a large number of cases with poor clinical risk fea- tures (mostly node-positive, high grade, large cancers), the prognostic risk prediction based on molecular features alone may be erroneous when designating the sample into the good-prognosis cohort.
What’s new?
A large number of molecular variations are associated with breast cancer, which has inspired the development of a variety of multigene prognostic tests. However, because those tests are based on small, heterogenous data sets, with the intention of being applicable across breast cancers, their predictive performance is limited. This study describes a dynamic, case-specific approach for prognostic predictor discovery that is based on large, homogenous training sets of data. Training sets were selected for their molecular similarity to test cases. Prognostic accuracy was higher for the dynamic approach than for the genomic surrogates of common multigene assays.
Cancer Genetics
For this reason, the training set is compared to all the remaining patients. In this, the entire training set represents one cohort and the remaining patients represent another cohort and these are compared using a Cox regression analy- sis. There are three possible outcomes: the two cohorts do not differ significantly, and the training set can have better or poorer survival than the remaining patients. The result of this analysis termed “training set assessment” is used in the final prognostic classification to adjust the molecular risk that is based on molecular features alone.
Final classification rule
The final classification rule takes into account both the risk assignment from the “training set assessment” and the output from the “molecular classification.” When both predictors are concordant and assign good or poor prognosis, the decision rule follows the concordant vote. When the “molecular classi- fication” is not significant (in other words there are no signif- icant genes capable to define good and poor prognosis in the training set) or when the clinical prediction contradicts the molecular prediction the final output is “intermediate.”
To measure the performance of the dynamic classifier, we performed a leave-one out cross validation (LOOCV) for each sample (i.e., one case held out and the training subset selected from the remainingn21 samples). Statistical signifi- cance was set atp<0.01.
Construction of online interface
We made the entire analysis possible in an online accessible software. In this, all computations are performed on a Debian linux (http://www.debian.org) central server running an Apache webserver, a (D)COM server and a background R server. After the upload of an unprocessed Affymetrix HGU133A or HGU133plus2 microarray .CEL file, the proc- essing is performed in the R environment. The packages
“affy” and “survival” are used for normalization and for
drawing Kaplan–Meier plots, respectively. The homepage was set up using the open source Drupal content management system (http://www.drupal.org). The entire computational process is performed real time and the result is provided at the end of the analysis as a Kaplan–Meier survival plot show- ing the estimated survival.
Computation of static predictors
We compared the overall performance of our dynamic pre- dictors to genomic surrogates of three commonly used static predictors, the 21-gene recurrence score, the 70-gene Mam- maprint signature classifier and the 97-gene GGI. For com- puting the recurrence score, we used our previously published technique.10 The GGI and the 70-gene classifica- tions were computed using the “genefu” Bioconductor pack- age (http://www.bioconductor.org, http://compbio.dfci.harvard.
edu) using the default parameters. The complete analysis results including individual predictions for each patient are available in Supporting Information Table 1. The performance of the classifiers was assessed by computing Cox regression and plotting a Kaplan–Meier plot for each classification algo- rithm separately.
To compare classification performance in terms of sensi- tivity, specificity and accuracy, we computed sensitivity5TP/
(TP1FN) where TP5number of true positives (samples designated as bad prognosis that actually have relapsed within 5 years), and FN5number of false negatives (samples designated as good prognosis that actually have relapsed);
specificity5TN/(TN1FP) where TN5number of true neg- atives (samples designated as good prognosis that had no recurrence) and FP5number of false positives (samples des- ignated as bad prognosis that had no relapse) and accura- cy5(TP1TN)/(TP1FN1TN1FP). In this analysis, patients designated as “intermediate” by the re-training approach were not included in the analysis for the 70-gene and the 97-gene signature. The 21-gene classifier was
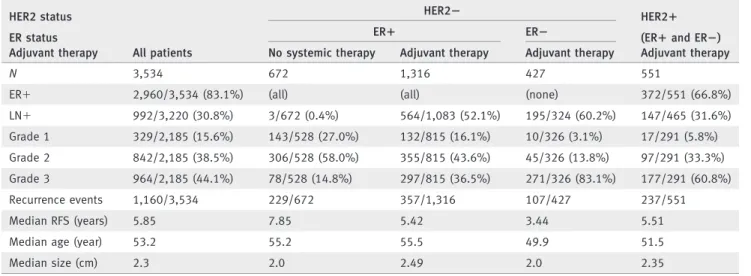
Table 1.Clinical characteristics of patients included in the pooled datasets HER2 status
All patients
HER22 HER21
ER status ER1 ER2 (ER1and ER2)
Adjuvant therapy No systemic therapy Adjuvant therapy Adjuvant therapy Adjuvant therapy
N 3,534 672 1,316 427 551
ER1 2,960/3,534 (83.1%) (all) (all) (none) 372/551 (66.8%)
LN1 992/3,220 (30.8%) 3/672 (0.4%) 564/1,083 (52.1%) 195/324 (60.2%) 147/465 (31.6%)
Grade 1 329/2,185 (15.6%) 143/528 (27.0%) 132/815 (16.1%) 10/326 (3.1%) 17/291 (5.8%) Grade 2 842/2,185 (38.5%) 306/528 (58.0%) 355/815 (43.6%) 45/326 (13.8%) 97/291 (33.3%) Grade 3 964/2,185 (44.1%) 78/528 (14.8%) 297/815 (36.5%) 271/326 (83.1%) 177/291 (60.8%)
Recurrence events 1,160/3,534 229/672 357/1,316 107/427 237/551
Median RFS (years) 5.85 7.85 5.42 3.44 5.51
Median age (year) 53.2 55.2 55.5 49.9 51.5
Median size (cm) 2.3 2.0 2.49 2.0 2.35
ER5estrogen receptor, RFS5recurrence free survival.
Cancer Genetics
computed using all patients because it also has an
“intermediate” cohort and therefore is more similar to the re- training approach in this context. In the analysis, the predic- tive power of relapse up to 5 years was compared. Patients censored before 5 years were excluded (final n52,801). The cutoff of 5 years was selected as it was used in previous stud- ies, and is also the default length for hormonal therapy.
Finally, positive and negative predictive values and confi- dence intervals were computed as described previously.16,17
Independent validation samples
We collected 325 independent validation samples of early stage breast cancers at the Departments of Gynecology and Obstetrics at the University Hospitals in Frankfurt and Ham- burg, Germany. All patients participated in an IRB approved study and signed informed consent for biomarker analysis.
They represent consecutive patients undergoing surgical resection up to July 2007.
Isolation of RNA and expression profiling using Affyme- trix Human Genome U133A microarrays was performed according to the manufacturer’s protocols. Affymetrix CEL files and clinical data have been deposited in the GEO data- base under the accession numbers GSE4611 (Frankfurt data- set) and GSE46184 (Hamburg dataset). The validation using these samples was performed after the re-training algorithm was completed and the online classification tool was finalized.
Results
Establishment of a master database and classification tool The number of unique cases with relapse-free survival included in our master database was n53,534 from the fol- lowing datasets: GSE1456, GSE4922, GSE5327, GSE6532,
GSE7390, GSE9195, GSE11121, GSE12093, GSE12276, GSE2034, GSE16391, GSE16446, GSE17705, GSE17907, GSE19615, GSE2603, GSE20685, GSE20711, GSE21653, GSE25066, GSE2990, GSE31519 and GSE3494 (clinical char- acteristics for these patients are summarized in Table 1). We must note that the definitions for relapse-free survival were slightly different in the original datasets. The exact length of the survival time (e.g., from beginning like diagnosis or ther- apy to the end like local, regional or distant metastasis) were not published in most of the datasets and therefore we merged any type of earliest progression of the disease into relapse-free survival.
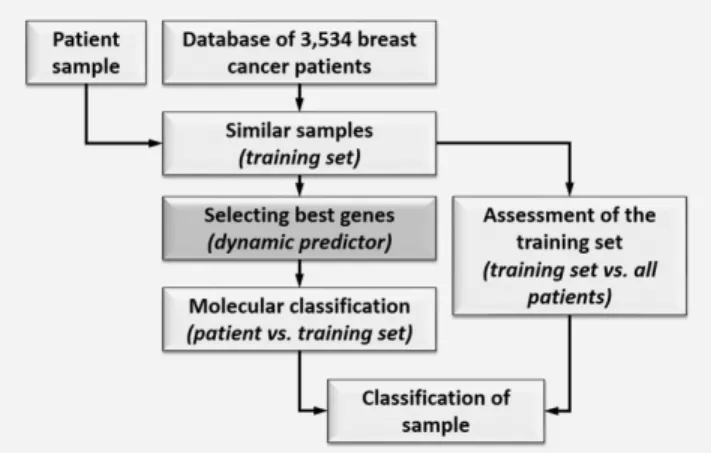
Using these patient samples, two independent classifica- tions are executed as described in the Material and Methods section (summarized in Fig. 1). The predictor performance increased using a larger training set size up to 400 (p50.0005), but it significantly deteriorated when sample size was extended to 500 cases (p50.024). Because of this deterioration in performance and because of the substantially increasing computational time when including>500 patients in the training set we have not tested larger training set sizes.
We have also assessed the effect of informative gene set sizes of 3/5/10/25/50/100/200. Although the difference between these was not significant, the nominally best classification was be achieved by using 25 genes. The Kaplan–Meier sur- vival plot for the predictor using case-specific training set of 400 patients with top 25 most informative genes calculated over all cases is presented in Figure 2.
To enable the classification of new samples by any user we also established an online interface. The homepage can be accessed at http://www.recurrenceonline.com/?q5Re_training.
Comparison of the dynamic predictor to previously published static classifiers
We applied commonly used genomic surrogates of the 21- gene recurrence score, the 70-gene prognostic signature and the 97-gene GGI to our entire data set (Fig. 2). Individual prediction results are available in Supporting Information Table 1. For all patients, the dynamic prediction method yielded the highest hazard ratio (HR53.68) followed by the 70-gene classifier (HR53.40), the 21-gene recurrence score (HR52.55) and the 97-gene GGI (HR52.24).
For ER negative/HER2 negative patients, the dynamic pre- dictor achieved significant discriminating power (HR53.08, p50.009) only. Similarly, in HER2 positive patients (includ- ing both ER positive and negative cases), the dynamic classi- fication method (HR52.99, p54.8 E207) was capable to achieve significance only (Fig. 2).
We also assessed the sensitivity, specificity and accuracy of each method for predicting relapse-free survival at five years. The highest sensitivity was achieved by the 70-gene signature (0.98) but it had the lowest specificity (0.14). The dynamic predictor had sensitivity of 0.84. The highest speci- ficity (0.58) and overall accuracy (0.68) were achieved by the dynamic predictor (Table 2(A)). When comparing the actual
Figure 1.Dynamic predictor development process. A large data- base is used to select a subset of training cases that are molecu- larly the most similar to the test case. This training subset is used to identify predictive features and to develop the test-case specific predictor (“molecular classification”). The training set is compared to the remaining samples (“training set assessment”) and the final classification takes into account both the “molecular classi- fication” and the “training set assessment” results.
Cancer Genetics
concordance of predictions between the dynamic predictor and the other classifiers, the highest overlap was observed with the 21-gene score (55%) (Table 2(B)).
Finally, we evaluated the static classifiers by using the dynamic re-training results as a filter in which we excluded samples where the clinical and molecular classifiers were con- tradictory (intermediate cases). In this setting, the prediction power for each of the static classifiers increased (21-gene score: HR52.87; 97-gene GGI: HR52.52; 70-gene classifier:
HR54.27).
The most consistently strongly prognostic genes
To identify the genes with the highest predictive potential, the prevalence of all genes included in the top 25 list from all LOOCV analyses was counted. In the 3,534 runs (one for each case), 5,038 distinct genes were associated with progno- sis in at least one case and only 72 genes were present in more than 5% of classification signatures. Of these strongest genes, one is also present in the 21-gene signature (MYBL2), four are present in the 70-gene signature (CCNE2, CENPA, MCM6, PRC1) and 21 are also present in the 97-gene
Figure 2.Relapse-free survival curves for the dynamic classifier computed using the top 25 genes and a training set size of 400 samples and genomic surrogates of three commercially available prognostic signatures applied to the same 3,534 cases. [Color figure can be viewed in the online issue, which is available at wileyonlinelibrary.com.]
Cancer Genetics
signature including MYBL2, CCNE2, CENPA and PRC1. All of these survival associated genes are included in Supporting Information Table 2.
Validation in independent clinical samples
Three hundred and twenty-five cases which are not included in the pooled public data database were used for independent validation of the method. We had relapse-free survival data for each patient. The average follow-up was 66 months, with 97 events; 81.1% (n5206) of samples were ER positive;
39.4% (n5128) were lymph node positive; 9.1% (n529), 58.5% (n5186) and 32.4% (n5103) were grade 1, 2 and 3, respectively. The samples are available using the GEO acces- sion numbers GSE46184 and GSE4611.
In these, the dynamic predictor achieved high classification efficiency (HR52.96) and outperformed the 21-gene recurrence score (HR52.60), the 70-gene signature (HR51.89) and the GGI signature (HR51.83) (see Kaplan–Meier plots in Fig. 3).
When using results of the dynamic re-training to exclude unreli- able samples, prediction power for each static classifiers increased (21-gene score: HR53.02; 70-gene classifier: HR53.60; 97-gene GGI: HR52.73). When including the ER positive lymph node negative patients only, the dynamic predictor retained its predic- tive power (HR54.5, p50.01), while the 21-gene score (p50.13), the 70-gene signature (p50.27) and the GGI signature (p50.06) have not reached statistical significance.
Discussion
High throughput genomic analysis has fundamentally changed our perception of breast cancer and the large scale heterogeneity of this disease has become widely recognized.18 Thus, searching for general prognostic markers that are applicable to all breast cancers is no longer considered appro- priate.19 Yet, most currently used prognostic signatures were
developed over a decade ago following the old paradigm of breast cancer as single disease. Here, we present a new approach to prognostic predictor discovery which recognizes heterogeneity of breast cancer and takes advantage of the large number of gene expression datasets that are now avail- able for predictor discovery and training. The main idea of our method is that we define a predictor for a new case from the molecularly most similar cancers. Since each case differ from one another to various extents, the predictor and train- ing set also differs from case to case.
We applied our method to gene expression data from 3,534 breast cancers and to a set of 325 independent cases. The dynamic classifier yielded higher average classification effi- ciency than genomic surrogates of three commonly used first generation prognostic signatures including the 21-gene recur- rence score, the 70-gene prognostic signature and the 97-gene genomic grade index. It is very important to emphasize that our study compares different conceptual approaches to prog- nostic prediction rather than results from the actual commer- cially available prognostic tests. The hazard ratio was computed between the poor and good outcome cohorts only.
We implemented this in order to be able to compare 3-class classifiers with the 2-class classifiers. However, removing from the performance calculations the cases that were assigned to the intermediate risk group by the 21-gene score or the dynamic predictors can provide a performance advantage for these classifiers. The highest concordance was observed between the dynamic classifier and the 21-gene score.
In the dynamic re-training, the classification of a sample as intermediate is fundamentally different from other approaches where the intermediate cohort represents a transi- tion zone between good and bad prognosis scores. In our method, intermediate designation refers to patients having discordant clinical and molecular classification assignments.
This category acknowledges the uncertainty about their
Table 2.Performance comparison of the different predictors for overall sensitivity, specificity, accuracy, positive predictive value (PPV) and negative predictive value (NPV) including confidence intervals (A) and their concordance in terms of designated prediction (B)
Dynamic re-classification 21-gene signature 70-gene signature 97-gene signature A
Sensitivity 0.84 (0.81–0.86) 0.80 (0.76–0.82) 0.98 (0.96–0.98) 0.81 (0.78–0.84)
Specificity 0.58 (0.55–0.61) 0.55 (0.53–0.58) 0.14 (0.12–0.16) 0.49 (0.46–0.52)
Accuracy 0.68 (0.66–0.70) 0.64 (0.62–0.65) 0.47 (0.46–0.47) 0.61 (0.59–0.63)
PPV 0.56 (0.54–0.58) 0.53 (0.52–0.55) 0.42 (0.42–0.43) 0.51 (0.49–0.52)
NPV 0.85 (0.82–0.87) 0.81 (0.79–0.83) 0.92 (0.86–0.95) 0.80 (0.77–0.83)
Re-training 21-gene signature 97-gene signature 70-gene signature
B
Prediction Good Intermediate Bad Good Bad Good Bad
Good 527 174 214 651 264 181 734
Intermediate 567 295 357 685 534 110 1109
Bad 100 180 1120 189 1211 7 1393
Concordance 55.0% 52.7% 44.5%
Cancer Genetics
Figure 3.Performance of the dynamic classifier and genomic surrogates for three other prognostic signatures in 325 independent validation samples that were not included in the pool of 3,534 samples used for selection of the training set samples. [Color figure can be viewed in the online issue, which is available at wileyonlinelibrary.com.]
Cancer Genetics
prognosis due to opposing risks by anatomical and molecular variables. When evaluating the static classifiers with the exclusion of these ambiguous samples, prediction efficiency increased for each classifier—thus, the dynamic re-training approach was capable to identify those samples where static predictors had low reliability.
We have to emphasize that the dynamic re-training approach is not restricted to any particular sub-cohort of patients like previ- ous classifiers. One of our most important advantages is that the dynamic classifier performed substantially better to discriminate between good and poor prognosis among ER-negative/HER nega- tive cancers than any of the first generation gene signatures that we tested. It is well recognized that the prognostic power of the currently clinically available multi-gene prognostic assays is pri- marily restricted to ER positive cancers and the vast majority of ER negative cancers are assigned to poor prognosis by these tests.
The classification success in HER2 positive and triple negative patients suggests that there could be sub-cohorts within these patients having good outcome who might perform well without adjuvant therapy. As we did not have sufficient patients with documented lack of adjuvant treatment within these cohorts, these findings must be validated in a future study.
Consistent with our previous expectations, most of the top ranked genes associated with survival differ from training set to training set. The three most commonly top ranked genes were CENPE, RACGAP1 and PGK1 which were included in the list of discriminatory genes in 831, 759 and 756 analyses, respec- tively. Thus, the most common gene reaches only a prevalence of 23.5% in all analyses. This observation illustrates the instabil- ity of gene rankings and also reflects the heterogeneity of breast
cancers.20 We also compared the list of strongest genes to the three static signatures and found the largest overlap to the 97- gene signature. In addition, we identified four out of six genes overlapping between the 21-gene, the 70-gene and the 97-gene signatures (MYBL2, CCNE2, CENPA and PRC1).
Our method preserves the independence of model discovery from validation but it does not apply a single fixed predictor to each new case. A unique, case-specific predictor is developed for each new test case. In order to allow other investigators to use and validate our method we constructed a web-based dynamic prognostic predictor tool. It requires uploading of an Affymetrix HGU133A or HGU133plus2 microarray .CEL file, then it automatically performs QC assessment and normaliza- tion and performs the dynamic risk prediction as described in this study. This provides a new standardized, low cost, open source paradigm for genomic predictors.21
To our knowledge, this transcriptome-based algorithm presents the first approach where a dynamic classification tool without a predefined gene-list is presented. Conceptually, this method is applicable to any multivariate predictor which relies on high throughput data including other microarray platforms or RNA-seq data. The ultimate power of the approach lies in the future extension of the database by add- ing new cases with molecular data and known outcome.
Acknowledgements
B.G. was supported by the OTKA K108655, K108688, PD105361 grants and by the Predict project (Grant no. 259303 of the EU Health.2010.2.4.1.-8 call) and L.P. was supported by an award from the Breast Cancer Research Foun- dation, New York. B.G. has applied for a patent on the diagnostic use of the dynamic method described in the manuscript.
References
1. Paik S, Shak S, Tang G, et al. A multigene assay to predict recurrence of tamoxifen-treated, node- negative breast cancer.N Engl J Med2004;351:
2817–26.
2. Parker JS, Mullins M, Cheang MC, et al. Super- vised risk predictor of breast cancer based on intrinsic subtypes.J Clin Oncol2009;27:1160–7.
3. Sotiriou C, Wirapati P, Loi S, et al. Gene expres- sion profiling in breast cancer: understanding the molecular basis of histologic grade to improve prognosis.J Natl Cancer Inst2006;98:262–72.
4. van’t Veer LJ, Dai H, van de Vijver MJ, et al.
Gene expression profiling predicts clinical out- come of breast cancer.Nature2002;415:530–6.
5. Rhodes A, Jasani B, Balaton AJ, et al. Frequency of oestrogen and progesterone receptor positivity by immunohistochemical analysis in 7016 breast carcinomas: correlation with patient age, assay sensitivity, threshold value, and mammographic screening.J Clin Pathol2000;53:688–96.
6. Rhodes A, Jasani B, Balaton AJ, et al. Study of interlaboratory reliability and reproducibility of estrogen and progesterone receptor assays in Europe. Documentation of poor reliability and identification of insufficient microwave antigen retrieval time as a major contributory element of unreliable assays.Am J Clin Pathol2001;115:44–58.
7. Layfield LJ, Goldstein N, Perkinson KR, et al.
Interlaboratory variation in results from immuno-
histochemical assessment of estrogen receptor status.Breast J2003;9:257–9.
8. Planey CR, Butte AJ. Database integration of 4923 publicly-available samples of breast cancer molecular and clinical data.AMIA Joint Summits Transl Sci Proc2013;2013:138–42.
9. Wray CJ, Ko TC, Tan FK. Secondary use of exist- ing public microarray data to predict outcome for hepatocellular carcinoma.J Surg Res2014;188:
137–42.
10. Gyorffy B, Benke Z, Lanczky A, et al. Recurren- ceOnline: an online analysis tool to determine breast cancer recurrence and hormone receptor status using microarray data.Breast Cancer Res Treat2012;132:1025–34.
11. Gyorffy B, Schafer R. Meta-analysis of gene expression profiles related to relapse-free survival in 1,079 breast cancer patients.Breast Cancer Res Treat2009;118:433–41.
12. Gautier L, Cope L, Bolstad BM, et al. Affy—anal- ysis of Affymetrix GeneChip data at the probe level.Bioinformatics2004;20:307–15.
13. Gyorffy B, Molnar B, Lage H, et al. Evaluation of microarray preprocessing algorithms based on concordance with RT-PCR in clinical samples.
PLoS One2009;4:e5645.
14. Li Q, Birkbak NJ, Gyorffy B, etal. Jetset: selecting the optimal microarray probe set to represent a gene.BMC Bioinformatics2011;12:474.
15. Gyorffy B, Lanczky A, Eklund AC, et al. An online survival analysis tool to rapidly assess the effect of 22,277 genes on breast cancer prognosis using microarray data of 1,809 patients.Breast Cancer Res Treat2010;123:725–31.
16. Foody GM. Classification accuracy comparison:
hypothesis tests and the use of confidence inter- vals in evaluations of difference, equivalence and non-inferiority.Remote Sensing Environ2009;
113:5.
17. Steinberg DM, Fine J, Chappell R. Sample size for positive and negative predictive value in diag- nostic research using case–control designs. Biosta- tistics 2009;10:94–105.
18. Weigelt B, Baehner FL, Reis-Filho JS. The contri- bution of gene expression profiling to breast can- cer classification, prognostication and prediction:
a retrospective of the last decade.J Pathol2010;
220:263–80.
19. Weigelt B, Pusztai L, Ashworth A, et al. Chal- lenges translating breast cancer gene signatures into the clinic.Nat Rev Clin Oncol2012;9:
58–64.
20. Curtis C, Shah SP, Chin SF, et al. The genomic and transcriptomic architecture of 2,000 breast tumours reveals novel subgroups.Nature2012;
486:346–52.
21. Sotiriou C, Pusztai L. Gene-expression signatures in breast cancer.N Engl J Med2009;360:790–800.