New aspects of retinal photoreceptor morphology and development in normal and pathological
conditions
Ph.D. Thesis
Dr. Ágnes Ida Berta
Doctoral School of Molecular Medicine Semmelweis University
PhD Supervisor: Dr. Ágoston Szél,
D.Sc.Official reviewers: Dr. Róbert Gábriel,
D.Sc.Dr. Gábor Somfai,
Ph.D.Head of the examination board: Dr. András Csillag
, D.Sc.Members of the examination board: Dr. Gábor Gerber,
Ph.D.Dr. Zsuzsanna Szepessy
, Ph.D.Budapest, 2013
2 Contents
I. List of abbreviations... 3
II. Introduction ... 6
III. Objectives ... 21
IV. Material and methods ... 23
1. Syrian hamster ... 23
2. Lemur ... 26
3. Human ... 27
4. Dogs ... 29
V. Results ... 38
1. Expression of lipid raft-associated proteins during photoreceptor development 38 2. Localization of raft-associated proteins in the photoreceptors of the mature retina of the Syrian hamster ... 48
3. Localization of caveolins in dog retina and in inherited canine retinal degenerations ... 53
4. Distribution of caveolin isoforms in the lemur retina... 59
5. Caveolins in the (melanoma malignum affected) human retina ... 63
6. Early retinal degeneration (erd) ... 68
VI. Discussion ... 100
VII. Conclusions ... 113
VIII. Summary ... 115
IX. Összefoglalás (Summary in hungarian) ... 116
X. References... 117
XI. List of publications ... 124
XII. Acknowledgements ... 125
3
I. List of abbreviations AGC protein kinases= protein kinase A, C and G families AO= anti-opsin
BSA= bovine serum albumin CD18 = integrin beta-2
cGMP= cyclic guanosine monophosphate
COS-1=monoclonal antibody labeling the red/green opsin CRABP= cellular retinoic acid binding proteins
crd1= gene locus of cone-rod dystrophy 1 crd2= gene locus of cone-rod dystrophy 2 crd3= gene locus of cone-rod dystrophy 3 crd4= gene locus of cone-rod dystrophy 4 CRX= cone-rod homeobox
DABCO= 1,4 diazobizyklo-[2.2.2]oktan) DAPI= 4',6'-diamino-2-phenylindole DNA= deoxyribonucleic acid DPM= disintegrations per minute DRMs= detergent-resistant membranes ECM= extracellular matrix
erd= gene locus of early retinal degeneration ERG= electroretinography
GC= ganglion cell(s) GCL= ganglion cell layer
GFAP= glial fibrillary acidic protein GS = glutamine synthetase
hCAR= Human cone arrestin IL= inner layer
ILM= inner limiting membrane INL= inner nuclear layer IPL= inner plexiform layer IS= inner segment(s)
4 KI-67=Kiel-67
L opsin= green opsin L/M opsin= green/red opsin M opsin= red opsin
mAb= monoclonal antibody
mRNA= messenger ribonucleic acid
NR2E3 or PNR= photoreceptor-specific nuclear receptor NRL= neural retina leucine zipper
OL= outer layer
OLM= outer limiting membrane ONF= optic nerve fibers
ONL= outer nuclear layer OPL= outer plexiform layer OS= outer segment(s)
OS-2= monoclonal antibody labeling the blue opsin P1, P5, P10 and P15= postnatal days 1, 5, 10, 15 PAX6= paired box protein 6
PBS= phosphate buffer saline
PCNA= proliferating cell nuclear antigen PCNA= proliferating cell nuclear antigen PE= pigment epithelium
PHH3= Phospho Histone H3 PKCα= Protein kinase C α
PRA= progressive retinal atrophy
prcd= gene locus of progressive rod-cone degeneration qRT-PCR = quantitative real time-PCR
rcd = gene locus of rod-cone dysplasia 1 rcd2= gene locus of rod-cone dysplasia 2 rcd3= gene locus of rod-cone dysplasia 3 rd= gene locus of rod dysplasia
RDS peripherin= peripherin 2 RDS= retinal degeneration slow
5
RHO= gene locus of autosomal dominant progressive retinal atrophy RIS= rod inner segment(s)
ROS= rod outer segment(s) RPE= retinal pigment epithelium S opsin= blue opsin
SDS= sodium dodecyl sulfate
SDS-PAGE= SDS-polyacrilamide gel electrophoresis SINE element= short interspersed nuclear element
TUNEL= terminal deoxynucleotidyl transferase dUTP nick end labeling Type A PRA= gene locus of photoreceptor dysplasia
VRD= vitreoretinal degeneration wk= week
wks= weeks
XLPRA= gene locus of X-linked progressive retinal atrophy
6
II. Introduction
The major cause of blindness in industrialized countries are diseases caused by the progressive dysfunction and the loss of retinal photoreceptors, which also explains the importance of experimental and clinical studies on this topic. It is one of the most genetically heterogenous disorders in man, with well over 100 genes found so far related only to hereditary degeneration forms (Hartong et al., 2006). The number of loci identified predispositioning age-related macular degeneration is continously increasing.
The inherited and multifactorial forms of photoreceptor degeneration are different in several ways, but the common and a key event is the progredient loss or dysfunction of photoreceptor cells, occuring primary or secondary. Although the genetic and mechanistic heterogenity of photoreceptor degeneration is a challenge for developing therapeutic strategies, but recently there have been several successful approaches (Wright et al., 2010).
The inherited forms of photoreceptor degeneration are a common cause of visual impairment and the majority of them is monogenic, with a prevalence of ~1 in 3,000 (Pacione et al., 2003; Rattner et al., 1999). The most common subtype is retinitis pigmentosa, which is one of the two main causes of blindness in the adult population (20–64 year olds, (Buch et al., 2004). Typically the first symptom of retinitis pigmentosa is reduced night vision in early or middle life, due to rod dysfunction starting in the peripheral retina. Later on it slowly progresses to the mid-peripheral field or further, often leaving the patients with a small central island of vision due to the survival only of macular cones (Hartong et al., 2006). Usually retinitis pigmentosa results from a primary defect in rods, but this also leads to secondary cone loss at later stages and this is why it is classified as a rod–cone degeneration. There are also some rare subtypes of retinitis pigmentosa that show a primary dysfunction of both rods and cones. At the moment 46 genetic subtypes of retinitis pigmentosa are identified based on clinical symptoms, although some subtypes are part of different syndromes that also include non-ocular features. Other inherited photoreceptor degenerations include macular, cone and cone-rod degenerations, which are clinically distinguishable from retinitis pigmentosa. These disorders can present at any stage of life, but predominantly -just like retinitis pigmentosa- also cause severe visual loss in early to middle age. Early
7
loss or distortion of central vision is the common and pathognomonic clinical finding by cone-, cone–rod degenerations and also by inherited macular degenerations. These can usually be distinguished from one another by electrophysiological and other tests, because the photoreceptor defect in the cone and cone–rod degenerations is more generalized compared to the inherited macular degenerations. Macular degenerations result from anatomically circumscribed primary defects in macular rods, cones or retinal pigment epithelium. The further differential diagnosis is based on the fact that in cone–
rod degenerations cones are more severely affected, while in cone degeneration cones are the only cell type involved (Wright et al., 2010).
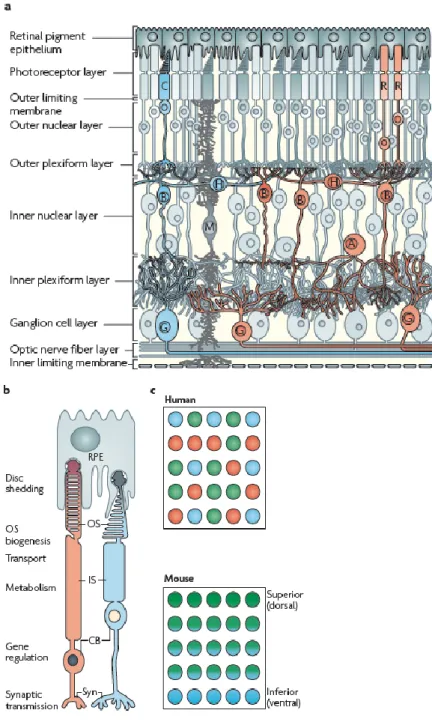
The vertebrate retina is made of six major cell types (rod and cone photoreceptors, and horizontal, bipolar, amacrine and ganglion cells) that exhibit laminar organization and form numerous parallel microcircuits for integration and processing of visual signals (Figure 1a). The process of vision begins at the photoreceptors, which are unique sensory neurons that are specialized to capture light quanta. The chemical output of photoreceptors is integrated and processed by interneurons (bipolar, horizontal and amacrine cells) and transmitted to visual centers in the brain by ganglion cells (Masland, 2001; Swaroop et al., 2010).
The photoreceptors cells themselves are highly compartmentalized for specialized functions and are strongly associated with the retinal pigment epithelium, structurally and functionally, which supports photoreception (Figure 1b). Cone photoreceptors respond to bright light, mediate colour vision and foveal cones make high resolution of visual images ("sharp vision") possible. Rod photoreceptors function only under dim light conditions. They are so sensible that they can respond to single light quanta (Luo et al., 2008). Across the retina, rods and various cone subtypes always have a well-defined arrangement, occuring with different patterns in different species.
This pattern is generated with the right number of components at the right place, and also with appropriate connection to interneurons for further processing of visual information (Figure 1c). As already mentioned, the retinal photoreceptor pattern is different in various species. In mice and humans, photoreceptors represent over 70% of retinal cells, but rods outnumber cones by 30:1 in mice and 18–20:1 in humans (Carter- Dawson and LaVail, 1979; Roorda and Williams, 1999). A major difference between humans (and diurnal primates) and mice (and most other mammals) is the presence in
8
humans of a thin, pit-like, cone-only region in the centre of the retina, called the fovea, which is responsible for highest visual acuity. In humans, the density of rods increases from the fovea to the periphery of the retina, with the highest rod density in the parafoveal region (Curcio et al., 1990).
The mammalian retina has only one type of rod visual pigment called rhodopsin, which has a peak spectral sensitivity at ∼500 nm. Most mammals, including the mouse, have two types of cone opsins defining dichromatic colour vision: S opsin (also known as blue sensitive opsin), which has peak sensitivity in the short wavelength (ultraviolet or blue) region of the spectrum; and M opsin (also known as green-sensitive opsin), which has peak sensitivity in the medium–long wavelength (green) region of the spectrum (Swaroop et al., 2010). In humans and diurnal primates an additional opsin, L opsin (also known as red-sensitive opsin) is also present, which is sensitive to longer wavelength (red) light. The three opsin types establish trichromatic colour vision. Each human cone expresses only one of the three opsins, arranged in a mosaic-like pattern over the retina (Deeb, 2006; Nathans et al., 1986). In mice M opsins and S opsins are expressed in opposing gradients across the retina (Figure 1c).
9
Figure 1. Structure of the retina, (Swaroop et al., 2010).
10
The outer segment, where the primary photoreceptive processes take place, is a specially transformed primary cilium (Davenport and Yoder, 2005). It is made of a dense stack of flattened membrane discs covered with the plasma membrane and contains more than 500 proteins species (Kwok et al., 2008). The phototransduction cascade is a series of biochemical reactions that convert a photon into a neural impulse in rod cells. This biochemical mechanism has been characterized in great detail (Deretic, 2006; Khorana, 1992; Maeda et al., 2003). The cascade is initiated by photon absorption in the chromphore 11-cis retinal which, by isomerization induces conformational change of the apoprotein opsin. The signal is then transferred to the phototransduction chain consisting of transducin-alpha, cGMP-phosphodiesterase, cGMP-gated cation channel which then leads to hyperpolarization of the plasma membrane. Important steps along the visual transduction are closely associated with the disc and plasma membranes (Khorana, 1992) of the outer segment.
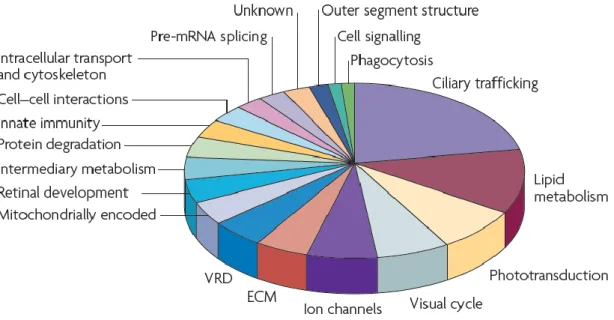
The unique structural and functional organization of the vertebrate retina is finely adapted to the initial capture and processing of visual signals, but this organization also makes it unusually vulnerable to dysfunction (Masland, 2001). The genes known to influence photoreceptor degeneration are responsible for many, almost all, aspects of cellular structure and function (Figure 2, (Wright et al., 2010). Mutations affecting functions that are photoreceptor specific, such as phototransduction or the visual cycle, are only marginally more numerous than mutations affecting more general cell functions, such as protein folding, lipid metabolism or the extracellular matrix.
Most of the mutations show widespread rather than photoreceptor specific expression patterns. There is no explanation why mutations in so many different genes cause photoreceptor degeneration (see review at (Wright et al., 2010).
11
On the basis of morphology and TUNEL staining in photoreceptor degenerations, early papers concluded, that apoptosis was the predominant way of cell death (Portera-Cailliau et al., 1994). However, it was later shown that TUNEL staining can detect both apoptotic and necrotic or autolytic cells (Colicos and Dash, 1996; Grasl- Kraupp et al., 1995). It was only recently (Lohr et al., 2006; Sancho-Pelluz et al., 2008) shown in mouse models that cell death can be caspase-independent or show features of autophagy. It is now accepted that caspase-independent and -dependent mechanisms are both involved, often cooperatively, in apoptotic cell death, including photoreceptor degeneration (Kroemer et al., 2009). Different cell-death mechanisms may be predominant during different stages of the disease or overlap at any one stage, however, apoptosis remains the predominant mode of cell death (Wright et al., 2010).
Figure 2. Functional categorization of genes influencing photoreceptor degeneration. In this pie chart it is shown, that the 146 genes implicated in photoreceptor degeneration play a role in numerous crucial cell functions (Wright et al., 2010).
12
The dog as a model for hereditary diseases has attracted the attention of basic research in the last 15 years, as numerous inherited canine retinal diseases show close homology to human diseases, however the retinal structure in the two species is in many ways different. The dog central retina is rod dominant, even within the highest cone density region of the area centralis. Both cone and rod densities are highest in the area centralis; cone and rod inner segments have a smaller cross-sectional area reflecting the higher density in this location compared with the peripheral retina. The majority of cones express L/M opsin, which enables better spatial and achromatic vision. S opsin may be expressed in a higher proportion of cones in the peripheral retina than in the area centralis (Mowat et al., 2008). The inferior peripheral retina typically has the lowest cone density of the whole retina. It is likely therefore that the visual acuity is lowest in this location and may reflect evolutionary pressures: since the canine has few airborne predators or prey, visual acuity in the superior field may be of low priority. Like many other nocturnal species, the dog eye contains an intraocular reflecting structure, the tapetum lucidum. The tapetum lucidum is a biologic reflector system that normally functions to provide the light-sensitive retinal cells with a second opportunity for stimulation of photoreceptors by photons, thereby enhancing visual sensitivity at low light levels. (Mowat et al., 2008; Ollivier et al., 2004). In dogs it is located in the choroid an contains layers of cells packed with organized, highly reflective material (Tapetum lucidum cellulosum, (Lesiuk and Braekevelt, 1983).
13
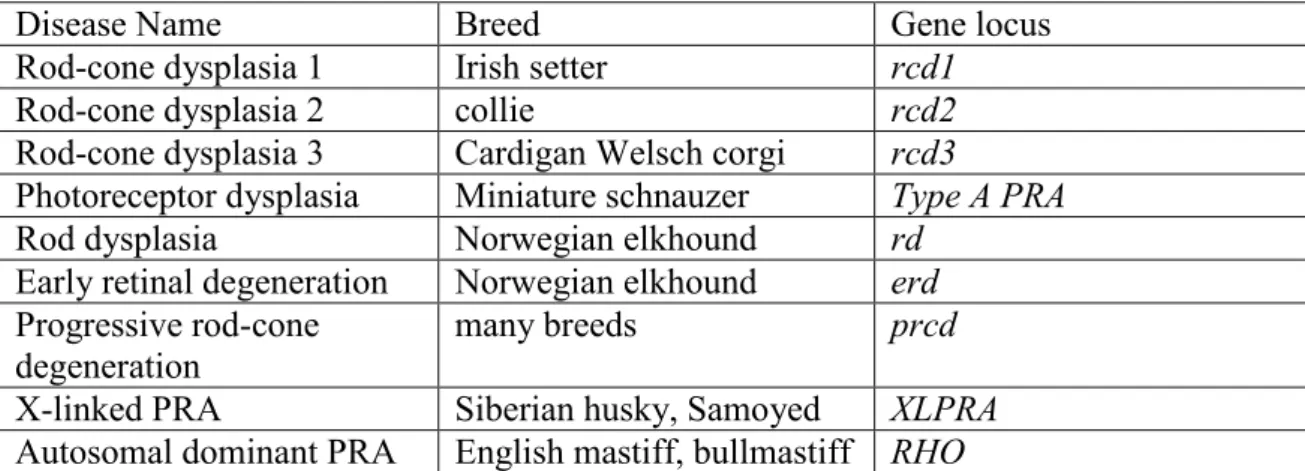
Dogs also suffer from various forms of inherited retinal blindness, the principal one of which is termed progressive retinal atrophy (Table 1). This group diseases can occur in different dog breeds, however all affected dogs show the same general, clinically recognizable ocular abnormalities (Aguirre, 2006). Diseases in the progressive retinal atrophy group are all progressive disorders, that affect the retinal photoreceptor cells primarily, or possibly secondary to the defects in the retinal pigment epthelial layer. In general, damages can be first recognized in the rod photoreceptors and subsequently in cones; hence the reason why night blindness is the predominant clinical finding prior to the severe visual dysfunction under both dim and bright light conditions. Associated with these defects, characteristic changes in the fundus can be observed clinically: retinal blood vessels become thin, there is an increased reflectivity of the tapetal layer (secondary to retinal thinning) and the optic nerve becomes pale. In the late stages of the diseases, most dogs develop secondary cataracts. Diseases in the progressive retinal atrophy group can be early-onset (age of manifestation < 6 weeks) or late onset (age of manifestation > 9 months, (Aguirre, 2006).
Disease Name Breed Gene locus
Rod-cone dysplasia 1 Irish setter rcd1
Rod-cone dysplasia 2 collie rcd2
Rod-cone dysplasia 3 Cardigan Welsch corgi rcd3
Photoreceptor dysplasia Miniature schnauzer Type A PRA
Rod dysplasia Norwegian elkhound rd
Early retinal degeneration Norwegian elkhound erd Progressive rod-cone
degeneration
many breeds prcd
X-linked PRA Siberian husky, Samoyed XLPRA Autosomal dominant PRA English mastiff, bullmastiff RHO
Table 1: The progressive retinal atrophy group (Aguirre, 2006).
14
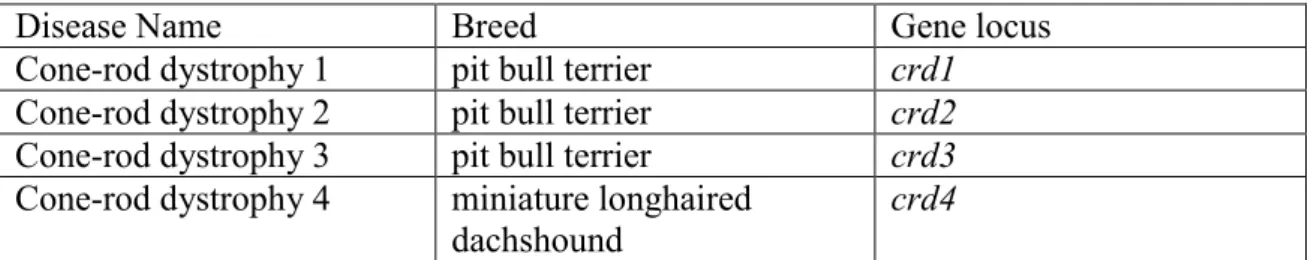
Another important clinical group of inherited retinal disorders in dogs are the cone-rod dystrophies (Table 2). Cone-rod dystrophies are disorders predominantly of cones, with rods being affected later and to a lesser extent, at least initially. In many cases the affected dogs show extensive impairment of visual function under both dim and light conditions. Of the four recognized cone-rod dystrophies (Table 2), three show extensive retinal disorder before one year of age (crd1, crd2, crd 4), whereas crd3 is a late-onset, slowly progressive disease (Aguirre, 2006).
Disease Name Breed Gene locus
Cone-rod dystrophy 1 pit bull terrier crd1 Cone-rod dystrophy 2 pit bull terrier crd2 Cone-rod dystrophy 3 pit bull terrier crd3 Cone-rod dystrophy 4 miniature longhaired
dachshound
crd4
Table 2: The cone-rod dystrophy group (Aguirre, 2006).
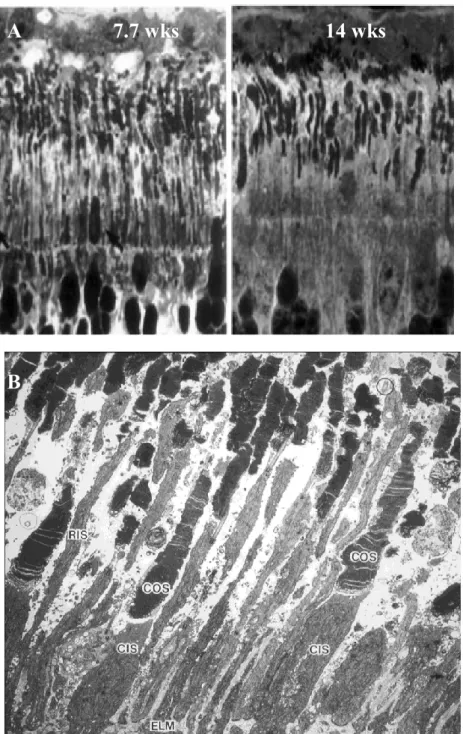
Early retinal degeneration (erd) is an autosomal recessive, early onset form of canine retinal degeneration characterized by aberrant functional and structural development of rod inner and outer segments, and rod and cone synapses. Rod and cone inner and outer segments show variable length, apparently the result of uncoordinated growth during development (Figure 3.). Abnormal development is followed by rapid degeneration of rods and cones. Affected dogs are initially night blind, and become totally blind between 48 and 72 weeks of age. The development of electroretinogram a- and b-waves was compared in normal and erd animals. In young normal dogs the response is a-wave dominated (between 2 and 4 wks), thereafter the b-wave becomes dominant. The erd-affected electroretinogram is a-wave dominated, until it disappears in older age (Acland and Aguirre, 1987). Genetical features of the disease have already been identified. The erd locus maps to CFA 27 (homologous to HSA12p), and the disease results from a SINE element insertion in the serine/threonine kinase 38-like protein gene (STK 38L) that causes exon 4 to be skipped during transcription. This predicts the removal of 41 amino acids from the translated protein and elimination of critical conserved functional domains (Goldstein et al., 2010).
15
4.3 wk 7.7 wk 14 wk
20wk
4.3 wk 7.7 wk 14 wk
20wk
A 7.7 wks 14 wks
B
Figure 3. A: Photoreceptor layer from erd-affected dogs, by high resolution optical microscopy. At 7.7 wks the outer- and inner segments show variable length and are irregular in shape, at 14 wks photoreceptors are decreased severely in size and number.
B: Photoreceptor layer, 54-day-old erd retina, electron micrograph. Cone inner- and outer segments are normal. Rod outer- and inner segments are extremely variable in length (Acland and Aguirre, 1987).
16
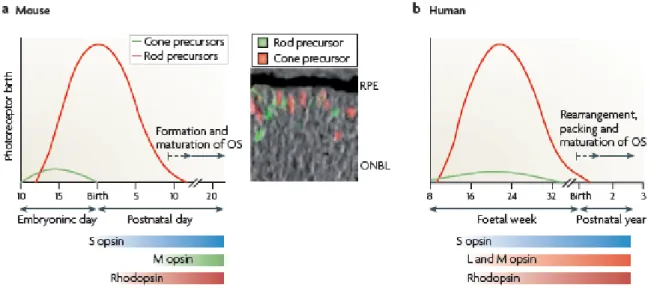
In mammals, the genesis of photoreceptors takes relatively long, weeks to months depending on the species, occuring pre- and postnatally (Carter-Dawson and LaVail, 1979; Morrow et al., 1998; Rapaport et al., 2004; Young, 1985). After the final mitosis step, the photoreceptor precursor is committed either to the rod or to cone maturation pathway (Figure 4). In humans, all photoreceptors are formed prenatally.
The first cones and rods are born around foetal week 8 and 10, respectively. The mRNA of S opsin is detectable at foetal week 12, followed by rhodopsin, M opsin and L opsin at foetal week 15 (Cornish et al., 2004; Hendrickson et al., 2008). In the mouse, photoreceptor development is less advanced than in humans at birth, rods are born both pre-and postnatally. The eyes of the newborn animals remain closed for almost 2 weeks.
Cone genesis starts at embryonic day 11 and is essentially complete at birth, while peak of rod genesis occurs in the first few postnatal days. S opsin is already expressed at late embryonic stages, but rhodopsin only subsequently after birth. Expression of M opsin begins later around postnatal day 6 (Carter-Dawson and LaVail, 1979; Young, 1985).
Figure 4. Comparison of photoreceptor generation and maturation in mice and humans.
The main difference is that while in humans retinal development is almost completed by the time of birth, in mice the retina of newborn animals is immature and develops its structure in the first two weeks after birth (Swaroop et al., 2010).
17
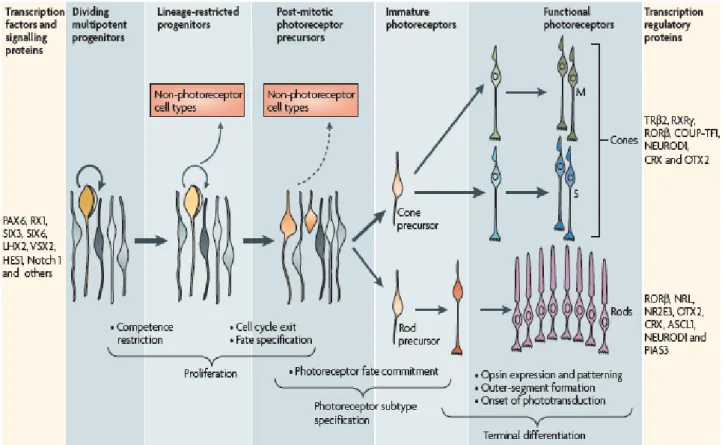
The generation of functionally mature neurons from multipotent retinal progenitor cells proceeds through a series of steps and choices, committing cells to a particular fate. This process can be divided into five major steps: first, formation and proliferation of multipotent retinal progenitor cells; second, restriction of the competence of multipotent retinal progenitor cells; third, cell fate specification and commitment to photoreceptor precursors during or after final mitosis; fourth, expression of photoreceptor genes, such as those for phototransduction and morphogenesis; and fifth, axonal growth, synapse formation and outer segment biogenesis (Figure 5, (Swaroop et al., 2010).
Figure 5. Stages of photoreceptor development from progenitors to mature photoreceptors. During cell type specification of photoreceptors, precursors are directed to become rods or cones by numerous transcription factors, signaling and regulatory proteins (Swaroop et al., 2010).
18
Lately it was demonstrated that a group of integral membrane proteins, the caveolins play a critical role in early vertebrate development. They are especially important in notochord and neuromast formation (Fang et al., 2006; Nixon et al., 2007).
Caveolins are integral membrane proteins that are principal components of the special, Ω-shaped plasma membrane invaginations called caveolae. For formation of caveolae cholesterol is essential, as cholesterol binds caveolins and also influences caveolin transcription (Fielding et al., 1997; Murata et al., 1995). The caveolin–cholesterol interaction has also other aspects: caveolin binds to liposomes but only if they contain cholesterol, and this induces protein oligomerization (Murata et al., 1995), suggesting that caveolin oligomerization and membrane insertion is cholesterol-dependent.
Caveolae were first identified in endothelial cells about 50 years ago and they were only later recognized, as a type of lipid rafts on the basis of their lipid composition. Although lipid rafts and caveolae are similar biochemically, they are morphologically different.
Because of their unique, Ω-shaped appearance caveolae can be detected by electron microscopy, whereas lipid rafts are not visible. The different structure also suggest different functions (Head and Insel, 2007).
It is now known, that the lateral organization of the lipids in photoreceptor outer segment membranes is not uniform, since the membrane contains microdomains, that are resistant to nonionic detergents (Martin et al., 2005). Based on fatty acid analysis, detergent-resistant membranes (DRMs, also known as lipid rafts) represent 8% of the rod outer segment disc membranes and 12% of the rod outer segment plasma membrane (Elliott et al., 2008). In general, detergent-resistant membranes are plasma membrane subdomains that contain high concentrations of cholesterol and glycosphingolipids and are usually associated with certain proteins, however the lipid and protein components of such membrane domains may show variations. A general feature in various cell types is the presence of caveolin-1 and c-src in detergent-resistant membranes (Pike, 2003).
Similarly to detergent-resistant membranes in other cell types, photoreceptor DRMs also contain caveolin-1 and c-src as shown by biochemical studies (Ghalayini et al., 2002; Martin et al., 2005). Until now immunocytochemical studies showed no or minimal amount of caveolin-1 at the rod outer segment level (Kim et al., 2006).
Caveolin was originally identified in transformed chick fibroblasts as a tyrosine- phosphorylated substrate of src (Glenney, 1989; Murata et al., 1995). Multiple isoforms
19
of caveolin have been identified: caveolin-1-α, caveolin-1-β, caveolin-2, and caveolin-3.
While their structure is similar, their specific properties and tissue distribution are different in many ways. Caveolins have a similar molecular structure in vertebrate and non-vertebrate species (Caenorhabditis elegans), which indicates that caveolins are structurally and functionally conserved across species from worms to human (Scherer et al., 1997) and suggests that caveolins might have an important evolutionary role. The short cytoplasmic domain of the N-terminal region of caveolin-1 forms multivalent homo- and hetero-oligomers (Okamoto et al., 1998). In contrast to caveolin-1, caveolin- 2 was not found to form homo-oligomers and exists mainly as a monomer (Scherer et al., 1995), or it forms stable hetero-oligomeric complexes with caveolin-1 (Scherer et al., 1997). Thus, caveolin-2 may function as an accessory protein in conjunction with caveolin-1 (Okamoto et al., 1998). Caveolin-1 and caveolin-2 are thought to originate from a common ancestor and are most abundantly expressed in adipocytes, endothelial cells, fibroblasts and smooth muscle cells (Okamoto et al., 1998; Scherer et al., 1997;
Scherer et al., 1995). The expression of caveolin-3 is described to be dominantly to be muscle specific (Song et al., 1996; Tang et al., 1994; Way and Parton, 1996), although it has been shown that they are present in other cell types, such as astroglial cells (Nishiyama et al., 1999) and neurons of vegetative ganglia as well (Kiss et al., 2002). It has been proposed that members of the caveolin family members function as scaffolding proteins to organize and concentrate specific lipids (cholesterol and glycosphingolipids), lipid-modified signaling molecules and G proteins within caveolae, as binding may suppress or inhibit enzyme activity through the caveolin scaffolding domain, which is a common caveolin domain (Schlegel et al., 1998; Swaney et al., 2006).
There are only a few reports available about the presence and distribution of caveolins in the retina. In the mouse retina, caveolin-1 was found to be present in the outer plexiform layer in the synaptic ribbon of photoreceptor terminals (Kachi et al., 2001). In the rat retina caveolin-1 was detected in various retinal layers, between the inner plexiform layer and the outer limiting membrane, suggesting that caveolin-1 is expressed in Müller cells, this was also confirmed using Müller cell specific markers (Ueda, 2002). It was also shown with laser scanning confocal microscopical analysis that caveolin-1 is located in apical and basal surfaces of pigment epithelial cells.
20
(Bridges et al., 2001). Few years later a more detailed histological study was published showing caveolin-1 to be present in the majority of retinal layers of the rat (Kim et al., 2006). In contrast, caveolin-2 immunostaining was much weaker throughout the retina, with a more intense staining around the blood vessels. Caveolin-2 stained the processes of glial cells and Muller cells, but immunoreactivity was very limited in retinal neuronal cells including the ganglion cells, amacrine cells, bipolar cells, horizontal cells, and photoreceptor cells. This study group made no examinations about caveolin-3 and only central retinal regions were analysed (Kim et al., 2006). These first studies did not offer a comprehensive and accurate picture about the expression of caveolin isoforms in the mammalian retina.
21
III. Objectives
1. Localization and expression pattern of caveolin-1 and c-src during retinal development in order to understand their potential function in photoreceptor development. We wanted to compare the expression of these molecules to two highly abundant, well characterized proteins, rhodopsin and rhodopsin kinase. In addition, we also aimed at investigating the distribution profile of a kinase responsible for caveolin-1 phosphorylation, c-src, as well as the phosphorylated product, phospho-caveolin-1. To study potential colocalization and coexpression, double immunolabeling and co-immunoprecititation were used.
2. Expression and distribution of caveolin isoforms in the retina of different species and in different retinal diseases, especially focusing on the human retina, where relevant data on the topic were until now completely missing. We also wanted to compare degenerating and normal retina of the dog to reveal a possible role of caveolin and caveolin-related proteins in these retinal disorders.
The dog retina and inherited canine retinal degenerations are especially interesting, because they show close homology to similar diseases in human.
3. Detailed morphological and biochemical description of early retinal degeneration (erd), a canine retinal degeneration characterized by abnormal photoreceptor development, followed by rapid photoreceptor degeneration.
Although many other canine degenerations are now well characterized, in this disease the mechanism of photoreceptor degeneration was until now not described. Since in erd a special, elongated cell death period was observed, which is not followed by an appropriate change in the number of photoreceptors, our aim was to investigate the possibility if a cell proliferation compensates for the loss of photoreceptors. Various cell proliferation and cell-specific markers were planned to assess cell proliferation and to identify which cell types are proliferating.
22
4. Comparison of erd with other canine retinal degenerations. As in erd proliferating cells were found it the photoreceptor layer, we also wanted to investigate if the cell proliferation period is a unique characteristic of early retinal degeneration or not. We aimed at evaluating the cell proliferation rate in other canine retinal degenerations and comparing it to that of erd.
23
IV. Material and methods 1. Syrian hamster
Animals
In this study Syrian (golden) hamsters were used in different stages of postnatal development. The size and thickness of its retina makes it a suitable model animal for morphological and developmental studies. Samples were collected on postnatal days 1, 5, 10, 15 (P1, P5, P10 and P15) and in adulthood. More than 18-days-old hamsters were considered as adults. The animals were kept in standard conditions; food and water were added ad libitum. Retinal samples from a Xenopus laevis were also used in this study.
All eyes were light adapted (animals were kept in light at least for 30 minutes) prior to sample collection. The experiments were approved by Animal Ethical Committee of Semmelweis University, Budapest (Leg. No. 1963-003-2004) and were in accordance with the Association of Research in Vision and Ophthalmology Resolution on Care and Use of Laboratory Animals.
Toluidine blue staining and electron microscopy
Retinas of hamsters (P1, P5, P10, P15, and P18) were fixed in 1% glutaraldehyde in Millonig’s phosphate buffer (pH 7.4) overnight at 4ºC. After washes in Millonig’s phosphate buffer and subsequently in cacodylate buffer, the samples were postfixed in 1% OsO4 (in cacodylate buffer) for 1h at 4ºC. This was followed by a wash in cacodylate buffer and dehydration with ethanol during which samples were stained with 1% uranyl acetate in 70% ethanol for 1h at 4ºC. The samples were then embedded in araldite. Semithin and ultrathin sections were made on a Reichert-Jung Ultracut E (Leica, Austria). Semithin sections were stained with toluidine blue and viewed with a Zeiss Axiophot Microscope (Zeiss, Germany); the micrographs were obtained using an Olympus DP50 camera (Olympus, Japan). Ultrathin sections were contrast-stained with uranyl acetate and lead citrate and viewed in a Hitachi H 7500 electron microscope (Hitachi High-Technologies, Japan).
Immunocytochemistry
24
Hamster retinas were prepared as follows. Right after enucleation, the cornea, lens and vitreous body were removed and the posterior eyecup was subsequently fixed in 4% paraformaldehyde in 0.1 M phosphate buffer (pH 7.4) for 24 hours at 4°C. The solution was then replaced with 0.1 M phosphate buffered saline (PBS, pH 7.4), and rinsed for at least 24 hours before further processing. For cryoprotection the eyecups were incubated in 30% sucrose in 0.1 M phosphate buffer overnight which was followed by embedding in Tissue Tek. Cryo sections of 10 µm thickness were cut on a cryostat and dried onto poly-L-lysine coated glass microscope slides at 37°C. The Xenopus laevis retinas were fixed in 1% glutaraldehyde in Millonig’s phosphate buffer (pH 7.4) overnight at 4ºC and semithin araldite sections were prepared as described above, followed by araldite extraction. Both section types were then soaked in PBS for 20 minutes and were treated subsequently with a blocking solution of 1% bovine serum albumin (BSA) and 0.1% Triton X-100 in PBS for 1 hour. The primary antibody was applied at 4°C overnight. For single immunolabeling the following primary antibodies were used: anti-caveolin-1 (polyclonal rabbit IgG, Transduction Laboratories, CA), anti- phospho(Tyr14)-caveolin-1 (polyclonal goat IgG, Santa Cruz Biotechnology, CA), anti- c-src (polyclonal rabbit IgG, Santa Cruz Biotechnology, CA), anti rhodopsin kinase (mouse monoclonal IgG-1, against GRK-1 C-terminal, a generous gift of Krzysztof Palczewski) and anti-opsin [AO rat polyclonal IgG to bovine rhodopsin, (Rohlich and Szel, 1993)]. All antibodies were diluted 1:100 in 1% BSA/PBS. Anti-rabbit and anti- mouse Alexa 488 (Molecular Probes, CA, 1:200) were used as secondary antibodies for 1h at room temperature. For the visualization of the cytoskeleton, F-actin was stained with Alexa fluor 594-labeled phalloidin (Molecular Probes, CA; 1:100). Vectashield HardSet Mounting Medium (Vector Laboratories, CA) with DAPI (4′,6-diamidino-2- phenylindole) was used to cover the slides. For double immunolabeling various combinations of the above antibodies were used as indicated in the figure legends.
Control reactions were performed with rabbit, mouse and rat normal sera and non- specific primary antibodies, as well as omitting the primary antibodies to preclude the possibility of non-specific binding. The retinas were examined on a Nikon Eclipse E800 microscope using a Bio-Rad Radiance confocal imaging system (Bio-Rad Life Science Research, CA). Confocal Assistant (Todd Clark Brelje, University of Minnesota) and
25
Adobe Photoshop 7.0 (Adobe, Mountain View, CA)software was used for the image processing.
Immunoblot analysis of retinal lysates and isolation of ROS
After enucleation the cornea, lens and vitreous body were removed and the retina was detached from the posterior eyecup in various ages (P1, P5, P10, P15 and adult). All eyes were light adapted. For whole retinal lysates, 400 mg of each sample was lysed for 1 h at 0ºC in a lysis buffer containing 150 mM Tris/HCl, 1% Triton X-100 and Complete Mini Protease Inhibitor Coctail (Roche, Switzerland), according to the recommendation of the producer. Thereafter, the samples were centrifuged at 21,000x g for 10 minutes at 4ºC and the supernatants were used for further investigation. For ROS preparation 30 fresh hamster retinas were collected and outer segments were isolated using the modification (Martin et al., 2005) of a previously described method (Seno et al., 2001). Protein concentrations were determined by Bio-Rad Bradford assay. Equal amounts of total protein of each lysate were separated by 10% SDS-polyacrilamide gel electrophoresis (SDS-PAGE). SDS-PAGE was performed according to the method of Laemmli (Laemmli, 1970). Proteins were transferred on a Hybond-ECL nitrocellulose membrane (Amersham Biosciences, UK). Non-specific binding was blocked with skim milk. Immunoblot analysis was carried out with the following antibodies: anti-caveolin- 1 (polyclonal rabbit IgG, Transduction Laboratories, CA), anti-phospho(Tyr14)- caveolin-1 (polyclonal goat IgG, Santa Cruz Biotechnology, CA), anti-c-src (polyclonal rabbit IgG, Santa Cruz Biotechnology, CA), anti rhodopsin kinase (mouse monoclonal IgG-1, against GRK-1 C-terminal, a generous gift of Dr. Krzysztof Palczewski) and anti-opsin [AO rat polyclonal IgG to bovine rhodopsin, (Rohlich and Szel, 1993)]. All antibodies were diluted 1:1000 in 1% BSA/PBS, except for caveolin-1, which was diluted 1:100. Biotinylated secondary antibodies were used in a dilution of 1:500. The immunoreactive bands were visualized using Vecastatin Elite ABC kit (Vector Laboratories, CA) and DAB staining. Tubulin-1 was used as loading control.
Immunoprecipitation and Western Blot
For immunoprecipitation, tissue preparation was the same as for immunoblot analysis. The samples were taken from Syrian hamster eyes of different ages: postnatal
26
day (P) P1 (50 retinas), P5 (30 retinas), P10 (30 retinas), P15 (30 retinas) and adult (10 retinas). The retinal tissue samples were collected and stored at -80 ºC until use. Then the samples were dissolved in a lysis buffer containing 50 mM Tris–HCl, 150 mM NaCl, 1 mM EDTA, 1 mM Na3PO4, 1 mM NaF, 10% glycerol, 0.5% Nonidet P40, 0.1 mM PMSF and 10g/ml aprotinin (pH 7.4).The lysate (0,5 mg from each sample) was incubated with anti-opsin antibody (Rohlich and Szel, 1993), for 5 h at 4ºC. The immune complex was bound to Protein A immobilized on Sepharose 4B for 1 hour and sedimented with centrifugation at 12,000x g, followed by five washes in lysis buffer (1 ml each). Bound protein was dissolved in SDS sample buffer (100 µl) and analyzed on SDS-PAGE, followed by transfer to nitrocellulose filter. Equal amounts of protein (as determined by BCA Protein Assay Kit, Thermo Fisher Scientific, Rockford, IL) were separated by 10% SDS-PAGE under reducing conditions, immunoblotted and probed with one of the following antibodies, anti-caveolin-1 and anti-c-src. Due to the small amount of sample, blots were stripped and subsequently probed with 1:1000 dilution of mouse anti-RDS mAb 3B6 or anti-Rom-1 mAb 1C6 (a generous gifts from Dr. Robert Molday). Appropriate HRP-conjugated secondary antibodies were subsequently used.
1:1000 dilution of mouse monoclonal to β-actin (Abcam, Cambridge, MA) was used as a loading control antibody. Control reactions without retinal samples were made to preclude non-specific interaction of antibodies.
2. Lemur
(black-and-white ruffed lemur, Varecia variegata)
The male lemur utilized in this study lived in captivity and died naturally at the age of 11 (normally these animals live for 19 years), without any eye diseases. Within a few hours of the death of the lemur, the bulb was removed and subsequently placed in a fixative (4% paraformaldehyde), then incubated for 24 h at 4°C. The retinas were then incubated overnight in 30% sucrose. Three samples were obtained from the lemur retina from the radial plane, and included the macular region, periphery, and ciliary body. 10 µm sections were prepared on a ThermoShandon cryotome. The distribution of the caveolins was determined via immunocytochemistry using isoform-specific antibodies.
27
The primary antibodies anti-caveolin-1 (1:100, polyclonal rabbit IgG; BD Biosciences, USA), anti-caveolin-2 (1:200, monoclonal mouse IgG; BD Biosciences, USA), and anti-caveolin-3 (1:100, monoclonal mouse IgG; BD Biosciences, USA) were diluted in 1% BSA and incubated overnight at 4°C. In order to detect caveolin-1 and -3, anti- rabbit and anti-mouse Alexa 488 (Invitrogen, USA), respectively, were employed as secondary antibodies. As caveolin-2 yielded a weak signal that was difficult to detect, we utilized biotinylated anti-mouse, then Streptavidin Alexa 488 (Invitrogen, USA), 1:100, in an effort to amplify the signal. Even when this extra method was used, caveolin-2 yielded the weakest signal among the variants. In order to visualize the cytoskeleton, Alexa fluor 594-labeled phalloidin (Invitrogen, USA) diluted to 1:100 was utilized to stain the F-actin. The slide was covered with a mounting medium containing 4 ,6-diamidino-2-phenylindole (Vectashield HardSet Mounting Medium;Vector Laboratories, USA). Control reactions were conducted using rabbit and mouse normal serum with non-specific primary antibodies, and the primary antibodies were omitted in order to prevent non-specific binding. Fluorescent triple-labeled specimens were inspected on a 2100 Multi Photon Imaging System (Radiance, USA) coupled to an Eclipse E800 microscope using a LaserSharp 2000 (Nikon, USA). Adobe Photoshop 7.0 and Confocal Assistant were used for primary image processing.
3. Human
Material
Three patients were involved in the study. Two males (ages: 50, 57) and one female (age: 50). They were operated for posterior uveal melanoma (melanoma malignum choroideae) in 2005 at the Department of Ophthalmology, University of Debrecen. All eyes were enucleated because of the tumor without prior treatment (they were disqualified for brachytherapy). The histological types of the tumors according to Callendar’s classification were: spindle A, dominantly spindle B, and dominantly epitheloid tumor, respectively. The experiments involving human subjects were carried
28
out according to the Helsinki Declaration and with the approval of the Human Studies Ethical Committee, University of Debrecen.
Preparation of the retina
Right after enucleation a dorsal stitch was made for orientation, then a non- infiltrated part of the bulb was removed, and subsequently placed in the fixative (4%
paraformaldehyde, in 0.1 M phosphate buffer, pH 7.4), and incubated for 24 hours at 4°C. Thereafter the solution was replaced with 0.1 M phosphate buffered saline (PBS, pH 7.4), and rinsed for at least 24 hours before further processing. Various parts of the retina have been collected this way, covering the whole retinal field. The retina was carefully detached from the posterior eyecup. Extreme care was taken to obtain samples from the peripheral part of the retina, even from behind the ora serrata. These ciliary and iridic regions cannot be separated from the ciliary body and the iris, so they were handled together. For frozen sections the retinas were incubated overnight in 30%
sucrose (diluted in 0.1 M phosphate buffer), embedded in cryomatrix (ThermoShandon). 10 µm thick radial sections were prepared on a ThermoShandon cryotome. For radial semithin sectioning three samples were taken from the human retina following a radial plane including the macular region (M), periphery (P), ciliary body (CB).
Immunocytochemistry
Sections of 10 µm thickness were cut on a cryostat and dried onto poly-L-lysine coated glass microscope slides at 37°C. Sections were then soaked in phosphate buffered saline for 20 minutes. Subsequently, a blocking solution, 1% bovine serum albumin (BSA) with 0.1% Triton X-100 was applied for 2 hours. The primary antibody was applied at 4°C overnight. Primary antibodies anti-caveolin-1 (polyclonal rabbit IgG, Transduction Laboratories, www.translab.com), 1:100, anti-caveolin-2 (monoclonal mouse IgG, Transduction Laboratories), 1:200, and anti-caveolin-3 (monoclonal mouse IgG, Transduction Laboratories) 1:100, were diluted in 1% BSA at 4°C overnight. In the case of caveolin-1 and -3 anti-rabbit and anti-mouse Alexa 488
29
(Molecular Probes, www.invitrogen.com) were used as secondary antibodies. Since caveolin-2 gave a weak, hardly detectable signal with the previous method, we used biotinylated anti-mouse IgG, then Streptavidin Alexa 488 (Molecular Probes), 1:100, to intensify the signal. Even using this extra method caveolin-2 gave the weakest signal.
For the visualization of the cytoskeleton, Alexa fluor 594-labeled phalloidin (Molecular Probes) was used to stain F-actin (1:100 in PBS). Vectashield HardSet Mounting Medium (Vector Laboratories, www.vectorlabs.com) with DAPI (4′,6-diamidino-2- phenylindole) was used to label the nuclei (blue) and to cover the slides. Control reactions were made using rabbit and mouse normal serum, non-specific primary antibodies and omitting the primary antibodies to preclude non-specific binding. The retinas were inspected on a Zeiss Axiophot microscope, using the appropriate filter set for the fluorescent antibodies. Fluorescent double or triple labeled specimens were also inspected on Radiance 2100 Multi Photon Imaging System coupled to a Nikon Eclipse E800 microscope using LaserSharp 2000. Adobe Photoshop 7.0 and Confocal Assistant softwares were used for the primary image processing.
4. Dogs Animals
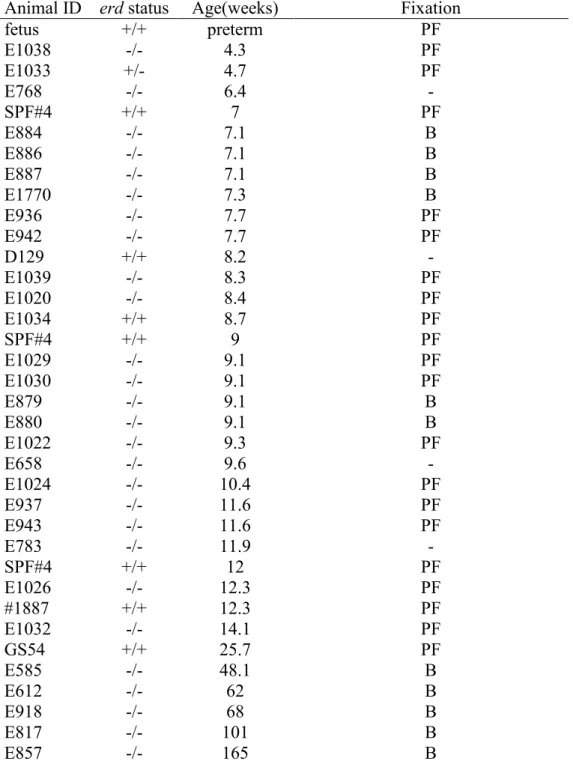
Dogs were maintained at the Retinal Disease Studies (RDS) facility in Kennett Square, PA, and supported by NEI/NIH (EY-06855) and Foundation Fighting Blindness Center grants; procedures were in adherence to the ARVO Resolution for the Use of Animals in Ophthalmic and Vision Research. The dogs represent an out bred population with a common genetic background segregating erd and other retinal disease alleles. 70 dogs were used in the study, including 44 crossbred erd affected dogs (age range, 4.3- 165 weeks),and 26 non-affected dogs that were used as normal control subjects (age range, 4.7–25.7 weeks). All affected dogs were bred at the Retinal Disease Studies Facility (RDSF; University of Pennsylvania,New Bolton Center, Kennett Square, PA), and their genotype wasdetermined either from the known status of their progenitorsor from genetic testing for the disease-causing mutation.All normal control dogs came from the Baker Institute colony of specific pathogen-free dogs. After an ocular examinationto identify abnormalities not associated with the primary retinaldisease, all
30
animals were anesthetized by intravenous injection of pentobarbital sodium, the eyes enucleated, and the dogs euthanatized (Table 3).
Animal ID erd status Age(weeks) Fixation
fetus +/+ preterm PF
E1038 -/- 4.3 PF
E1033 +/- 4.7 PF
E768 -/- 6.4 -
SPF#4 +/+ 7 PF
E884 -/- 7.1 B
E886 -/- 7.1 B
E887 -/- 7.1 B
E1770 -/- 7.3 B
E936 -/- 7.7 PF
E942 -/- 7.7 PF
D129 +/+ 8.2 -
E1039 -/- 8.3 PF
E1020 -/- 8.4 PF
E1034 +/+ 8.7 PF
SPF#4 +/+ 9 PF
E1029 -/- 9.1 PF
E1030 -/- 9.1 PF
E879 -/- 9.1 B
E880 -/- 9.1 B
E1022 -/- 9.3 PF
E658 -/- 9.6 -
E1024 -/- 10.4 PF
E937 -/- 11.6 PF
E943 -/- 11.6 PF
E783 -/- 11.9 -
SPF#4 +/+ 12 PF
E1026 -/- 12.3 PF
#1887 +/+ 12.3 PF
E1032 -/- 14.1 PF
GS54 +/+ 25.7 PF
E585 -/- 48.1 B
E612 -/- 62 B
E918 -/- 68 B
E817 -/- 101 B
E857 -/- 165 B
Table 3. List of normal and diseased dogs used in the study Disease status: +/+, wild type; +/-, erd carrier; -/- erd affected
Fixation: PF= 4% paraformaldehyde fixation and OCT embedding; B= Bouin’s fixation and paraffin embedding, note that 34 dogs are not shown in the list: 21 used for rod
31
outer segment renewal and opsin biosynthesis and 10 for qRT-PCR and 3 control dogs used for Western blotting.
Immunocytochemistry
Retinas of 24 affected dogs in the age range of 4.3-165 weeks were examined morphologically. The retinas of 8 normal or carrier dogs (age range: one fetus, the others 4.7-25.7wks) wereused as control specimens. Immediately after enucleation,the posterior segments were isolated and fixed, using 4% paraformaldehyde in 0.1 M phosphate-bufferedsaline at 4°C. The posterior segments were then cut into pieces that extended from the optic nerve to the ora serrata along the superior and inferior meridians, dehydrated, and embedded in either paraffin or OCT (Tissue Tek Optimal Cutting Temperature, Sakura Fientek, Torrance, CA). OCT sections of 7µm were cut on a Microm HM550 cryostat. Paraffin sections of 7µm were prepared on an American Optical 820 microtome by Excalibur Pathology Incorporation (Oklahoma City, OK).
Sections from both the superior and inferior meridians were examined in a light microscope (Axioplan;Carl Zeiss Meditec GmbH Oberkochen, Germany) in contiguous fields ranging from the optic disc to the oraserrata. This included evaluation of the rod and cone OS and IS, and the thickness of the outer (ONL) and inner (INL) nuclear layers. For each dog, a single section from both quadrants (superior and inferior, respectively) was used for quantitative evaluation of the ONL and INL cells at two specific locations: A1, 2000 ± 500 µm from theoptic nerveand A2, middle point of the retina ±500 µm. At each of these sites, the number of rows of nuclei in theONL and INL were counted in three areas and averaged. For the same areas, the thickness (in micrometers)of the ONL and INL were measured. For illustration of retinal topography and retina development digital images were captured (Spot 4.0 camera, Diagnostic Instruments, Inc., Sterling Heights, MI) and imported into a graphics program (Photoshop and Illustrator; Adobe, Mountain View, CA)for display.
Ten erd (age range, 4.3–14.1 weeks) and 7 normal (agerange, 4.7–25.7 weeks) retinas were used for immunocytochemistry. After enucleation, a slit was made through the globe at the level of the ora serrata, and the entire globewas fixed for 24 hours in 4% paraformaldehyde in 0.1 M phosphate-bufferedsaline at 4°C. The tissue was then trimmed, cryoprotected sequentiallyfor 24 hours in a solution of 15% and 30% sucrose
32
in 0.1 M sodium phosphate buffer and 0.15 M sodium chloride (pH 7.2, phosphate- buffered saline; Pierce, Rockford, IL; referred to in the text as PBS) at 4°C, and embedded in OCT medium. Sections along the superior and inferior retinal meridian of the thirteen erddogs and six normal dogs that were processed as described earlierwere used for fluorescent immunohistochemistry, using cell-specific primary antibodies.
Retinal cell markers and antibodies
Antibody type Normal retinal localization or target protein
Human cone arrestin
(hCAR) rabbit polyclonal cones
PNA-rhodamine lectin lectin cone insoluble matrix
CNGA3 rabbit polyclonal cone OS
Red/green opsin (COS-1) mouse monoclonal IgG3 L/M-cone OS
Red/green opsin goat polyclonal L/M-cone OS
Red/green opsin rabbit polyclonal L/M-cone OS
Blue opsin (OS-2) mouse monoclonal IgG3 S-cone OS
Blue opsin goat polyclonal S-cone OS
Blue opsin rabbit polyclonal S-cone OS
Rhodopsin mouse monoclonal IgG1 rod OS
Rhodopsin rabbit polyclonal rod OS
Glutamine Synthetase mouse monoclonal IgG2b Müller cells
CD18 (CA16:3C10) mouse monoclonal IgG1 canine monocytes, granulocytes, microglia
CRABP rabbit polyclonal Müller cells
PCNA mouse monoclonal IgG2a proliferating cell nuclear antigen KI67 monoclonal mouse IgG1 nuclear cell proliferation antigen Phospho Histone H3 (Ser 10) rabbit polyclonal mitosis
Phospho Histone H3 (Ser 10)(6G3)
mouse monoclonal mitosis TUNEL In Situ Cell Death
Detection Kit, Fluorescein
apoptotic cell nuclei Nestin, clone 10C2 mouse monoclonal IgG1 neuronal stem cells NR2E3
NRL PAX6
rabbit polyclonal rabbit polyclonal rabbit polyclonal
Nr2e3 Nrl
amacrine and ganglion cells, neuronal progenitors
Protein kinase C (PKCα) mouse monoclonal IgG2b Rod bipolar cells
Goα mouse monoclonal IgG1 ON (rod and cone) bipolar cells
Calretinin rabbit polyclonal Horizontal cell and amacrine cells Calbindin D-28K rabbit polyclonal Horizontal cells
Neurofilament 200 kDa mouse monoclonal IgG1 Horizontal dendrites, ganglion cells, neurofilaments
Vimentin mouse monoclonal IgG2bκ Müller cells
GFAP rabbit polyclonal Müller cells, astrocytes
RDS/peripherin 3B6 mouse monoclonal IgG rod and cone OS
CRX rabbit polyclonal Crx
Actin rabbit polyclonal loading control
33
Table 4. A list of antibodies and other retinal cell markers used on dog retinas for immunocytochemistry.
Cryosections (7µm thick) wereincubated with the primary antibodies overnight at either 4°C or 1h on room temperature after a blockingstep with 1.5% BSA/PBS, 0.25%
Triton X-100 (Sigma-Aldrich, St.Louis, MO). The antigen–antibody complexes were visualized with fluorochrome-labeled secondary antibodies (Alexa Fluor, 1:200;
Invitrogen, Carlsbad, CA). DAPI stain was used to detect cell nuclei. Slides were mounted with a medium composed of polyvinyl alcohol and DABCO(1,4 diazobizyklo- [2.2.2]oktan) (Gelvatol; Sigma-Aldrich, St. Louis, MO), and examined with an epifluorescence microscope (Axioplan; Carl Zeiss Meditec). Images were digitally captured (Spot 4.0 camera; Diagnostic Instruments, Inc.) and imported into a graphics program (Photoshop; Adobe, Mountain View, CA) for display.
Primary antibodies and other cell markers used to detect various retinal cell types or target proteins are detailed in Table 4. The latters include: cones: human cone arrestin, CNGA3 (cyclic nucleotide gated channel alpha 3), red/green cone opsin, blue cone opsin; rods: rod opsin; Müller cells, microglia and macrophages: GS (glutamine synthetase), CD18 (integrin beta-2); cell proliferation, retinal stem cells: PCNA (proliferating cell nuclear antigen), KI-67 (Kiel-67), PHH3 (phospho-Histone H3), Nestin; transcription factors: PAX6 (paired box protein 6), NR2E3 (or PNR, photoreceptor-specific nuclear receptor), NRL (neural retina leucine zipper). Apoptotic nuclei were visualized by TUNEL (terminal deoxynucleotidyl transferase-mediated biotinylated UTP nick end labeling) with the In Situ Cell Death Detection kit (Roche Applied Science, Indianapolis, IN). Antigen retrieval was performed prior to PCNA and PHH3 labeling by heating in the presence of Antigen Unmasking Solution, High pH (Vector Laboratories, Burlingame, CA) using a microwave oven at 10% power.
Both single and double immunolabelings were used. The primary antibody pairs used for double immunolabeling were combinations of rabbit or goat polyclonal and mouse monoclonal antibodies. The antigen–antibody complexes were visualized with fluorochrome-labeled secondary antibodies (Alexa Fluor, 1:200; Invitrogen, Carlsbad, CA), and 4',6'-diamino-2-phenylindole (DAPI) stain was used to label cell nuclei. Slides were mounted with a medium composed of polyvinyl alcohol and DABCO (1,4 diazobicyklo-[2.2.2]oktan, Gelvatol; Sigma-Aldrich), and examined with an
34
epifluorescence microscope (Axioplan; Carl Zeiss Meditec, Thornwood, NY).
Epifluorescence or transmitted light images were captured with a Spot 4.0 camera (Diagnostic Instruments, Inc., Sterling Heights, MI) and imported into a graphics program (Photoshop and Illustrator; Adobe, San Jose, CA) for display. When precise localization of markers was needed, sections were also imaged by confocal microscopy using a Nikon A1R Laser Scanning Confocal Microscope with DUS 32 Spectral detector (Nikon Instruments, Melville, NY) through a 63 X Plan objective lens. The specimens were excited at 488 and 561 nm, respectively, with multi line Argon and DPSS lasers.
For cell death and cell proliferation studies the following number of dog retinas were prepared: TUNEL assay 11 erd (age range, 4.3-14.1 weeks), 5 normal (age range, 4.7-12wks); PCNA 7 erd (age range, 4.3-14.1 weeks), 3 normal (age range, 7-12 weeks); PHH3 labeling 2 erd (ages 7.7 wks and 11.6 wks) and 1 normal (7 wks of age).
PHH3 labeling was used to differentiate mitotic cells from those undergoing DNA repair labeled with PCNA. The tissues were prepared the same way as described before for immunocytochemistry. Sections were counterstained with 4',6'-diamino-2- phenylindole (DAPI). Positive control specimens included sections pretreated with DNase I (3 U/mLin 50 mM Tris-HCl [pH 7.5]) and 1 mg/mL BSA for 10 minutes at room temperature). For negative control subjects, the terminaltransferase enzyme was omitted from the TUNEL reaction mixture. Histone H3 was used as a control to confirm the specificity of TUNEL labeling. Before PCNA and PHH3 labeling, antigen retrieval was performed: by heating and irradiating the sections for 10’ in Antigen Unmasking Solution, High pH (Vector Laboratories Inc., Burlingame, CA) using a microwave oven at 10% power. For PCNA labeling a dog fetus was used as a positive control. The specificity of PCNA labeling was also confirmed by KI 67 labeling, which was described earlier as a good cell proliferation marker in dogs (Beltran et al 2006).
Sections were examined from the optic disc to the ora serrata by epifluorescence microscopy with the 40x objective. Images were digitally captured (Spot 4.0 camera;
Diagnostic Instruments, Inc.) and imported into a graphics program (Photoshop, Mountain View, CA)for display.TUNEL-. PCNA- and PHH3-labeledcells in the ONL were counted throughout the entire length ofthe section (i.e., from disc to ora serrata).
In determiningthe proportion of photoreceptor cells that undergo cell deathas a function
35
of time, we express our results as the numberof TUNEL-, PCNA and PHH3 labeled photoreceptor cells per 1 million µm2 of ONL.The area of the ONL of each section was obtained by measuringthe entire length of the ONL from optic disc to ora serrata,and multiplying it by the average thickness of the ONL throughoutthe section (mean value of the thickness measured in the tenlocations, evenly distributed along the retina). For each dog, this procedure was performed at least in triplicate with sequential sections from both the superior and inferiormeridian. The values were averaged and reported as the mean 1± SD.
Immunoblotting and densitometric analysis
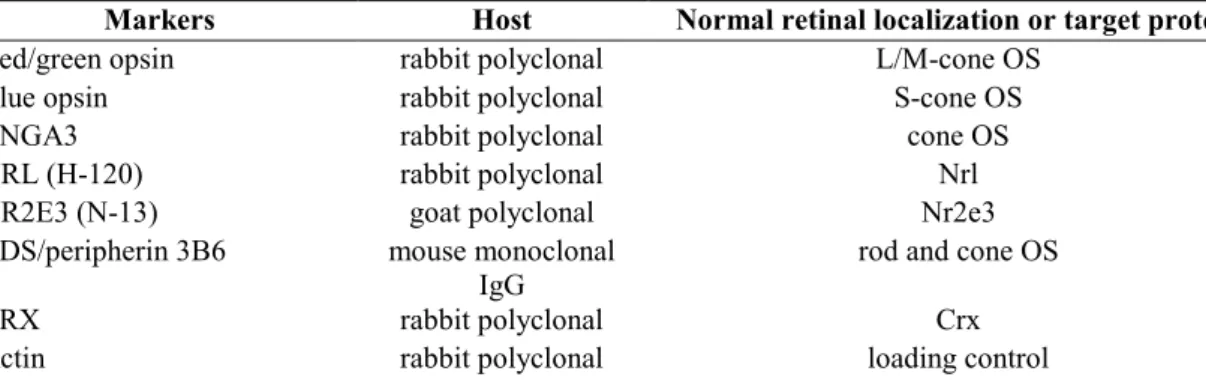
Dogs of different ages were used for these studies including 2 erd affected dogs (6.4 wks and 9.9 wks) and 3 controls (16 wks). Equal amounts of total protein as determined by BCA Protein Assay Kit (former Pierce Biotechnology, now Thermo Fisher Scientific, Rockford, IL) were separated by 10% SDS-PAGE under reducing conditions, immunoblotted and probed with antibodies. These are detailed in Table 5 and include antibodies against red/green opsin, blue opsin, CNGA3, NRL, NR2E3, RDS/peripherin, and CRX. Appropriate HRP-conjugated secondary antibodies were used subsequently, and an antibody against β-actin was used as a loading control.
Densitometric analysis of the blots was performed on Kodak Image Station 4000MM (Molecular Imaging Systems, Carestream Health, Rochester, NY). The net intensity was corrected for background intensity observed. Values in figure are expressed as corrected net intensity of the sample normalized to corrected net intensity of actin loading controls. Densitometry data were analyzed using Sigma Stat Version 3.1, and intensities from four independent measurements on two westerns were analyzed by Student t test using 95% or 99% confidence intervals.
36
Markers Host Normal retinal localization or target protein
Red/green opsin rabbit polyclonal L/M-cone OS
Blue opsin rabbit polyclonal S-cone OS
CNGA3 rabbit polyclonal cone OS
NRL (H-120) rabbit polyclonal Nrl
NR2E3 (N-13) goat polyclonal Nr2e3
RDS/peripherin 3B6 mouse monoclonal
IgG rod and cone OS
CRX rabbit polyclonal Crx
Actin rabbit polyclonal loading control
Table 5. List of antibodies used for immunoblotting of dog retinas.
Rod outer segment renewal and opsin biosynthesis
Rod OS renewal and opsin biosynthesis were examined at specific time points following the injection of 3H-fucose or 3H-leucine (OS renewal) or a combination of 3H- fucose/14C-leucine (opsin biosynthesis) into the vitreous of anesthetized dogs using previously described methods.(Aguirre and O'Brien, 1986) Post-injection time points were 1, 2, 3 and 4 days for OS renewal, and 1, 2 and 4 days for opsin biosynthesis. In the 4 day interval following injection, the rods have renewed ~50% of their OS due to continuous addition of new discs at the base (Aguirre and O'Brien, 1986) For the renewal studies, the eyes were fixed in mixed-aldehyde/osmium solution, embedded in plastic resin, and 1 µm thick sections coated with a photographic emulsion and maintained at 40 C in the dark until developed.(Aguirre and O'Brien, 1986). Two series of experiments were conducted to examine opsin biosynthesis, and loss of opsin labeling over time after injection. For these studies, eyes received a combination of 3H- fucose and 14C-leucine intravitreally. Eyes from dark adapted dogs were enucleated under dim red light, and crude rod outer segment preparations were made by vortexing and centrifugation in 40% (w/v) sucrose. After sonication, detergent solubilized rod OS proteins were separated in a 10% polyacrylamide gel, stained with Coomassie blue, and gel slices digested and counted in a scintillation counter (Aguirre and O'Brien, 1986).
Disintegrations per minute (DPM) in the opsin peaks were normalized to the highest protein value for each set of gels, and to the DPM count for the post injection day 1 control eye of the same series.
37 Gene expression studies
Quantitative real time-PCR (qRT-PCR) was used to assess expression of selected genes at different time points of normal development (3 (n=3) and 7 (n=3) wks) and disease (6.4 (n=2), 8.3/9.9 (n=3) and 11.9/14.1 (n=2) wks). Retinas from 16 wk (n=3) normal dogs served as reference control. Total RNA was isolated by Trizol extraction (Invitrogen-Life Technologies, Carlsbad, CA), and concentration measured with a Nanodrop 1000 spectrophotometer (Thermo Fisher Scientific, Wilmington, DE). RNA samples were treated with RNase-free DNase (Ambion, Austin, Tx), and two µg total RNA from each sample was used for cDNA synthesis using the High Capacity cDNA reverse transcriptase Kit (Applied Biosystems (ABI), Foster City, CA). Quantitative RT-PCR was performed on a 7500 Real Time PCR System and software v2.0 (ABI) using 30 ng cDNA from each sample, and amplified using Taqman assays with canine- specific ABI inventoried probes for STK38L/NRD2, LATS1 (Cf02626754_m1) and CCNA1 (Cf02633425_m1); SYBR green analysis was used for CCND1 (Forward:
CATCTACACTGACAACTCCATCC; Reverse: CAGGTTCCACTTCAGTTTGTTC).
For analysis of STK38L/NRD2 one probe was located within the exonic deletion (Cf02709228_m1), and the second in exon 6, 3' to the exon 4 splicing defect, and used to exclude alterations in splicing resulting from the SINE element insertion (Cf02634613_m1). CT values of each gene were normalized to GAPDH, and comparisons between groups were done with the ΔΔCT method(Livak and Schmittgen, 2001). Statistical significance between different groups in comparisons to the 16 wks old normal control retinas was assessed with an unpaired t-test, and expressed as statistically significant (p< 0.05) or towards statistical significant (0.05 < p<0.1).
38
V. Results
1. Expression of lipid raft-associated proteins during photoreceptor development
Similarly to other rodents, the hamster retina is undeveloped at birth (Greiner and Weidman, 1978). Syrian hamsters are born blind, the eyes open only at the end of the second postnatal week. On the first postnatal day (P1) the retina consists of three cell layers: retinal pigment epithelium (RPE), neuroblastic layer (NBL) and the ganglion cell layer (GCL). The immature inner plexiform layer (IPL) and optic nerve layer are also present. The neuroblastic layer is predominantly made of neuroblasts;
however, a few nuclei reminiscent of cone nuclei located adjacent to the outer limiting membrane (OLM) can also be discerned. Outer- and inner segments (OS/IS) are not yet formed, but a slight protrusion of the apical portion of prospective photoreceptor cells above the level of the OLM can be clearly observed at a few places with electron microscopy (EM). Here, apically located centrioles are also present (Figure 6, A and B).
At P5 the structure of the retina is similar to P1, but electron microscopy reveals that the distal regions of photoreceptors start to enlarge (prospective inner segments, Figure 6, C and D). At P10 the NBL has already been separated, by a thin, immature outer plexiform layer (OPL), into outer- and inner nuclear layer, and the IPL has widened.
Photoreceptor OS and IS are not clearly defined with light microscopy, but using electron microscopy immature IS and OS are already recognizable at P10. The IS are small and in the OS the stacks of primitive discs show a random orientation. At P15 the retina of the hamster is similar to that of the adult (see Figure 11, Panel B). The OPL is still very thin, but is more straight and organized than it was at P10, while the IPL is morphologically mature. The OS and IS are distinguishable, but their size is smaller, than in the adult. With electron microscopy, OS and IS are relatively small, but structurally differentiated. In the OS discs are packed parallel to each other and are arranged horizontally (Figure 6, E and F).