Orthorexia nervosa: A behavioral complex or a psychological condition?
JANA STRAHLER*, ANDREA HERMANN, BERTRAM WALTER and RUDOLF STARK Psychotherapy and Systems Neuroscience, Justus-Liebig-University Giessen, Giessen, Germany (Received: May 29, 2018; revised manuscript received: October 15, 2018; accepted: November 22, 2018)
Background and aims:Numerous studies have provided evidence for orthorexia nervosa (ON), an eating pattern characterized by an almost manic obsession for andfixation on healthy eating, to be of epidemiological relevance.
However, there is scientific debate on whether it is merely a behavioral or lifestyle phenomenon as compared to a mental disorder. Aim of this cross-sectional study was to explore whether ON is of epidemiological and clinical relevance, and whether ON can be distinguished from other mental health disorders and healthy lifestyle features.
Methods:An online survey including a measure of orthorexic behaviors [Duesseldorf Orthorexia Scale (DOS)], well- being and distress, eating behaviors, pathological eating, anxiety and depression, addictive behaviors, obsessive– compulsive symptoms, personality, and health behaviors was completed by 713 subjects (79.8% women, 18–75 years, median age: 25 years).Results:Twenty-seven subjects (3.8%, 21 women) showed significant orthorexic eating (DOS≥30). ON cases reported lower well-being, lower satisfaction with life, and higher current stress levels than non-ON cases. The highest percentage of variation in ON was explained by pathological eating (R2=.380), followed by eating style, Mediterranean diet, compulsive symptoms, and subjective social status. Importantly, ON provided hardly any additional predictive value for well-being when also considering pathological eating. Discussion and conclusions:Our data confirmed the epidemiological and clinical relevance of orthorexic behaviors, but the strong conceptual overlap with other mental health problems and pathological eating raise initial doubts as to whether ON is a distinct mental health disorder category. This co-occurrence, unique symptoms, and underlying processes need further exploration by comparing ON cases with patients with other mental disorders.
Keywords:orthorexia nervosa, eating disorder, obsessive–compulsive disorder, affective disorder, lifestyle
INTRODUCTION
There is increasing popularity of eating trends that focus on healthiness (e.g., superfoods) or purity (e.g., clean eating and paleolithic diet). In the late 1990s, Steven Bratman, a practi- tioner of alternative medicine, coined the term “orthorexia nervosa”(ON) to describe an eating pattern characterized by an almost pathologicalfixation on and obsession for healthy eating (Bratman, 1997). Preliminary criteria for the diagnosis of ON were proposed in 2004 (Donini, Marsili, Graziani, Imbriale, & Cannella, 2004). Thefirst proposals for an official diagnosis of ON were based on a US-American case study published in 2015 (Moroze, Dunn, Holland, Yager, &
Weintraub, 2015) and a review on the issue of ON by Barthels, Meyer, and Pietrowsky (2015b). Dunn and Bratman (2016) reiterated these criteria and refined them. The provi- sional main criteria of ON are an obsessive focus on“healthy” eating and avoidance of“unhealthy”foods, mental preoccu- pation regarding dietary practices, and very rigid dietary rules with violations causing exaggerated emotional distress (fear of disease, anxiety, shame, and negative physical sensations).
Food choices are not based on the criterion of quantity or how to best lose weight, yet the primary goal is quality in order to promote optimum health. While there is an ongoing debate about whether to consider ON simply as a new lifestyle
phenomenon rather than a disease (Bratman, 2017;Kummer, Dias, & Teixeira, 2008;Pietrowsky & Barthels, 2016), anec- dotal reports of physical (malnutrition and weight loss), psychological (fatigue and emotional instability), and social consequences (social isolation, diminished quality of life, and stigma) comply with current concepts of mental disorders (Moroze et al., 2015;Nevin & Vartanian, 2017;Park et al., 2011;Saddichha, Babu, & Chandra, 2012). However, neither the current version of the International Statistical Classifica- tion of Diseases and Related Health Problems (WHO) nor thefifth edition of theDiagnostic and Statistical Manual of Mental Disorders (APA) consider ON as an independent mental disorder. Missing definitions of what is considered normal eating behavior complicate longitudinal studies on assumed clinical consequences, studies on pathological mech- anisms, and research reflecting ON to be distinct from other symptom patterns. Overlap with eating disorders, obsessive– compulsive disorders (OCDs), and affective disorders (Koven
& Abry, 2015) hamper its diagnostic classification.
* Corresponding author: Dr. Jana Strahler; Psychotherapy and Systems Neuroscience, Justus-Liebig-University Giessen, Otto-Behaghel-Str. 10H, 35394 Giessen, Germany; Phone: +49 641 99 26332; Fax: +49 641 99 26309; E-mail: jana.strahler@
psychol.uni‑giessen.de
This is an open-access article distributed under the terms of theCreative Commons Attribution-NonCommercial 4.0 International License, which permits unrestricted use, distribution, and reproduction in any medium for non-commercial purposes, provided the original author and source are credited, a link to the CC License is provided, and changes–if any–are indicated.
DOI: 10.1556/2006.7.2018.129 First published online December 17, 2018
Is ON of epidemiological relevance?
ON epidemiological research is limited regarding the definition of cases (i.e., a reliable and valid assessment tool has not yet become established) and regarding the selec- tion of populations (i.e., mainly data from European high- risk populations). At present, the orthorexia nervosa-15 (ORTO-15;Donini, Marsili, Graziani, Imbriale, & Cannella, 2005) is the internationally mainly used self-report ques- tionnaire. However, point prevalence rates between 4% in its original publication and up to 90% in other studies (de Souza & Rodrigues, 2014; Donini et al., 2005) raise doubts about this tools’validity (Missbach, Dunn, & König, 2016). When also asking for the personal relevance of eating as well as health problems and limitations in everyday life, prevalence rates of orthorexic eating behaviors drop to under 1% (Dunn, Gibbs, Whitney, & Starosta, 2017). In addition, new methods have been introduced including the Duesseldorf Orthorexia Scale (DOS; Barthels, Meyer, &
Pietrowsky, 2015a). Using this scale, cross-sectional rates for ON are estimated between 1% and 7% in the general population and among university members, respectively (Barthels et al., 2015a; Barthels & Pietrowsky, 2012;
Luck-Sikorski, Jung, Schlosser, & Riedel-Heller, 2018).
Is ON of clinical relevance?
Most of the current knowledge on the clinical relevance, that is, impairment and/or distress of ON, arises from single case studies (Moroze et al., 2015; Park et al., 2011;Saddichha et al., 2012). While these reports clearly support the notion of ON being of clinical significance in regard to physical, psychological, and social consequences, only few empirical studies have examined ON-related impairment. In particu- lar, studies showed small to moderate associations between orthorexic eating behaviors and psychological variables, such as perfectionism, narcissism, weight and shape con- cern, pathological eating attitudes, obsessive–compulsive behaviors, and subjective impairment (Barnes & Caltabiano, 2017; Barthels et al., 2015a; Brytek-Matera, Rogoza, Gramaglia, & Zeppegno, 2015; Hayes, Wu, De Nadai, &
Storch, 2017; Koven & Senbonmatsu, 2013; Oberle, Samaghabadi, & Hughes, 2017). To date, there is a lack of longitudinal approaches examining medical and psychi- atric complications of ON.
Are proposed ON criteria sufficient for a distinct disorder?
The claim of ON being a distinct mental disorder is the subject of controversial debate. ON has been regarded an independent clinical disorder (Koven & Abry, 2015), a manifestation or epiphenomenon of an eating dis- order (Brytek-Matera, 2012; Mader, 2004), an OCD (Meyer-Groß & Zaudig, 2007), or merely a social trend (Håman, Barker-Ruchti, Patriksson, & Lindgren, 2015).
Some studies showed high ON prevalence rates (40%– 80%) among patients suffering from anorexia nervosa or bulimia nervosa (Barthels, Meyer, Huber, & Pietrowsky, 2017a,2017c). On the contrary, other studies showed equal numbers of ON cases in female anorexia nervosa patients and healthy controls (Brytek-Matera, 2014; Gramaglia,
Brytek-Matera, Rogoza, & Zeppegno, 2017). Interestingly, results of a study comparing eating disorder patients before and after therapy showed increased orthorexic tendencies at the end of therapy. Thisfinding suggests that ON might be regarded as a compensatory behavior –moving the focus from quantity toward the quality of food (Segura-Garcia et al., 2015). Furthermore, studies on OCD patient samples have indicated that ON prevalence rates are low (and comparable to the general population) in this disorder (Barthels et al., 2017a,2017c). On the contrary, studies in healthy samples showed some overlap between orthorexic and obsessive–compulsive symptoms (Arusoglu, Kabakçi,˘ Köksal, & Merdol, 2008; Bundros, Clifford, Silliman, &
Morris, 2016;Hayes et al., 2017;Oberle et al., 2017). On the whole, there is initial evidence that ON is different from conventional eating disorders as well as from OCD. How- ever, it is still slightly tentative to consider ON to be distinct from eating disorders or OCD.
Do ON criteria demarcate a clear difference from other behaviors?
Several researchers discuss sociocultural influences on ON and consider ON a lifestyle phenomenon. In particular, interest in a healthy diet,fitness, and a healthy lifestyle in general has been related to orthorexic tendencies (Håman et al., 2015;
Turner & Lefevre, 2017). Several studies have demonstrated that some restrictive forms of diet and an orientation toward health and fitness are considerably prevalent among ON (Barthels, Meyer, & Pietrowsky, 2018; Brytek-Matera, 2014; Brytek-Matera, Donini, Krupa, Poggiogalle, & Hay, 2015;Oberle, Watkins, & Burkot, 2018). Importantly, as none of the current assessment tools consider culturally specific nutritional behavior, conclusions in regard to sociocultural and healthy lifestyle features remain preliminary.
Aim of the study
The aim of this report was to add further evidence to the claims that (a) ON is a diagnostic entity of epidemiological and clinical relevance, (b) ON is different from other mental health disorders, and (c) ON can be distinguished from other restrictive forms of diet and healthy lifestyle features.
Answering these claims will also characterize co-occurring characteristics of individuals who show orthorexic tenden- cies. Moreover, this characterization will help to better define what is and what is not part of ON.
METHODS
Participants and data collection
Potential participants were contacted through public advertisements in local shops and via mailing lists from the universities in the broader Giessen/Marburg area from February to April 2017. Furthermore, online platforms and social networks were used for recruitment. Participants were asked to respond to an Internet survey (online platform SoSci Survey; www.soscisurvey.de/) taking about 30 min to com- plete. The survey included measures of orthorexic behaviors,
well-being and distress, eating behaviors, pathological eating, anxiety and depression, addictive behaviors, obsessive– compulsive symptoms, personality as well as sociodemo- graphic and health behaviors. The survey was announced as an investigation of“Health behavior, eating habits, and well- being.”The link to the online survey was used 2,750 times (including accidental double clicks) and a total of 716 parti- cipants (26.0%) completed the survey. N=3 data sets were excluded due to reporting“other”in regard to gender (n=2) or age<18 (n=1). Analyses are thus based on 713 complete data sets.
Measures
Orthorexia nervosa. Orthorexic eating behavior was assessed using the 10-item DOS (Barthels et al., 2015a).
The DOS was validated in a German sample of 1,340 subjects and has good internal consistency (Cronbach’s α=.84) and acceptable retest reliability (3×, 3 months in between, r’s=.67 and .79). In this study, Velicer’s minimum average partial test confirmed one common factor as optimal solution to the number of DOS components, Cronbach’s α was good (.87; in the following, reported coefficients refer to the sample reported herein.) and all items had a good item-total correlation (all >.48). Partici- pants had to report on orthorexic symptoms (e.g., “I feel upset after eating unhealthy food.”) on a 4-point scale ranging from “1–does not apply to me”to“4–applies to me.”A preliminary cut-off of 30 points was suggested by the authors to reflect orthorexic eating behavior (DOS sum scores range between 10 and 40 points).
Well-being and distress. Well-being and distress were examined using the following scales: the 5-item World Health Organization Well-Being Index (WHO-5; Staehr, 1998; Cronbach’sα=.83), the single item scale L-1 for the assessment of life satisfaction (Beierlein, Kovaleva, Lászl ´o, Kemper, & Rammstedt, 2014), the 13-item short version of the Resilience Scale (RS-13; Leppert, Koch, Brähler, &
Strauß, 2008; Cronbach’sα=.89), and the 10-item version of the Perceived Stress Scale (PSS-10;Cohen, Kamarck, &
Mermelstein, 1983;Klein et al., 2016; Cronbach’sα=.87).
The WHO-5 assesses subjective psychological well-being by asking the respondent to rate five positively framed statements considering the past 2 weeks (e.g., “I have felt calm and relaxed”). Scaling from“0–at no time”to“5–all of the time”results in possible sum scores between 0 and 25, which are then multiplied by 4 to lead to final scores between 0 (worst imaginable well-being) and 100 (best imaginable well-being; due to a programming error, this study employed a 5-point Likert scale. Resulting sum scores were therefore multiplied by five to convert values onto a 0 to 100 scale). The L-1 scale is a single-item measure assessing general satisfaction with life (“How satisfied are you with your life, all things considered?”) on a bipolar scale with the anchors ranging from“1–not at all satisfied” to “10 – completely satisfied.” Retest reliability of the measure for an interval of 6 weeks is acceptable (r=.67;
Beierlein et al., 2014). The RS-13 was employed to examine resilience as a positive characteristic of an individual’s ability to adapt to negative emotions and stressful life events. This scale asks respondents to rate 13 items on a
7-point response scale (ranging from“1–strongly disagree” to “7 – strongly agree”) summing up to scores between 13 and 91. The PSS is one of the most widely used measures of perceived stress. Respondents have to rate their stress levels during the past month (“0 – never,” “1 – almost never,” “2–sometimes,” “3–fairly often,”and“4–very often”) and sum scores are created.
Pathological eating. To assess pathological dietary habits, we employed the susceptibility to external cues (5 items; e.g.,“If I see others eating, I have a strong desire to eat too”) and the emotional eating scale (5 items; e.
g.,“When I feel lonely, I console myself by eating”) from the Weight-Related Eating Questionnaire (WREQ; Schem- bre, Greene, & Melanson, 2009; Cronbach’s α=.88).
Averages of the summed item scores, 5-point scale from
“1–not at all”to“5–completely,”are calculated. Global eating disorder pathology was assessed using the 8-item brief version of the Eating Disorder Examination–Questionnaire (EDE-Q8;Kliem et al., 2016; Cronbach’sα=.91). Equiva- lent to the original 28-item EDE-Q, the EDE-Q8 consists of the subscalesrestraint, eating concern, weight concern, and shape concern. Items are rated on a 7-point scale (ranging from“1–no day”to“7–every day”) for the past 28 days. At present, there are no cut-offs for the short version, but an average score above 2.5 is considered a sensitive and specific threshold to identify clinically relevant symptoms of an eating disorder among non-clinical samples (Machado et al., 2014;Rø, Reas, & Stedal, 2015).
Affective disorder screening. To monitor the severity of depressive symptoms, we employed the 9-item depression module of the Patient Health Questionnaire (PHQ-9;
Kroenke, Spitzer, & Williams, 2001; Cronbach’sα=.86).
Respondents rate specific complaints and impairments for the past 2 weeks from “0–not at all”to“3–nearly every day” and sum scores are created. The Hospital Anxiety and Depression Scale (HADS; Zigmond & Snaith, 1983;
Cronbach’sα=.87) served as an additional screening tool to examine depression and anxiety. For each scale, seven items are answered on a 4-point (0–3) response category resulting in possible sum scores between 0 and 21. Current mental illness, current therapy, and current psychotropic drug use were indicated by simple“yes”or“no”questions.
Substance-related addictive behaviors. As there are instruments for the measurement of substance-related addic- tions, we used the Fagerström Test for Nicotine Dependence (Fagerström, 2011; Cronbach’s α=.64), the Alcohol Use Disorders Identification Test (AUDIT; Babor, Higgins- Biddle, Saunders, Monteiro, & World Health Organization, 2001; Cronbach’sα=.72), and we additionally asked par- ticipants about their current drug use (“yes”or “no”ques- tion). The 6-item Fagerström Test measures the degree of physical dependence to tobacco smoking (e.g., “Do you smoke more frequently in the morning?”). The potential range for this test is 0–10, non-smokers were treated as having a score of“0,”and sum scores above 4 are consid- ered “significantly dependent.”The AUDIT offers an easy 10-item screening method (e.g.,“How often do you have six or more drinks on one occasion?”) for excessive drinking and alcohol-use disorders. Scores below 8 are considered low risk, scores above 8 represent hazardous drinking, and scores higher than 15 indicate alcohol dependence.
Obsessive and compulsive symptoms. The Yale–Brown Obsessive–Compulsive Scale (Y-BOCS; Goodman et al., 1989; Cronbach’s α=.93) was originally developed as a semi-structured interview to rate obsessions and compulsions with respect to the dimensions time spent or occupied, resistance, control, interference with functioning or relation- ships, and degree of distress. Subjects affirming our two screening questions asking for the presence of obsessions and compulsions and attempts to do something about it were presented with an adapted shortened 10-item self-report version of the Y-BOCS. Subjects self-rated each question from “0 –no symptoms”to “4 –extreme symptoms.” We created an overall sum score (0–40) and subscale scores for obsessions (0–20) and compulsions (0–20). Overall scores above 16 (or scores above 10 on either sub index) indicate clinical relevant obsessive–compulsive symptoms; scores above 30 are considered severe OCD (Goodman et al., 1989).
Nutritional behaviors. To estimate adherence to the Mediterranean form of diet, often associated with beneficial effect for health (Martínez-González et al., 2012), the 14 item Mediterranean Diet Assessment Tool as used in the Prevenci ´on con Dieta Mediterránea (www.predimed.es) study was employed (MEDAS; Schröder et al., 2011). Of note, our survey did not include the question on“traditional sauce of tomatoes, garlic, onion, or leeks sautéed in olive oil.”Instead, we asked for the subject’s adherence to the Mediterranean form of diet on a 5-point scale from“1–not at all”to“5–a lot.”Each question was scored with 0 or 1.
In more detail, subjects received 1 point in the following cases: rating the adherence item with“≥3,”using olive oil as the principal source of fat when cooking, preferring white meat over red meat, using ≥4 tablespoons olive oil/day, having≥2 servings of vegetables/day, consuming≥3 pieces of fruit/day, having<2 servings of red meat or sausages/day, having<2 servings of animal fat/day, consuming<2 cups of sugar-sweetened beverages/day, having≥7 servings of red wine/week, having ≥3 servings of pulses/week, having≥3 servings of fish/week, consuming<4 commercial pastries/
week and having ≥3 servings of nuts/week (sum score range: 0–14). In addition to the MEDAS items, eating style was assessed using a single question with the response options vegan, vegetarian, semi-vegetarian, that is, eating meat only occasionally, andomnivore.
Healthy lifestyle. Additionally assessed was regular physical activity via the General Practice Physical Activity Questionnaire (GPPAQ;Department of Health, 2009). The GPPAQ considers physical activity during working hours and during leisure time. It provides a four-level physical activity index categorizing subjects as active, moderately active, moderately inactive, and inactive. In addition, a question about regular medical and dental checkups (from
“1–never”to“5–very often”) was asked.
Sociodemographics. Questions on anthropometric and sociodemographic variables comprised weight and height to compute body mass index (kg/m2) and define weight status (according to current recommendations;CDC, 2017), age, gender, relationship status, number of children, highest education, current employment, and the MacArthur scale of subjective social status (Adler & Stewart, 2007). By using a numbered 10-point stepladder image, this scale intends to capture perceived social status. Higher scores indicate a higher subjective social rank. Cross-sectional and
longitudinal studies support the ladder’s usefulness in clari- fying variance of the relationship between socioeconomic factors and health (Adler, Epel, Castellazzo, & Ickovics, 2000;Singh-Manoux, Marmot, & Adler, 2005).
Statistical analysis
We conducted both dimensional and categorical analyses and relied mainly on cross-tables andt-tests for variance in heterogeneous populations, as well as correlation and re- gression analyses. For the purpose of answering our aims, the following analyses were conducted and specific effect sizes were calculated:
(1) ON is a diagnostic entity of epidemiological and clinical relevance: Exploratory data analysis provid- ed main characteristics of DOS sum scores. ON and non-ON subjects (cut-off score: 30) were compared in regard to sociodemographic data and anthro- pometric measures using t-tests and frequency analyses. In addition, the well-being and distress measures (WHO-5, L1, RS-13, and PSS-10) were compared between groups.
(2) ON is different from other mental health problems:
ON and non-ON subjects were compared in regard to disordered eating (WREQ and EDE-Q8), addictive behavior (Fagerström, AUDIT, and current addictive drug use), mental health (PHQ-9, HADS, current mental illness, current psychotherapy, and current psychotropic drug use), and OCD symptoms (Y-BOCS) using univariate analyses of variances, t-tests, and frequency analyses. Syndrome overlap was examined using (stepwise) linear regression anal- ysis. Sets of predictors (pathological eating, addictive behaviors, affective pathology, obsessive and com- pulsive symptoms) were separately tested in predict- ing the DOS sum score. To determine the conceptual overlap of the DOS items with pathological eating (i.e., the WREQ and EDE-Q8 subscales susceptibility to external cues, emotional eating, restraint, eating concern, weight concern, and shape concern), Pearson’s product–moment correlations and multiple regressions were used to examine relative agreement.
(3) ON can be distinguished from other (restrictive) forms of diet and healthy lifestyle features: Whether ON owns specific characteristics was analyzed by comparing ON and non-ON subjects in regard to health-related and nutritional behaviors (GPPAQ, checkups, MEDAS, and eating style).
(4) Afinal stepwise linear regression analysis included pathological eating in step 1, variables distinguishing between ON and non-ON found in the previous analyses were entered in step 2 (forward method) to predict DOS sum scores. As such, the less useful predictors were removed until change ofR2was no longer significant thereby identifying the most significant risk factors.
Ethics
According to the current version of the Declaration of Helsinki, participation was entirely voluntary and anony- mous, and could be terminated at any time for any reason.
All subjects were informed about the study and provided informed consent before conducting the survey. Participants were not directly financially compensated (except course credit for students) but were invited to take part in a lottery with a chance of winning 3×50€gift certificates. Contact data were stored separately from questionnaire data to ensure anonymity. The study was approved by the institu- tional review board.
RESULTS
Epidemiological and clinical relevance of ON
Our sample included a large number of women (79.8%) and subjects with higher education (93.7% A-levels, 33.3%
students). With a mean age of 29.4±11.2 years (range:
18–75 years, median: 25 years) and mean body mass index of 23.1±4.2 (range: 15.2–50.8, median 22.1 kg/m2), our sample was, as might be expected, rather young and of normal weight.
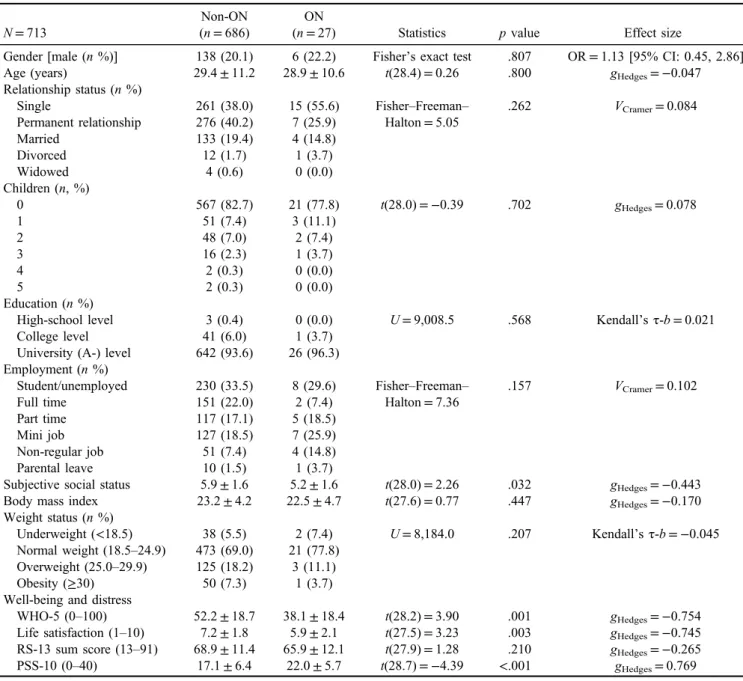
Average DOS scores were 17.87±5.45 (range: 10–37) with women showing higher mean levels as compared to men [18.14±5.43 vs. 16.79±5.44, t(220.8)=−2.67, p=.008, Cohen’sd=0.249].N=27 (3.8%) cases showed significant orthorexic eating behavior, that is, DOS sum scores ≥30. As shown in Table1, there was no difference between ON and non-ON subjects with regard to gender distribution, age, and other sociodemographic and anthro- pometric measures. However, ON subjects evaluated their subjective social status as comparably lower. Similarly, they reported lower well-being, lower satisfaction with life, and
Table 1.Sociodemographic, anthropometric, and well-being and distress measures split by ON group
N=713
Non-ON (n=686)
ON
(n=27) Statistics pvalue Effect size
Gender [male (n%)] 138 (20.1) 6 (22.2) Fisher’s exact test .807 OR=1.13 [95% CI: 0.45, 2.86]
Age (years) 29.4±11.2 28.9±10.6 t(28.4)=0.26 .800 gHedges=−0.047
Relationship status (n%)
Single 261 (38.0) 15 (55.6) Fisher–Freeman–
Halton=5.05
.262 VCramer=0.084
Permanent relationship 276 (40.2) 7 (25.9)
Married 133 (19.4) 4 (14.8)
Divorced 12 (1.7) 1 (3.7)
Widowed 4 (0.6) 0 (0.0)
Children (n, %)
0 567 (82.7) 21 (77.8) t(28.0)=−0.39 .702 gHedges=0.078
1 51 (7.4) 3 (11.1)
2 48 (7.0) 2 (7.4)
3 16 (2.3) 1 (3.7)
4 2 (0.3) 0 (0.0)
5 2 (0.3) 0 (0.0)
Education (n%)
High-school level 3 (0.4) 0 (0.0) U=9,008.5 .568 Kendall’sτ-b=0.021
College level 41 (6.0) 1 (3.7)
University (A-) level 642 (93.6) 26 (96.3) Employment (n%)
Student/unemployed 230 (33.5) 8 (29.6) Fisher–Freeman– Halton=7.36
.157 VCramer=0.102
Full time 151 (22.0) 2 (7.4)
Part time 117 (17.1) 5 (18.5)
Mini job 127 (18.5) 7 (25.9)
Non-regular job 51 (7.4) 4 (14.8)
Parental leave 10 (1.5) 1 (3.7)
Subjective social status 5.9±1.6 5.2±1.6 t(28.0)=2.26 .032 gHedges=−0.443
Body mass index 23.2±4.2 22.5±4.7 t(27.6)=0.77 .447 gHedges=−0.170
Weight status (n%)
Underweight (<18.5) 38 (5.5) 2 (7.4) U=8,184.0 .207 Kendall’sτ-b=−0.045 Normal weight (18.5–24.9) 473 (69.0) 21 (77.8)
Overweight (25.0–29.9) 125 (18.2) 3 (11.1)
Obesity (≥30) 50 (7.3) 1 (3.7)
Well-being and distress
WHO-5 (0–100) 52.2±18.7 38.1±18.4 t(28.2)=3.90 .001 gHedges=−0.754 Life satisfaction (1–10) 7.2±1.8 5.9±2.1 t(27.5)=3.23 .003 gHedges=−0.745 RS-13 sum score (13–91) 68.9±11.4 65.9±12.1 t(27.9)=1.28 .210 gHedges=−0.265 PSS-10 (0–40) 17.1±6.4 22.0±5.7 t(28.7)=−4.39 <.001 gHedges=0.769 Note.Number (and percentage in brackets) provided for categorical/dichotomous variables, means, and standard deviations provided for continuous variables. ON: orthorexia nervosa; WHO-5: World Health Organization Well-Being Index; RS-13: Resilience Scale; PSS-10:
Perceived Stress Scale;t: 2-samplet-test;U: Mann–WhitneyUtest; OR: odds ratio; CI: confidence interval.
higher current stress levels than their non-ON counterparts;
resilience scores were comparable.
Comorbid symptoms of ON
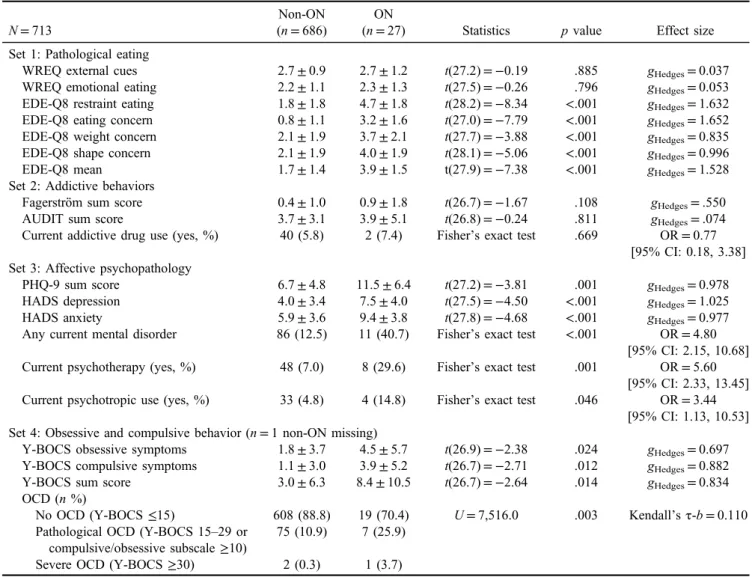
Group comparisons showed significant more pronounced pathological eating in ON (except the two WREQ subscales susceptibility to external cues and emotional eating).
EDE-Q8 mean scores above 2.5 indicated clinically relevant symptoms of an eating disorder in 77.8% (n=21) of ON cases but in only 28.9% (n=198) of non-ON subjects (pFisher’s exact test<.001). Neither the number of non-smokers (n=610, 88.9% vs. n=21, 77.8%; pFisher’s exact test= .113) nor the degree of physical dependence to tobacco smoking differed between groups. Similarly, AUDIT scores and current addictive drug use were comparable between ON and non-ON subjects. ON subjects reported higher anxiety and depressive symptoms with PHQ-9 sum scores indicative of at least moderate depression (values ≥10) in
48.2% of ON (as compared to 22.2% in non-ON). Questions on current psychotherapy and psychotropic drug use were more often affirmed in ON. Obsessive and compulsive behaviors were more pronounced in ON and more than about 30% of ON subjects fulfilled criteria for clinically relevant obsessive–compulsive symptoms (as compared to 11.2% in non-ON; Table2).
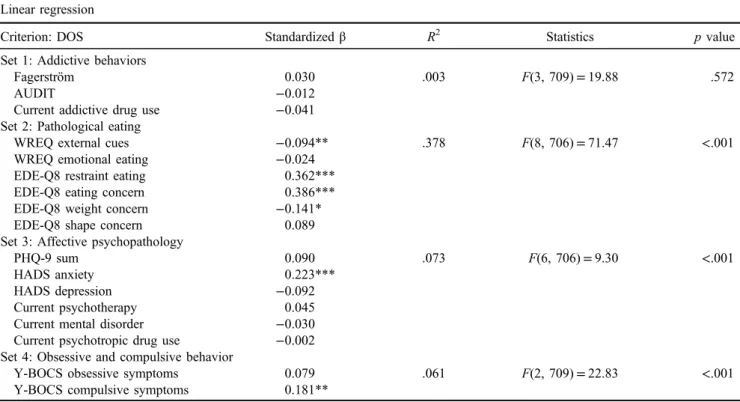
Separate regression models showed that, except addictive behaviors, each of our assumed comorbid mental health indicators predicted the DOS sum scores (Table3). Analysis of concordance between orthorexic behaviors and patholog- ical eating (Table 4) confirmed a substantial conceptual overlap of some but not all DOS items with EDE-Q8 subscales. The WREQ subscales susceptibility to external cues andemotional eatingwere also linked, although to a lesser extent. In more detail, pathological eating subscales were strongly related to thefive DOS items asking for rules on nutrition, cognitive narrowing, social constraints, as well as guilty consciences and depressed mood in response to
Table 2.Comorbid mental health symptoms split by ON group
N=713
Non-ON (n=686)
ON
(n=27) Statistics pvalue Effect size
Set 1: Pathological eating
WREQ external cues 2.7±0.9 2.7±1.2 t(27.2)=−0.19 .885 gHedges=0.037
WREQ emotional eating 2.2±1.1 2.3±1.3 t(27.5)=−0.26 .796 gHedges=0.053
EDE-Q8 restraint eating 1.8±1.8 4.7±1.8 t(28.2)=−8.34 <.001 gHedges=1.632 EDE-Q8 eating concern 0.8±1.1 3.2±1.6 t(27.0)=−7.79 <.001 gHedges=1.652 EDE-Q8 weight concern 2.1±1.9 3.7±2.1 t(27.7)=−3.88 <.001 gHedges=0.835 EDE-Q8 shape concern 2.1±1.9 4.0±1.9 t(28.1)=−5.06 <.001 gHedges=0.996
EDE-Q8 mean 1.7±1.4 3.9±1.5 t(27.9)=−7.38 <.001 gHedges=1.528
Set 2: Addictive behaviors
Fagerström sum score 0.4±1.0 0.9±1.8 t(26.7)=−1.67 .108 gHedges=.550
AUDIT sum score 3.7±3.1 3.9±5.1 t(26.8)=−0.24 .811 gHedges=.074
Current addictive drug use (yes, %) 40 (5.8) 2 (7.4) Fisher’s exact test .669 OR=0.77 [95% CI: 0.18, 3.38]
Set 3: Affective psychopathology
PHQ-9 sum score 6.7±4.8 11.5±6.4 t(27.2)=−3.81 .001 gHedges=0.978
HADS depression 4.0±3.4 7.5±4.0 t(27.5)=−4.50 <.001 gHedges=1.025
HADS anxiety 5.9±3.6 9.4±3.8 t(27.8)=−4.68 <.001 gHedges=0.977
Any current mental disorder 86 (12.5) 11 (40.7) Fisher’s exact test <.001 OR=4.80 [95% CI: 2.15, 10.68]
Current psychotherapy (yes, %) 48 (7.0) 8 (29.6) Fisher’s exact test .001 OR=5.60 [95% CI: 2.33, 13.45]
Current psychotropic use (yes, %) 33 (4.8) 4 (14.8) Fisher’s exact test .046 OR=3.44 [95% CI: 1.13, 10.53]
Set 4: Obsessive and compulsive behavior (n=1 non-ON missing)
Y-BOCS obsessive symptoms 1.8±3.7 4.5±5.7 t(26.9)=−2.38 .024 gHedges=0.697 Y-BOCS compulsive symptoms 1.1±3.0 3.9±5.2 t(26.7)=−2.71 .012 gHedges=0.882
Y-BOCS sum score 3.0±6.3 8.4±10.5 t(26.7)=−2.64 .014 gHedges=0.834
OCD (n%)
No OCD (Y-BOCS≤15) 608 (88.8) 19 (70.4) U=7,516.0 .003 Kendall’sτ-b=0.110 Pathological OCD (Y-BOCS 15–29 or
compulsive/obsessive subscale≥10)
75 (10.9) 7 (25.9)
Severe OCD (Y-BOCS≥30) 2 (0.3) 1 (3.7)
Note.Number (and percentage in brackets) provided for categorical/dichotomous variables, means and standard deviations provided for continuous variables. ON: orthorexia nervosa; WREQ: Weight-Related Eating Questionnaire; EDE-Q8: Eating Disorder Examination- Questionnaire brief version; AUDIT: Alcohol Use Disorders Identification Test; PHQ-9: Patient Health Questionnaire; HADS: Hospital Anxiety and Depression Scale; Y-BOCS: Yale–Brown Obsessive–Compulsive Scale; OCD: obsessive–compulsive disorder;t: 2-sample t-test;U: Mann–WhitneyUtest; OR: odds ratio; CI: confidence interval.
eating unhealthy (R2=.195–.423). Lowest associations were seen with the two DOS items representing the social consequences and subjects’sense of pride at their determi- nation for healthy eating (R2=.048 and .087, respectively).
Because of this overlap between DOS scores and patho- logical eating and because about 78% of ON subject could be classified as having relevant symptoms of an eating disorder, we examined whether ON contributed to the Table 3.Syndrome overlap of orthorexic behavior and mental health symptoms
Linear regression
Criterion: DOS Standardizedβ R2 Statistics pvalue
Set 1: Addictive behaviors
Fagerström 0.030 .003 F(3, 709)=19.88 .572
AUDIT −0.012
Current addictive drug use −0.041
Set 2: Pathological eating
WREQ external cues −0.094** .378 F(8, 706)=71.47 <.001
WREQ emotional eating −0.024
EDE-Q8 restraint eating 0.362***
EDE-Q8 eating concern 0.386***
EDE-Q8 weight concern −0.141*
EDE-Q8 shape concern 0.089
Set 3: Affective psychopathology
PHQ-9 sum 0.090 .073 F(6, 706)=9.30 <.001
HADS anxiety 0.223***
HADS depression −0.092
Current psychotherapy 0.045
Current mental disorder −0.030
Current psychotropic drug use −0.002 Set 4: Obsessive and compulsive behavior
Y-BOCS obsessive symptoms 0.079 .061 F(2, 709)=22.83 <.001
Y-BOCS compulsive symptoms 0.181**
Note.DOS: Duesseldorf Orthorexia Scale sum score; AUDIT: Alcohol Use Disorders Identification Test; WREQ: Weight-Related Eating Questionnaire; EDE-Q8: Eating Disorder Examination-Questionnaire brief version; PHQ-9: Patient Health Questionnaire; HADS: Hospital Anxiety and Depression Scale; Y-BOCS: Yale–Brown Obsessive–Compulsive Scale;R2: coefficient of determination, that is, variance in criterion explained by predictors; F:F-tests to test the overall significance for the regression model.
***p<.001. **p<.01. *p<.05.
Table 4.Concordance between orthorexic behavior and pathological eating
Pearson’sr
WREQ external
cues
WREQ emotional
eating
EDE-Q8 restraint
eating
EDE-Q8 eating concern
EDE-Q8 weight concern
EDE-Q8 shape concern R2
StatisticsF (df=6, 706)
p value DOS 1: Healthy food −0.031 0.030 0.292*** 0.233*** 0.088* 0.088* .119 15.86 <.001 DOS 2: Rules on
nutrition
0.007 0.136*** 0.462*** 0.312*** 0.278*** 0.278*** .229 34.96 <.001 DOS 3: Only healthy
is enjoyable
0.008 0.065 0.269*** 0.324*** 0.189*** 0.189*** .124 17.00 <.001 DOS 4: Social
constraints
−0.039 0.017 0.358*** 0.362*** 0.187*** 0.187*** .195 28.58 <.001 DOS 5: Sense of pride 0.036 −0.027 0.180*** 0.163*** 0.087* 0.087* .049 6.07 <.001 DOS 6: Guilty
consciences
0.196*** 0.282*** 0.523*** 0.611*** 0.436*** 0.436*** .410 81.7 <.001 DOS 7: Social
exclusion
0.032 0.067 0.206*** 0.280*** 0.146*** 0.146*** .087 11.19 <.001 DOS 8: Cognitive
constriction
0.090* 0.116** 0.523*** 0.523*** 0.316*** 0.316*** .353 64.14 <.001 DOS 9: Rigidity −0.061 −0.007 0.278*** 0.283*** 0.160*** 0.160*** .129 17.36 <.001 DOS 10: Depressed
mood
0.233*** 0.301*** 0.529*** 0.614*** 0.436*** 0.436*** .423 86.41 <.001
Note.Self-chosen labels for single DOS items are used. Please see Barthels et al. (2015a) for further details. DOS: Duesseldorf Orthorexia Scale sum score; WREQ: Weight-Related Eating Questionnaire; EDE-Q8: Eating Disorder Examination-Questionnaire brief version;R2: coefficient of determination, that is, variance in criterion explained by predictors;F:F-tests to test the overall significance for the regression model.
***p<.001. **p<.01. *p<.05.
explained variance in our well-being and distress variables over and above pathological eating. A two-step regression analysis indicated that the variance explained by pathologi- cal eating was generally small (between 10% for WHO-5 and 17% for PSS-10; Table5). No additional variance was explained by orthorexic behaviors, that is, we saw no change inR2when the DOS sum score was added in a second step.
The only exception was PSS-10, where DOS scores contributed weak but significant to the explained variance (0.6%,p=.021).
Of note, n=8 ON cases could not be classified as being high in restraint eating/eating concern but low in weight concern/shape concern (median split). Thus, about one third of our ON cases scored comparatively low on the two EDE-Q8 subscales reflecting major characteri- stics of an eating disorder as currently diagnosed. Interest- ingly,five out of six male ON cases showed this response pattern.
Nutritional behaviors and healthy lifestyle features in ON Comparing ON cases and non-ON cases in terms of nutri- tional and health behavior variables showed similar general physical activity levels and a comparable agreement to our question on regular medical checkups (Table 6). Even though ON subjects more often performed a restric- tive eating style and showed higher adherence to the Mediterranean diet, group comparisons were non-significant.
Main predictors of orthorexic eating behavior
Our final stepwise linear regression analysis aimed to identify the most significant predictors of orthorexic behaviors. Table 7 provides an overview of remaining variables. In addition to eating-related variables (patho- logical eating, eating style, and Mediterranean diet), most variance in the DOS sum scores could be accounted for by
Table 5.Proportion of variance in well-being and distress explained by pathological eating and orthorexic behaviors
Change inR2 Statistics pvalue
Criterion: Life satisfaction
Step 1: Pathological eating .116 F(6, 706)=11.51 <.001
Step 2: DOS .001 F(1, 705)=1.01 .316
Criterion: WHO-5
Step 1: Pathological eating .106 F(6, 706)=13.92 <.001
Step 2: DOS <.001 F(1, 705)=0.03 .870
Criterion: RS-13
Step 1: Pathological eating .104 F(6, 706)=13.70 <.001
Step 2: DOS <.001 F(1, 705)=0.13 .716
Criterion: PSS-10
Step 1: Pathological eating .171 F(6, 706)=24.19 <.001
Step 2: DOS .006 F(1, 705)=5.39 .021
Note.DOS: Duesseldorf Orthorexia Scale sum score;pathological eatingrefers to the Weight-Related Eating Questionnaire and Eating Disorder Examination-Questionnaire subscales; WHO-5: World Health Organization Well-Being Index; RS-13: Resilience Scale; PSS-10:
Perceived Stress Scale;R2: coefficient of determination, that is, variance in criterion explained by predictors,F:F-tests to test the overall significance for the regression model.
Table 6.Nutritional behaviors and lifestyle features split by ON group
N=713
Non-ON (n=686)
ON
(n=27) Statistics pvalue Effect size
Physical activity (n, %)
Inactive 83 (12.1) 5 (18.5) Fisher–Freeman–Halton=3.32 .328 VCramer=0.068
Moderately inactive 86 (12.5) 2 (7.4)
Moderately active 155 (22.6) 3 (11.1)
Active 362 (52.8) 17 (63.0)
Medical screening (1–5) 3.5±1.1 3.4±1.2 t(27.9)=0.29 .773 gHedges=−0.063
3.5±1.1 (median: 4) Nutritional behaviors Eating style (n, %)
Vegan 38 (5.5) 4 (14.8) Fisher–Freeman–Halton=4.89 .155 VCramer=0.083
Vegetarian 96 (14.0) 2 (7.4)
Semi-vegetarian 116 (16.9) 6 (22.2)
Omnivore 436 (63.6) 15 (55.6)
MEDAS sum score (n=1 missing) 6.2±1.9 7.0±1.9 t(28.3)=−1.99 .056 gHedges=0.375 Note.Number (and percentage in brackets) provided for categorical/dichotomous variables, means, and standard deviations provided for continuous variables. ON: orthorexia nervosa; MEDAS: Mediterranean Diet Assessment Tool;t: 2-samplet-test.
compulsive behaviors and subjective social status. Neither well-being or distress variables nor other mental health symptoms (affective symptoms and addictive behaviors) provided any further predictive value and were thus not added to the final model.
DISCUSSION
Summary of main findings
Mean DOS sum scores in our sample were comparable to previously published values (Barthels et al., 2015a).
Employing the proposed cut-off value of 30 resulted in n=27 (3.8%) ON cases. Average orthorexic tendencies appeared higher in women, but ON cases were equally distributed between men and women. Decreased psycho- logical well-being and higher perceived stress among those with ON suggest the clinical relevance of this condition.
With regard to distinguishing ON from other mental health symptoms, the results suggest a substantial co-occurrence with pathological eating with about 78% of ON subjects (as compared to 29% in non-ON) showing above-threshold symptoms of an eating disorder. In addition, 48% of ON subjects (as compared to 22% in non-ON) could be consid- ered to suffer from at least moderate depression and 30%
showed considerable obsessive–compulsive symptoms (as compared to 11% in non-ON). On the contrary, addictive behaviors were no characteristic feature of ON. This was also true for other nutritional behaviors and healthy lifestyle features where we found no difference between ON and non-ON. Importantly, we found a strong correlation between orthorexic behaviors and pathological eating as well as no contribution to explaining any more variance in psychological well-being that goes beyond pathological eating. Together, these results suggest (a) that there is a strong correlation between ON and existing mental health conditions and (b) that much of the variance in our well-being and distress variables explained by orthorexic behaviors is explained already by existing pathological eating scales.
Claim 1a: Is ON of epidemiological significance?
Yes, but: : :
The results indicated a notable proportion of subjects to fulfill proposed cut-off scores. Numbers are comparable to previously published case numbers (Barthels et al., 2015a;
Dunn et al., 2017), and missing differences in regard to demographic factors and BMI between cases and non-cases resembled most recent research in this area. In more detail, age, gender, education, and weight status have been dis- cussed to be related to ON. While Bratman and Knight (2000) considered ON to be more prevalent among men, the majority of existing studies hint toward similar numbers in men and women (e.g., Dunn et al., 2017; Luck-Sikorski et al., 2018). This was also true in this study, despite, women’s average DOS scores were slightly higher than scores in men. Whether there are gender-related differences in symptomatology, etiology, and pathophysiology is hardly understood. However, it seems reasonable to assume that men and women differ in specific orthorexic behaviors and correlates (e.g., healthy eating vs. shape concern). With respect to age, small positive as well as small negative associations with orthorexic eating behavior have been shown (e.g., Barthels et al., 2015a; Bratman & Knight, 2000; Dell’Osso et al., 2016; Depa, Schweizer, Bekers, Hilzendegen, & Stroebele-Benschop, 2017; Donini et al., 2004;Dunn et al., 2017;Missbach et al., 2015). While the impact of age seems thus negligible, population representa- tive studies will have to provide a more conclusive picture.
Interestingly, ON cases in this study reported on lower subjective social status. Numerous reports linked subjective status to different health outcomes (Adler et al., 2000;
Euteneuer, 2014) and our findings extend this knowledge onto orthorexic eating behaviors. However, our results need to be cautiously interpreted. ON cases herein also reported on lower psychological well-being, higher perceived stress, and more depressive mood, factors that strongly correlate with subjective social status. In addition, our data corrobo- rate previous epidemiological data showing ON and anthropometric measures to hardly correlate (Arusoglu˘ et al., 2008; Dittfeld et al., 2016; Donini et al., 2004;
Table 7.Most significant predictors of orthorexic behavior (stepwise linear regression and forward method)
Criterion: DOS standardizedβ Change inR2 Statistics pvalue
Model 1: Pathological eating
WREQ External cues −0.097** .380 F(6, 704)=71.84 <.001
WREQ Emotional eating −0.025
EDE-Q8 Restraint eating 0.364***
EDE-Q8 Eating concern 0.385***
EDE-Q8 Weight concern −0.133*
EDE-Q8 Shape concern 0.081
Model 2: Eating style −0.233*** .054 F(1, 703)=66.37 <.001
Model 3: MEDAS 0.173*** .026 F(1, 702)=33.95 <.001
Model 4: Y-BOCS compulsive symptoms 0.098** .009 F(1, 701)=11.59 .001
Model 5: Subjective social status −0.067* .004 F(1, 700)=5.57 .019
Note.DOS: Duesseldorf Orthorexia Scale sum score; WREQ: Weight-Related Eating Questionnaire; EDE-Q8: Eating Disorder Examination- Questionnaire brief version; MEDAS: Mediterranean Diet Assessment Tool; Y-BOCS: Yale–Brown Obsessive–Compulsive Scale;R2: coefficient of determination, that is, variance in criterion explained by predictors,F:F-tests to test the overall significance for the regression model.
***p<.001. **p<.01. *p<.05.
Sanlier, Yassibas, Bilici, Sahin, & Celik, 2016). The re- search indicating higher prevalence rates in underweight (Dell’Osso et al., 2016;Gezer & Kabaran, 2013) as well as overweight (Asil & Sürücüoglu, 2015;˘ Bundros et al., 2016;
Fidan, Ertekin, I¸sikay, & Kırpınar, 2010; Hyrnik et al., 2016;Missbach et al., 2015) was not reflected in our data.
Overall, our findings, other general population surveys, and data from high-risk populations showed that ON is an important phenomenon with equal distribution among men and women, among different age groups and educational backgrounds, and among different weight categories.
However, more research is necessary that goes beyond special populations and that extends onto other economic and ethnic groups.
Claim 1b: Is ON of clinical significance? Yes, but: : : In line with assumptions on the psychological sequelae of orthorexic behaviors (Hayes et al., 2017), ON cases reported lower well-being and life satisfaction, and higher perceived stress than non-ON cases. On the contrary, resilience, that is, psychosocial stress resistance, was comparable between groups. However, these findings need to be viewed with one major restriction. ON was not able to add further explanation of variation in well-being in a model where pathological eating was also considered as a predictor. Thus, there is only little evidence in our data for ON to be of clinical relevance, that is, to cause significant distress, beyond known concepts of mental disorders.
Claim 2: Do ON criteria demarcate a difference between orthorexic behaviors and other known mental health problems? No: : :
Our data showed ON to considerably overlap with patho- logical eating, with 80% of ON cases showing clinically relevant eating disorders symptoms (Barthels et al., 2017a, 2017c). Similar to most previous research, eating concern and restrained eating in particular predicted orthorexic behaviors (Barthels, Meyer, Huber, & Pietrowsky, 2017b;
Kinzl, Hauer, Traweger, & Kiefer, 2005,2006). Weight and shape concern as well as emotional eating seemed of minor relevance (Brytek-Matera, Donini, et al., 2015;de Souza &
Rodrigues, 2014;Oberle & Lipschuetz, 2018; Tremelling, Sandon, Vega, & McAdams, 2017). In an effort to better understand these associations between specific orthorexic behaviors and pathological eating, multiple regressions revealed a strong link between pathological eating and half of the DOS items. On the contrary, the two DOS items examining the subjects’ personal pride in their determina- tion to healthy eating and whether subjects are socially excluded due to their nutritional standards do not seem to be represented in the pathological eating subscales. Clinically relevant depressive symptoms in about half of our ON sample (Luck-Sikorski et al., 2018) and 30% of ON cases showing pathological obsessive–compulsive symptoms (Arusoglu et al., 2008;˘ Bundros et al., 2016; Hayes et al., 2017;Oberle et al., 2017) further challenge the conceptuali- zation of ON as a distinct clinical disorder. Of note, compulsive symptoms exceeded obsessive symptoms in predicting orthorexic behaviors. It must be pointed out,
however, that the examined psychopathological measures only accounted for about 40% of variance in orthorexic behaviors, leaving a large portion of variance unexplained.
Importantly, comorbidity is highly prevalent in mental health conditions, often related to shared personality traits and similar underlying neurobiological processes (e.g.,Insel et al., 2010; Pollack & Forbush, 2013). On the basis of symptoms, we can only determine whether the character- istics that distinguish ON from other disorders are of clinical relevance. According to our data, this was hardly the case.
Our findings raise initial doubts about ON being substan- tially distinct from established eating disorders. From a therapeutic perspective, making a distinction between ON and other eating disorders may however be useful as the underlying motivation for specific food choices and eating behaviors differ. Specifically, questions on personal pride and social exclusion showed lowest associations with path- ological eating scales.
In sum, considering ON a distinct diagnostic category seems debatable. Pathological eating, affective pathology, and obsessive–compulsive symptoms (in this sequence) significantly overlapped with ON. Unexplained variance in orthorexic eating behavior calls for intensified research and more sophisticated modeling efforts, that is, an improved conceptualization and measurement of ON.
Claim 3: Can ON be distinguished from health-related lifestyle features? Yes: : :
Other nutritional behaviors and a healthy lifestyle were found to be associated with ON (Dittfeld, Gwizdek, Jagielski, Brzęk, & Ziora, 2017; Turner & Lefevre, 2017).
In contrast to previous research, ON was no more prevalent in specific forms of (restrictive) eating habits (as compared to Barnett, Dripps, & Blomquist, 2016; Barthels et al., 2018;
Dell’Osso et al., 2018; Luck-Sikorski et al., 2018; Valera, Ruiz, Valdespino, & Visioli, 2014) and there was no associ- ation with current physical activity levels in this study (as compared toBrytek-Matera, Donini, et al., 2015;Oberle et al., 2018;Rudolph, Göring, Jetzke, Großarth, & Rudolph, 2017). Considering our samples’ rather homogenous composition in regard to socioeconomic status (SES) and sociocultural context, conclusions can only be drawn to a certain extent. Studies in more diverse samples and studies, which employ culture-sensitive assessment tools, are highly warranted.
Limitations
Some factors limit the generalizability of the results and need to be addressed in future studies. The number of subjects with ON was rather small (n=27) and statistical procedures are based on unequal sizes of groups. In addi- tion, we were not able to perform clinician-administered interviews to achieve precise clinical diagnoses and assess functional impairments in important areas of life. Rather, we employed validated questionnaires providing only estimates of symptom severity. It might have been useful to also perform a qualitative investigation with relevant ON cases.
This would have allowed for a better grasp of ON characteristics. Similarly, assessment of orthorexic eating