Pediatric Pulmonology. 2020;55:1653–1660. wileyonlinelibrary.com/journal/ppul © 2020 Wiley Periodicals, Inc.
|
1653DOI: 10.1002/ppul.24758
O R I G I N A L A R T I C L E : C Y S T I C F I B R O S I S—P E D I A T R I C & A D U L T
Skin wipe test: A simple, inexpensive, and fast approach in the diagnosis of cystic fibrosis
Pavol Ď ur č
1,2| Franti š ek Foret PhD
1| Luká š Homola MD, PhD
3| Miriam Malá MD
3| Eva Pokojová MD
4| Hana Vinohradská MD
5| Milan Dastych MD, PhD
5|
Dagmar Krausová
3| Dóra Nagy MD, PhD
6| Olga Bede MD, PhD
7| Pavel D ř evínek MD, PhD
8| Veronika Skalická MD
9| Petr Kubá ň PhD
11Department of Bioanalytical Instrumentation, CEITEC Masaryk University, Brno, Czech Republic
2Department of Chemistry, Masaryk University Brno, Czech Republic
3Cystic Fibrosis Centre and Clinic of Pediatric Infectious Diseases, University Hospital Brno, Brno, Czech Republic
4Department of Respiratory Diseases and TB, University Hospital Brno, Brno, Czech Republic
5Department of Clinical Biochemistry, University Hospital Brno, Brno, Czech Republic
6Department of Medical Genetics, University of Szeged, Szeged, Hungary
7Bács‐Kiskun County Hospital and Teaching Hospital, University of Szeged, Kecskemét, Hungary
8Department of Medical Microbiology, 2nd Faculty of Medicine, Charles University and Motol University Hospital, Prague, Czech Republic
9Department of Pediatrics, Charles University and Motol University Hospital, Prague, Czech Republic
Correspondence
Petr Kubáň, PhD, Department of Bioanalytical Instrumentation, CEITEC Masaryk University, Veveří 97, 60200 Brno, Czech Republic.
Email:petr.kuban@ceitec.muni.cz
Funding information
Ministerstvo Zdravotnictví Ceské Republiky, Grant/Award Number: NV18‐08‐00189;
MinisterstvoŠkolství, Mládeže a Telovýchovy, Grant/Award Number: CEITEC 2020 (LQ1601)
Abstract
Objective:
To assess the performance of a newly developed skin wipe test (SWT) for the diagnosis of cystic fibrosis (CF).
Study Design:
Spontaneously formed sweat from the forearm was wiped by a cotton swab moistened with 100 µL of deionized (DI) water and extracted into 400 µL of DI water (SWT). The conventional Macroduct sweat test (ST) was performed simultaneously. SWT samples of 114 CF patients, 76 healthy carriers, and 58 controls were analyzed by capillary electrophoresis with contactless conductivity detection and Cl
−/K
+and (Cl
−+ Na
+)/K
+ion ratios were evaluated. Chloride concentrations from Macroduct ST were analyzed coulometrically.
Results:
Analysis of 248 SWT samples and simultaneous Macroduct ST samples showed comparable method performance. Two ion ratios, Cl
−/K
+and (Cl
−+ Na
+)/K
+, from the SWT samples and Cl
−values from the ST samples were evaluated to diagnose CF. Sensitivity of the SWT method using the Cl
−/K
+ratio (cutoff value 3.9) was 93.9%, compared to 99.1% when using the (Cl
−+ Na
+)/K
+ratio (cutoff value 5.0) and 98.3% in using Macroduct Cl
−(cutoff value higher or equal to 60 mmol/L). The methods' specificities were 97.8%, 94.0%, and 100.0%, respectively.
Conclusions:
The developed SWT method with capillary electrophoretic analysis for CF diagnosis performs comparably to the conventional Macroduct ST. The SWT method is simple, fast, inexpensive, and completely noninvasive. Use of an ion ratio in obtained SWT samples is proposed as a new diagnostic parameter that shows significant promise in CF diagnostics.
K E Y W O R D S
capillary electrophoresis, cystic fibrosis, diagnosis, ion ratio, screening, skin wipe test, sweat test
1 | I N T R O D U C T I O N
The median life expectancy of cystic fibrosis (CF) patients has im- proved significantly in recent years. This can be attributed in part to timely diagnosis due to the newborn screening (NBS) programs.1
NBS in most countries relies on initial immunoreactive trypsinogen (IRT) threshold testing that, if positive, is followed by genetic testing and sweat test (ST).
Two collection methods are commonly applied—Gibson‐Cooke procedure2 and Macroduct.3 Both methods start with pilocarpine
iontophoresis to stimulate sweating. The Gibson‐Cooke method uses a filter paper to collect the induced sweat with subsequent extraction with DI water. The Macroduct method uses a“watch type collector” with a microconduit that is able to collect small amounts of pure sweat. The Gibson‐Cooke method is cheaper than the Macroduct, while both methods require trained personnel adhering to the sampling guidelines. The sweat sample can be analyzed during the scheduled visit, but is more often transported to a biochemical laboratory for analysis.
Although ST is currently the gold standard, obtaining a sweat specimen for chloride measurement can be sometimes challenging, especially in young infants. Some concerns about ST were raised in a recent overview article on ST practice in Europe.4First, it was re- ported that in more than 37% of the CF centers the cost per sweat analysis using the Macroduct device exceeds the reimbursement.4 Conversion of laboratory equipment to the new (Macroduct) method and the need for repeated testing when the collection procedure yields insufficient sweat quantity also contribute to increased cost.
Second, the biological variability of sweat chloride can be as high as 18.2 mmol/L.5This variability of the ST may jeopardize a proper in- terpretation of the results, especially when the sweat chloride con- centration falls within the gray zone (ie, 30‐59 mmol/L chloride).
A retrospective study of 197 persons with repeated ST resulted in reclassification of the outcome in 55 studied subjects (28%).5 The repeated sweat chloride concentration in patients with CF and G551D mutation assigned to placebo showed similar variability (±20 mmol/L).6This variability may have significant implications for clinical trials and monitoring of therapy outcomes having sweat chloride concentration as an endpoint.
Alternatives to the ST method exist, such as the measurement of sweat conductivity,7,8use of sodium cation instead of chloride,9‐13and use of various wearable devices for online monitoring of sweat chloride.14‐16 Unfortunately, in all of the aforementioned tests, sweat induction by pilocarpine iontophoresis before sweat collection is required.
In a quest to simplify the whole sweat sampling procedure, we recently developed a method briefly named skin wipe test (SWT).17,18 In SWT, on the contrary to Gibson‐Cooke or Macroduct methods, the unstimulated, spontaneously formed sweat is collected by a cotton swab moistened with deionized (DI) water and extracted. The col- lection procedure is completely noninvasive, simple, and fast, taking approximately one fifth of the time required for the conventional sweat collection (Macroduct, Gibson‐Cooke) and it is also sig- nificantly cheaper. SWT can be performed by the trained personnel during scheduled patient visit. One can obtain a specimen sample virtually at any time, even from very young infants not fulfilling the guidelines criteria for weight and age19and from those having very low perspiration rates. Evaluation by capillary electrophoresis with contactless conductivity detection (CE‐C4D), typically performed in the biochemical laboratory, allows analysis of the whole “sweat ionome.” In this study, we present a comprehensive study of the developed SWT method, using SWT samples from a large number of participants collected at multiple CF centers. A total of 248 samples from CF patients, healthy carriers, and controls were analyzed.
We propose the use of SWT sampling with the extended ion ratio, defined as (Cl−+ Na+)/K+, and a cutoff value of 5.0 as a new diagnostic approach in CF diagnostics. Our approach provides a suitable alternative to the conventional ST method offering similar performance but several advantages.
2 | M A T E R I A L S A N D M E T H O D S
This was a cross‐sectional diagnostic study conducted between 2016 and 2019 with the participation of three CF centers in Brno, Czech Republic; Prague, Czech Republic; and Kecskemét, Hungary. All patients referred to the laboratories in the study period either had positive NBS result (IRT level > 65 ng/mL), were referred due to suspicion of CF, or were already registered CF patients. The study protocol was reviewed and approved by the Ethical Committees of the participating centers. Written in- formed consent was obtained from all participants. All samples were blinded during the analyses. In total 248 participants were included into the study: 114 CF patients, 76 healthy carriers, and 58 control individuals.
The CF cohort was defined as patients with two CF‐causing cystic fibrosis transmembrane conductance regulator (CFTR) muta- tions and positive ST (sweat chloride higher or equal to 60 mmol/L).
In case of borderline ST (30‐59 mmol/L) subjects were classified as CF group based on typical clinical features (signs of pancreatic insufficiency, signs of CF lung disease, cultivation ofPseudomonas aeruginosafrom sputum, etc) confirmed by a CF specialist.
The healthy carrier cohort was defined as individuals identified by neonatal screening (IRT level > 65 ng/mL and DNA analysis of 50 most frequent mutations) as carriers of one CFTR mutation with negative ST (sweat chloride < 30 mmol/L) and no clinical signs of CF confirmed by a CF specialist.
The control cohort was defined as individuals who were not identified by neonatal screening (low IRT) and who had a negative ST (sweat chloride < 30 mmol/L). These individuals were not seen by a CF specialist and did not have a DNA analysis. Table 1 details characteristics of the study cohorts. The proportions of mutations as divided into five classes according to the primary molecular defect20 also are shown in Table1.
2.1 | Skin wipe sample collection
SWT samples and the Macroduct ST samples were obtained at the same time. To obtain the SWT samples, the skin of the forearm was cleaned with ethanol followed by DI water and then dried with a cotton pad. Spontaneous sweat formation was then permitted for at least 3 minutes. A cotton swab (Linteo, Melitrade a.s., Czech Republic, 100% cotton wool wound on a plastic stick without the use of glue) wetted with 100 µL of DI water was used for repeated wiping (10×) of an area of skin on the forearm (at least 10 cm2). The cotton swab was then immersed in 400 µL of DI water, allowed to stand for
3 minutes to extract the analytes and discarded without squeezing.
All samples were stored at−20°C when not analyzed immediately.
The cotton swabs used for the SWT procedure had been cleaned before use. A detailed description of the cleaning protocol and the SWT guidelines are provided in the documents in the online sup- porting information. The precleaned cotton swabs can be stored in a closed plastic containers (for instance a 15 mL centrifuge tube) for at least 2 months, can be sent by mail to the CF center and used any time before the expiration.
2.2 | Ion analyses of the SWT samples
Ion analyses of the SWT samples were performed using the Agilent 7100 Capillary Electrophoresis (CE) System (Agilent Technologies, Santa Clara, CA) with ADMET contactless conductivity detector (C4D), (Ver. 5.06; ADMET, Prague, Czech Republic) at −15 kV for anions and +15 kV for cations. A fused silica capillary (50μm inner diameter/375μm outer diameter, 40/31.5 cm total/effective length;
Microquartz GmbH, Munich, Germany) was used for the separations.
Samples were injected hydrodynamically (50 mbar/5 seconds). Each analyte concentration was analyzed on the basis of its integrated peak area. Analysis of each sample was performed in triplicate and the data are expressed as means. The analytical parameters of the CE‐C4D method are summarized in Table S1 in the online supporting information. The analyses of SWT samples were performed in one centralized laboratory (CEITEC Masaryk University, Brno, Czech Republic). The samples were shipped from the participating CF centers to the analytical laboratory on dry‐ice.
2.3 | Sweat sample collection and analysis using Macroduct
ST samples were obtained using the commercial Macroduct Sweat Collection System3 by trained personnel while strictly adhering to the standardized guidelines.21 Sweating was stimulated using the pilocarpine gel discs (Pilogel) and Webster Model 3700 sweat in- ducer (Elitech) and the induced sweat was collected by the Macro- duct Sweat Collector device for 30 minutes. The samples were then transferred to polypropylene vials and sent to the clinical laboratory for chloride analysis using a Sherwood Model 926A chloride analyzer (Sherwood Scientific, Cambridge, UK). The sweat samples collected by the Macroduct Sweat Collector were analyzed in the respective CF centers that have certified laboratories and trained personnel, performing more than 150 analyses per year.
2.4 | Chemicals and standards
All chemicals used for preparing the background electrolyte (BGE) and analyte stock solutions were combined with DI water (Purite, Neptune, Watrex, Prague, Czech Republic) and were of reagent grade.
Ten millimole per liter stock solutions of inorganic anions were prepared from their sodium salts (chloride, nitrate, nitrite, sulfate, all from Pliva‐Lachema, Brno, Czech Republic). Ten millimole per liter stock solutions of inorganic cations were prepared from their chloride salts (potassium, sodium, calcium, magnesium), except that ammonium was prepared from ammonium fluoride (all from Pliva‐Lachema, Brno, Czech Republic). The standard sample solutions used in the analysis were prepared separately for anions and cations by diluting the respective standard solutions to the required concentrations with DI water. Background electrolyte (BGE) for CE measurements was prepared daily by diluting 200 mmol/L stock solutions ofL‐histidine (HIS; Sigma‐Aldrich) and 2‐(N‐morpholino)ethanesulfonic acid (MES; Sigma‐Aldrich) to the final concentration of 20 mmol/L. The compound 18‐crown‐6 was prepared as a 100 mmol/L stock solution and was added to the BGE to yield the final concentration of 2 mmol/L.
Cetyltrimethylammonium bromide (CTAB) was prepared from 10 mmol/L stock solution and was added to the BGE to yield the final concentration of 30 µmol/L.
The optimized BGE consisted of 20 mmol/L MES, 20 mmol/L HIS, 2 mmol/L 18‐Crown‐6, and 30 µmol/L CTAB. Its pH was 6.
2.5 | Data evaluation, statistics
The peak area integration was performed in OpenLAB CDS Chemstation software (Edition C.01.07 SR2; Agilent Technologies).
The calculations of mean, median, standard deviation, and relative standard deviation values were performed in Microsoft Excel soft- ware. The calculations of receiver operating characteristic (ROC), T A B L E 1 Characteristics of the study cohort
Variable CF Controls
Healthy
carriers Total
Number of subjects 114 58 76 248
Sex Male 48 37 41 126
Female 66 21 35 122
Age (years) Mean 8.3 3.5 0.3 4.7
Median 8.3 2.0 0.1 1.4
Min 0.07 0.04 0.08 0.04
Max 40.5 16.8 5.5 40.5
Mutations F508del/
F508del
47 … … …
F508del/
other
54 … … …
other/other 13 … … …
Mutation class I 12.3% … … …
II 71.1% … … …
III 1.8% … … …
IV 0.4% … … …
V 2.6% … … …
Unknown 11.8% … … …
sensitivity, specificity, positive predictive value (PPV), and negative predictive value (NPV) were performed using the Microsoft Excel add‐on software XlStat (v.2014.5.03; Addinsoft, Paris, France).
3 | R E S U L T S
3.1 | CE ‐ C
4D analysis of SWT samples
All 248 SWT samples collected were thawed at room temperature and directly analyzed by CE‐C4D. When needed, the samples were appropriately diluted with DI H2O to fall within the calibration range.
Typical electropherograms obtained from the SWT samples of a CF patient, a healthy carrier, and a control are shown in Figure1. All relevant anions (Cl−) and cations (NH4+, K+, Ca2+, Na+, Mg2+) were analyzed in under 3 minutes.
3.2 | Analysis of Cl
−/K
+ratio in SWT samples
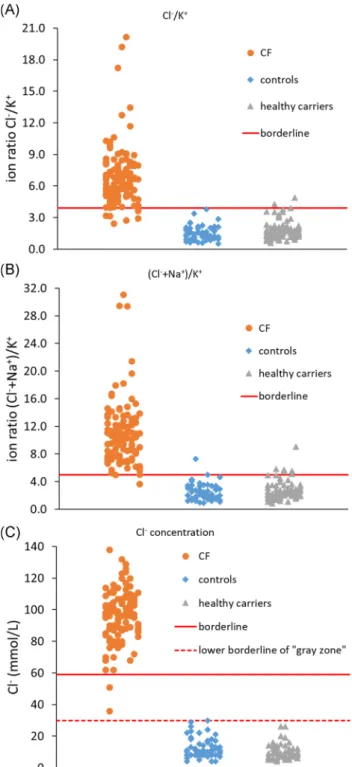
The concentrations of ions in SWT samples are calculated from the peak areas. They are not, however, comparable between different samples because of the various volumes of sweat spontaneously produced and collected during the SWT procedure. For that reason, the use of ion ratio is necessary to compare the values among different samples. Based on our preliminary results,18 the simplest ion ratio Cl−/K+, was tested first. The Cl−/K+ion ratios of individual SWT samples of the three subject groups (CF patients, healthy carriers, and controls) are shown in Figure2A. The Cl−/K+ion ratio values of CF patients ranged from 2.4 to 20.2 (mean: 6.9; median:
6.6), those of controls ranged from 0.5 to 3.8 (mean: 1.5; median: 1.4), and those of healthy carriers ranged from 0.6 to 4.9 (mean: 1.8;
median: 1.6). Using the optimum ion ratio cutoff value of 3.9 (to yield the highest combined sensitivity and specificity of the method), as calculated in the XlStat software, the method's sensitivity was 93.9%
and its specificity was 97.8%. From the total of 114 CF patients, seven had the Cl−/K+ion ratio values below the cutoff value of 3.9.
On the other hand, none of the controls, but three healthy carriers had Cl−/K+ion ratio values above the established cutoff value of 3.9.
PPV and NPV were thus 97.3% and 94.9%, respectively.
3.3 | Analysis of extended (Cl
−+ Na
+)/K
+ion ratio in SWT samples
The extended ion ratio, defined as (Cl−+ Na+)/K+might contribute to a better diagnostic performance. The (Cl−+ Na+)/K+ion ratios of in- dividual SWT samples of the three subject groups are also shown in Figure2B. The (Cl−+ Na+)/K+ion ratio values of CF patients ranged from 3.6 to 31.1 (mean: 10.9; median: 10.4), those of controls ranged from 0.9 to 7.3 (mean: 2.5; median: 2.2), and those of healthy carriers ranged from 0.9 to 9.0 (mean: 2.8; median: 2.5). When the optimum (Cl−+ Na+)/K+ion ratio cutoff value of 5.0 (calculated in the XlStat
software) was used, high sensitivity (99.1%) and specificity (94.0%) of the method were achieved. Using the extended ion ratio cutoff value of 5.0, all CF patients except one were diagnosed correctly. Two controls and six healthy carriers had extended ion ratio values above the cutoff value. PPV and NPV were thus 93.4% and 99.2%, respectively.
3.4 | Macroduct sweat analysis
Sweat samples collected by the Macroduct collection device at the same time as the SWT samples were taken from all subjects. The chloride concentrations of the 114 CF patients ranged from 36 to 138 mmol/L (mean: 96.3 mmol/L; median: 97.0 mmol/L), chloride concentrations of the 58 controls ranged from 4 to 30 mmol/L (mean: 12.4 mmol/L;
median: 10.0 mmol/L), and chloride concentrations of the 76 healthy carriers ranged from 4 to 26.0 mmol/L (mean: 9.7 mmol/L; median:
9.0 mmol/L). The results are shown in Figure2C. Using the official cutoff value for Macroduct ST higher or equal to 60 mmol/L, all except two CF patients were diagnosed correctly, while all healthy carriers and con- trols had the chloride values below 59 mmol/L. The sensitivity of the ST method was thus 98.3% and its specificity was 100.0%. PPV and NPV were 100.0% and 98.5%, respectively.
3.5 | Receiver operating characteristics
The graphs of ROC curves were constructed (Figure3) to describe the diagnostic ability of the method. The ROC curves were F I G U R E 1 Electropherograms of clinical skin wipe samples. For each group of skin wipe extracts from CF patients, healthy CF carriers, and healthy controls both cations (NH4+, K+, Ca2+, Na+, Mg2+
) and anions (Cl−) were analyzed. Capillary electrophoresis conditions are described in Section2.2. CF, cystic fibrosis [Color figure can be viewed atwileyonlinelibrary.com]
constructed for both methods while using the ion ratio Cl−/K+ (Figure3A) and the extended ion ratio (Cl−+ Na+)/K+(Figure3B) as diagnostic parameters. The cutoff values were chosen to yield the highest possible sensitivity and specificity of the method. Graphs of the dependencies of sensitivity and specificity of the methods on the ion ratio Cl−/K+cutoff values and the ion ratio (Cl−+ Na+)/K+cutoff values are shown in Figure3C,D.
4 | D I S C U S S I O N
The developed SWT sampling is a very fast and simple procedure.
The SWT sample is obtained in approximately 7 minutes, which time includes the forearm cleaning, waiting period for spontaneous sweat formation, skin wiping, and extraction into DI water. By contrast, a complete ST sampling procedure employing pilocarpine sweat induction and collection by Macroduct device takes approxi- mately 45 minutes. Cost of sampling also is significantly reduced (0.1 USD/per sample with the SWT method in comparison to approximately 30 USD/per sample with the Macroduct). The cost of consumables for one analysis by CE and Chlorocheck Chloridometer are comparable. The initial cost of the CE‐C4D instrument is about three to four times higher than the price of Chlorocheck Chloridometer used to analyze chloride in sweat samples obtained by Macroduct device. The total price difference is approximately 28.000 USD. Considering a medium size CF center that analyzes approximately 1000 sweat samples per year and the material saving of 29.9 USD per sample using the SWT compared to Macroduct, the higher acquisition cost of the instrument will be compensated for in about 1 year or after analyzing 1000 samples.
One inherent advantage of the SWT sampling is that even though the rate of sweating in some individuals is extremely low, the 3‐minute spontaneous sweat formation period is sufficient to obtain a suitable sample specimen for analysis by CE‐C4D. This is due to the high analytical sensitivity of the CE‐C4D method, which is about 1000‐fold more sensitive than is the conventional coulometric analysis. The performance of our method is important especially for NBS, because insufficient sweat is sometimes obtained when collecting from infants.
The analysis of SWT samples by an automated CE‐C4D instru- ment is principally possible in any biochemical laboratory or directly in the CF center, in which the sampling is performed.
Figure1illustrates the rationale for our proposed ion ratio cal- culation. The chloride peak in the CF patient is typically significantly higher than is a chloride peak in either a control or a healthy carrier.
The same is noticeable also for the Na+cation because both Cl−and Na+transport are strongly influenced in CF patients. When looking at the ratio of the peak areas, it is clearly visible that for CF patients the Cl−/K+ratio is higher than for controls or healthy carriers.
When the Cl−/K+ion ratio (cutoff value 3.9) was used with the SWT samples, the sensitivity (93.9%) was lower than that of the ST method using Cl−concentration alone (98.3%). The specificity of the F I G U R E 2 Cl−/K+ion ratio values (top), extended (Cl−+ Na+)/K+ion
ratio values (middle) in skin wipe samples, and Cl−values in Macroduct ST samples (bottom) of CF patients (circles), healthy controls (squares), and healthy CF carriers (triangles). SWT samples were collected by the skin wipe sampling procedure described in Section2.1. and analyzed by the capillary electrophoresis system described in Section2.2. ST samples were collected by the Macroduct device and analyzed by coulometry described in Section2.3. The diagnostic borderline values for the Cl−/K+ion ratio (3.9), for the (Cl−+ Na+)/K+ion ratio (5.0), and for the Cl−value (60 mmol/L) are depicted by the solid line, lower borderline value (30 mmol/L) for Macroduct ST method is depicted by dashed line. CF, cystic fibrosis; ST, sweat test; SWT, skin wipe test [Color figure can be viewed atwileyonlinelibrary.com]
ST method was slightly better (100.0%) compared to the 97.8%
specificity of the SWT method. Seven CF patients had the Cl−/K+ion ratio lower than the cutoff value of 3.9, while showing no common feature in terms of the type of CFTR mutation (five patients carrying F508del/F508del, one patient carrying F508del/3849+10kbC>T, and 1 patient carrying S549N/c.4272C>G, p.Tyr1424Ter [sequence variation]).
When Cl− concentration alone was chosen as a diagnostic parameter with a cutoff value of higher or equal to 60 mmol/L, among the 114 samples of CF patients, 2 CF patients had Cl−con- centration less than 59 mmol/L. These two CF patients are carrying the F508del/3849+10kbC>T mutation. The F508del/
3849+10kbC>T mutation is included in the mutation class V, generally known to cause lower Cl−concentrations in sweat than do more severe mutation types. All healthy carriers and control ST samples had Cl− concentrations less than 30 mmol/L (indicating 100.0% specificity of the method).
The sensitivity of the SWT method improved significantly to 99.1% when the extended ion ratio (Cl−+ Na+)/K+and a cutoff value of 5.0 was used (Figure3). In native sweat gland ducts, CFTR and
the epithelial Na+ channels (ENaC) reside in the same apical membrane.22,23 Reddy and Quinton24 have shown that the con- ductance of ENaC is strongly dependent on the CFTR Cl−channel function, resulting in elevated concentrations of both Cl−and Na+in the sweat of CF patients. On the contrary, the role K+is not clear in CF. The use of extended ion ratio (Cl−+ Na+)/K+ was thought to improve the method sensitivity. Using the extended ion ratio and selecting the cutoff value of 5.0 only one CF patient (F508del/
F508del) had a cutoff value below this threshold. To obtain the highest possible sensitivity is of utmost importance in any diagnostic method. This is especially true in the case of CF, where early diag- nosis can improve the patient's prognosis. Some of the healthy carriers and controls (in total seven samples) had however the extended ion ratio higher than the cutoff value, leading to specificity of 94.0%. However, there were more healthy CF carriers (specificity 92.1%) than controls (specificity 96.6%). The reason for the higher number of the healthy carriers is currently unknown. One might speculate that ion transport is somewhat influenced in some of the healthy carriers and that these subtle changes are detected in some individuals by the SWT method but not by the ST method. A detailed F I G U R E 3 Comparison of receiver operating characteristic curves while using Cl−/K+ion ratio (A) and (Cl−+Na+)/K+ion ratio (B) as diagnostic parameters. Dependences of sensitivity and specificity on Cl−/K+ion ratio borderline (C) and (Cl−+Na+)/K+ion ratio borderline (D) values are shown [Color figure can be viewed atwileyonlinelibrary.com]
investigation of these specific cases would be required. The sensi- tivity and specificity of a new method relies upon well‐defined groups. The quality of information about the CF cohort and healthy carrier cohort enabled reliable definition. The limitation of this study is that the control group was not ideally defined, as we had no knowledge of the individuals’DNA backgrounds. The control group subjects had been sent for sweat testing by their family physicians for various reasons (mainly cough), and negative ST was considered suf- ficient to exclude CF. Therefore, a detailed study with genotyping the selected controls would be required and is planned in the future.
Another limitation of this study includes the different age of the subjects in the three groups. The mean age of the control group and the healthy carrier group was 3.5 and 0.3 years, respectively. The mean age of the CF patient group was 8.3 years. The reason for this difference is that the subjects in the control group and the healthy carrier group were mainly infants captured during the NBS pro- gramme at the age 1 year or less and only a few older children. On the contrary, although the CF group included significant number of CF patients captured by the NBS (<1 year of age) it was not possible to obtain significant number of new CF patients even within the 3‐year sampling period. Therefore, this group contains significant number of CF patients diagnosed earlier, being between 2 and 20 years of age.
Future studies comparing age‐matched groups are planned.
In Figure3the ROC curves show an excellent performance of the SWT method. A large area under the curve was found (AUC, 0.9935‐0.9937), demonstrating an excellent capability for distinguishing the CF from the non‐CF patients. This result demon- strates that the use of ion ratios and extended ion ratios is excellent for diagnostic purposes.
The SWT method with CE‐C4D analysis for diagnosis of CF is comparable in performance to the Macroduct ST, but it offers several unique features. First, because there is no need for sweat induction, the entire procedure is greatly simplified and application of pilo- carpine using iontophoresis is wholly avoided. Second, the SWT method is inexpensive. This aspect is significant, as the savings in diagnosis costs could be more efficiently used. For instance, more resources could be devoted to making specific care available to more CF patients. This aspect can be especially pertinent in developing countries where health care spending is low. The SWT is also sig- nificantly faster, thus reducing labor cost and allowing for more tests to be performed in the same amount of time. Third, as discussed above, due to the inherently low limits of detection of the CE‐C4D analytical method and the nature of the SWT sampling method, a specimen is always obtained, even in very young infants (the youngest infant in this study was 15 days old). The SWT may thus be used in specific cases when sweat is difficult to obtain, and especially during NBS. Apart from very young infants, difficulty in obtaining sufficient sweat occurs more often also in non‐white infants.25 Analysis of the samples can be fully automated, as commercial CE instruments are available and the analytical cost is not significantly higher than is the coulometric analysis presently in use. It can be envisioned that SWT could be used in the future as a part of NBS programs and that the results obtained could be used together with
IRT and genetic screens to preselect patients requiring a con- firmatory ST (or repeated SWT) to verify the diagnosis. The SWT method, therefore, evidence significant promise to become a new parameter in CF diagnostics.
A C K N O W L E D G M E N T S
The authors have no perceived conflicts of interest. The authors acknowledge financial support from the Ministry of Health of the Czech Republic (grant no.: NV18‐08‐00189). This study was carried out under the project CEITEC 2020 (LQ1601) with financial support from the Ministry of Education, Youth and Sports of the Czech Republic under the National Sustainability Programme II.
O R C I D
Petr Kubáň http://orcid.org/0000-0002-4056-5570
R E F E R E N C E S
1. Castellani C, Massie J, Sontag M, Southern KW. Newborn screening for cystic fibrosis.Lancet Respir Med. 2016;4:653‐661.
2. Gibson LE, Cooke RE. A test for concentration of electrolytes in sweat in cystic fibrosis of the pancreas utilizing pilocarpine by iontophoresis.
Pediatrics. 1959;23:545‐549.
3. ELITechGroup, Macroduct® Sweat Collection System; c2019.https://
www.elitechgroup.com/product/macroduct‐sweat‐collection‐system#
tab‐features
4. Cirilli N, Southern KW, Buzzetti R, et al. Real life practice of sweat testing in Europe.J Cyst Fibros. 2018;17:325‐332.
5. Vermeulen F, Lebecque P, De Boeck K, Leal T. Biological variability of the sweat chloride in diagnostic sweat tests: a retrospective analysis.
J Cyst Fibros. 2017;16:30‐35.
6. Vermeulen F, Le Camus C, Davies JC, Bilton D, Milenkovic D, De Boeck K. Variability of sweat chloride concentration in subjects with cystic fibrosis and G551D mutations.J Cyst Fibros. 2017;16:
36‐40.
7. Vernooij‐van Langen A, Dompeling E, Yntema JB, et al. Clinical evaluation of the Nanoduct sweat test system in the diagnosis of cystic fibrosis after newborn screening. Eur J Pediatr. 2015;174:
1025‐1034.
8. Lezana JL, Vargas MH, Karam‐Bechara J, Aldana RS, Furuya ME.
Sweat conductivity and chloride titration for cystic fibrosis diagnosis in 3834 subjects.J Cyst Fibros. 2003;2:1‐7.
9. Hodson ME, Beldon I, Power R, Duncan FR, Bamber M, Batten JC.
Sweat test to diagnose cystic fibrosis in adults.Br Med J. 1983;286:
1381‐1383.
10. Mishra A, Greaves R, Massie J. The limitation of sweat electrolyte reference intervals for the diagnosis of cystic fibrosis: a systemic review.Clin Biochem Rev. 2007;28:60‐66.
11. Farrell PM, Rosenstein BJ, White TB, et al. Guidelines for diagnosis of cystic fibrosis in newborns through older adults: cystic Fibrosis Foundation consensus report.J Pediatr. 2008;153(2):S4‐S14.
12. Green A, Dodds P, Pennock C. A study of sweat sodium and chloride— criteria for the diagnosis of cystic fibrosis.Ann Clin Biochem. 1985;22:
171‐176.
13. Traeger N, Shi Q, Dozor AJ. Relationship between sweat chloride, sodium and age in clinically obtained samples.J Cyst Fibros. 2014;
13:10‐14.
14. Choi DH, Kim JS, Cutting GR, Searson PC. Wearable potentiometric chloride sweat sensor: the critical role of the salt bridge.Anal Chem.
2016;88:12241‐12247.
15. Choi DH, Thaxton A, Jeong IC, et al. Sweat test for cystic fibrosis:
wearable sweat sensor vs. standard laboratory test. J Cyst Fibros.
2018;17:e35‐e38.
16. Rock MJ, Makholm L, Eickhoff J. A new method of sweat testing: the CF quantum (R) sweat test.J Cyst Fibros. 2014;13:520‐527.
17. Kuban P, Gregus M, Pokojova E, Skrickova J, Foret F. Double opposite end injection capillary electrophoresis with contactless conductometric detection for simultaneous determination of chloride, sodium and po- tassium in cystic fibrosis diagnosis.J Chromatogr A. 2014;1358:293‐298.
18. Durc P, Foret F, Pokojova E, et al. New approach for cystic fibrosis diagnosis based on chloride/potassium ratio analyzed in non‐ invasively obtained skin‐wipe sweat samples by capillary electro- phoresis with contactless conductometric detection.Anal and Bioanal Chem. 2017;409:3507‐3514.
19. Farrell PM, White TB, Ren CL, et al. Diagnosis of cystic fibrosis:
consensus guidelines from the cystic fibrosis foundation.J Pediatr.
2017;181:S4‐S15.e1.
20. Zielinski J, Tsui LC. Cystic fibrosis: genotypic and phenotypic varia- tions.Annu Rev Genet. 1995;29:777‐807.
21. Castellani C, Duff AJA, Bell SC, et al. ECFS best practice guidelines:
the 2018 revision.J Cyst Fibros. 2018;17:153‐178.
22. Reddy MM, Quinton PM. Altered electrical potential profile of human reabsorptive sweat duct cells in cystic fibrosis.Am J Physiol. 1989;257:
C722‐C727.
23. Reddy MM, Quinton PM. Deactivation of CFTR‐Cl conductance by endogenous phosphatases in the native sweat duct. Am J Physiol.
1996;270:C474‐C480.
24. Reddy MM, Quinton PM. Functional interaction of CFTR and ENaC in sweat glands.Pflugers Arch—Eur J. Physiol. 2003;445:499‐503.
25. Laguna TA, Lin N, Wang Q, Holme B, McNamara J, Regelmann WE.
Comparison of quantitative sweat chloride methods after positive newborn screen for cystic fibrosis. Pediatr Pulmonol. 2012;47:
736‐742.
S U P P O R T I N G I N F O R M A T I O N
Additional supporting information may be found online in the Supporting Information section.
How to cite this article:ĎurčP, Foret F, Homola L, et al. Skin wipe test: A simple, inexpensive, and fast approach in the diagnosis of cystic fibrosis.Pediatric Pulmonology. 2020;55:
1653–1660.https://doi.org/10.1002/ppul.24758