Article
A New Concept to Secure Food Safety Standards against Fusarium Species and Aspergillus Flavus and Their Toxins in Maize
Balazs Szabo1,2 , Beata Toth1,2, Eva Toth Toldine2, Monika Varga1,2, Nandor Kovacs2, Janos Varga3, Sandor Kocsube3, Andrea Palagyi3, Ferenc Bagi4, Dragana Budakov4,
Vera Stojšin4, Sanja Lazi´c4, Marija Bodroža-Solarov5 , Radmilo ˇColovi´c5, Goran Bekavac6, Božana Purar6, Djordje Jockovi´c6and Akos Mesterházy2,*
1 Department of Field Crops Research, NARIC, 6726 Szeged, Hungary; szabob@gabonakutato.hu (B.S.);
beata.toth@gabonakutato.hu (B.T.); varga.j.monika@gmail.com (M.V.)
2 Cereal Research Nonprofit Ltd., 6726 Szeged, Hungary; zsigi2011@gmail.com (E.T.T.);
nandor.kovacs@gabonakutato.hu (N.K.)
3 Department of Microbiology, Faculty of Science and Informatics, University of Szeged, 6726 Szeged, Hungary; shigsanyi@gmail.com (S.K.); andrea.palagyi@gabonakutato.hu (A.P.)
4 Faculty of Agriculture, University of Novi Sad, Novi Sad 21000, Serbia; bagifer@polj.uns.ac.rs (F.B.);
dbudakov@polj.uns.ac.rs (D.B.); stojsinv@polj.uns.ac.rs (V.S.); sanjal@polj.uns.ac.rs (S.L.)
5 Institute of Food Technology, Novi Sad 21000, Serbia; marija.bodroza@fins.uns.ac.rs (M.B.-S.);
radmilo.colovic@fins.uns.ac.rs (R. ˇC.)
6 Institute of Field and Vegetable Crops, Novi Sad 21000, Serbia; goran.bekavac@nsseme.com (G.B.);
bozana.purar@ifvcns.ns.ac.rs (B.P.); djordje.jockovic@ifvcns.ns.ac.rs (D.J.)
* Correspondence: akos.mesterhazy@gabonakutato.hu; Tel.: +36-30-415-9730
Received: 27 July 2018; Accepted: 5 September 2018; Published: 13 September 2018 Abstract:Commercial maize hybrids are exposed to different degrees of ear infection by toxigenic fungal species and toxin contamination. Their resistance to different fungi and toxin relationships are largely unknown. Without this knowledge, screening and breeding are not possible for these pathogens. Seven- to tenfold differences were found in resistance toFusariumspp., and there was a five-fold difference in ear coverage (%) in response toA. flavus. Three hybrids of the twenty entries had lower infection severity compared with the general means for toxigenic species. Three were highly susceptible to each, and 14 hybrids reacted differently to the different fungi. Differences were also observed in the toxin content. Again, three hybrids had lower toxin content in response to all toxigenic species, one had higher values for all, and 16 had variable resistance levels. Correlations between infection severity and deoxynivalenol (DON) content were 0.95 and 0.82 (p= 0.001) forF. graminearum andF. culmorum,respectively. For fumonisin andF. verticillioidesear rot, the Pearson correlation coefficient (r) was 0.45 (p= 0.05). Two independent isolates with different aggressiveness were used, and their mean X values better described the resistance levels. This increased the reliability of the data. With the introduction of this methodological concept (testing the resistance levels separately for different fungi and with two isolates independently), highly significant resistance differences were found. The resistance to different fungal species correlated only in certain cases; thus, each should be tested separately. This is very useful in registration tests and post-registration screening and breeding.
This would allow a rapid increase in food and feed safety.
Keywords: Fusarium culmorum; Fusarium graminearum; Fusarium verticillioides; Aspergillus flavus;
resistance; mycotoxins; complex resistance to pathogens and toxins; food safety
Key Contribution: The resistance background against the most important toxigenic species is different. Therefore the resistance should be tested separately otherwise the food safety risks cannot be estimated. The different isolates of the same species often give diverging results, therefore at
Toxins2018,10, 372; doi:10.3390/toxins10090372 www.mdpi.com/journal/toxins
Toxins2018,10, 372 2 of 25
least two isolates should be used independently to reach more reliable results. In many cases the ear rot coverage and toxin contamination give good or acceptable correlation, but without direct toxin measurements a correct forecast for the food safety risk of the given hybrid cannot be done.
1. Introduction
Maize is one of the most important cereals in the world. This crop is a regular host of toxigenic fungi infecting the ears, which can cause very high losses in crop yield. In contrary to wheat where F. graminearumis the leading toxigenic species nearly everywhere, the situation is more complex in maize, where at least two leading species exist fromFusariumandAspergillus,with similar significance, but different amounts in different years.
Pathogens: Logrieco et al. [1] mentioned 19Fusariumspp. of maize in Europe. However, the most important species in most regions areF. graminearum,F. verticillioides. Therefore, their control is needed in every corn production area. In Hungary,F. graminearumandF. verticillioidesare the most important [2]. In drier years the latter species is dominant. In wet years, such as 1974, the number of species increased to 16, includingF. graminearum(30%),F. verticillioides(27%),F. culmorum(4%), F. fusarioides (3%), F. avenaceum (1%), F. sporotrichioides (6%), F. poae (2%), F. semitectum (4%) and several others with 554 isolates. The dry year of 1975 saw a 28% occurrence ofF. graminearum, 69%
ofF. verticillioides, and the rest made up 3% of the species represented by several entries ofn= 645 isolates. The case is similar in all countries where data fromFusariumsurveys exist (Mesterházy [3], Table1). BecauseF. moniliformewas reclassified toF. verticillioides[4], the position ofF. graminearum, Gibberella zeae) remained. Many newFusariumspp. were described or reclassified, but these changes do not interfere with our two main causing agents. As more than 90% of theF. graminearumisolates of wheat belong toF. graminearum stricto senso[5], we focused in this study on this specimen.F. boothi, for example, produces nivalenol (2 isolates of the 29) [5]. In 2007,A. flavusoccurred at a higher rate in Hungary, and aflatoxin-contaminated grain was also detected. In 2012, the aflatoxin contamination rate was high, and 2017 a smaller epidemic occurred. Due to global warming, the occurrence of aflatoxin in the field was predicted to reach significant rates in epidemic years; therefore, resistance toA. flavus was also chosen for testing.
Environmental/weather conditions, toxigenic species and toxins. The three main pathogens mentioned need humid and moderately warm weather to infect silks and later the cobs. Thereafter, F. graminearumneeds humidity and warmth, but not very warm or hot weather,F. verticillioidesneeds warmer and drier conditions, andAspergillus flavusneeds the hottest conditions, especially for toxin accumulation [3]. This means that in some years, only fumonisin, DON or aflatoxin occur; in another years, all combinations are possible at a high risk level. Experience throughout many decades shows that high toxin contamination is associated with outbreaks of significant epidemics. From this we may conclude that susceptibility relies somehow on disease epidemics and toxin contamination as summarized by Clements and White [6], Mesterházy et al. [3], Munkvold [7], Reid et al. [8]. For this reason, breeding for resistance has become a significant goal to decrease both disease severity and toxin contamination. Several authors such as Boling et al. [9], King et al. [10], Chaing et al. [11], Cullen et al. [12] mention resistance to disease (no toxins were measured). Others concentrate on the resistance to toxin, such as Brown et al. [13] Bolduan et al. [14], others look at genetic factors being specific in toxin contamination [15,16] but do not consider symptoms, and others investigate both disease severity and toxin contamination together [17–19]. Menkir et al. [20] reported on germplasms with resistance to aflatoxin contamination. Looking more closely at the data, we see that the resistance to toxin and disease do not overlap in every case. We do not know whether this is due to some additional metabolic pathways beside resistance. Complete agreement does not seem to be apparent between resistance and toxin accumulation. Since toxins have in most cases undergone strict regulation in human consumption, and restrictions in animal husbandry have also been suggested; the task now
at hand is to achieve a low toxin contamination level. It is not clear what the real relationships are, but many independent data confirm a rather good and useful correlation between resistance to infection severity and toxin contamination; see Mesterhazy et al. [3].
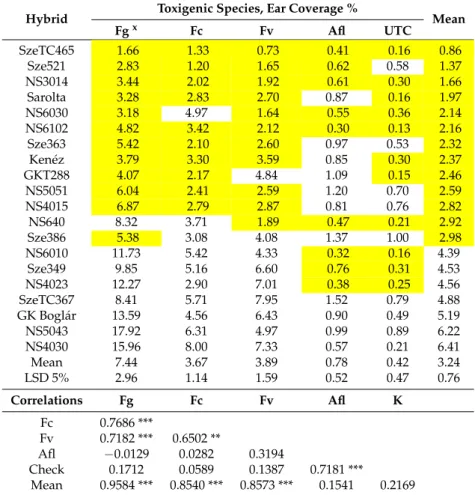
Table 1.Ear rot coverage as a percentage of maize hybrids in the resistance tests; 2012–2013 across years, locations and isolates.
Hybrid Toxigenic Species, Ear Coverage %
Mean
Fgx Fc Fv Afl UTC
SzeTC465 1.66 1.33 0.73 0.41 0.16 0.86
Sze521 2.83 1.20 1.65 0.62 0.58 1.37
NS3014 3.44 2.02 1.92 0.61 0.30 1.66
Sarolta 3.28 2.83 2.70 0.87 0.16 1.97
NS6030 3.18 4.97 1.64 0.55 0.36 2.14
NS6102 4.82 3.42 2.12 0.30 0.13 2.16
Sze363 5.42 2.10 2.60 0.97 0.53 2.32
Kenéz 3.79 3.30 3.59 0.85 0.30 2.37
GKT288 4.07 2.17 4.84 1.09 0.15 2.46
NS5051 6.04 2.41 2.59 1.20 0.70 2.59
NS4015 6.87 2.79 2.87 0.81 0.76 2.82
NS640 8.32 3.71 1.89 0.47 0.21 2.92
Sze386 5.38 3.08 4.08 1.37 1.00 2.98
NS6010 11.73 5.42 4.33 0.32 0.16 4.39
Sze349 9.85 5.16 6.60 0.76 0.31 4.53
NS4023 12.27 2.90 7.01 0.38 0.25 4.56
SzeTC367 8.41 5.71 7.95 1.52 0.79 4.88
GK Boglár 13.59 4.56 6.43 0.90 0.49 5.19
NS5043 17.92 6.31 4.97 0.99 0.89 6.22
NS4030 15.96 8.00 7.33 0.57 0.21 6.41
Mean 7.44 3.67 3.89 0.78 0.42 3.24
LSD 5% 2.96 1.14 1.59 0.52 0.47 0.76
Correlations Fg Fc Fv Afl K
Fc 0.7686 ***
Fv 0.7182 *** 0.6502 **
Afl −0.0129 0.0282 0.3194
Check 0.1712 0.0589 0.1387 0.7181 ***
Mean 0.9584 *** 0.8540 *** 0.8573 *** 0.1541 0.2169
Fgx=F. graminearum, Fc =F. culmorum, Fv =F. verticillioides, Af =A. flavus. ***p= 0.001, **p= 0.01. Highlighted:
data: lower than mean for the given trait, UTC = untreated control, natural infection.
Economic significance.The harvested yield loss is regularly lower than the much larger problems caused by the toxins because farmers may suffer total financial loss when the yield contains toxins above certain regulated limits. Then, the grain can become unsuitable for food and feed. About one third (own estimation AM) of the total crop value was lost in 2014 in Hungary (about 330 million Euros), partly because of lowered prices because of higher toxin contamination, and partly due to losses in animal husbandry and additional costs of toxin binders, medication, etc. This epidemic again underlined the necessity of higher resistance levels in maize production. Nobody has exact data about losses in yield, value of the crop, or health costs in the human population and animal husbandry. However, we would be surprised if it would be globally lower than several billion dollars.
Hungary and Serbia have hadFusariumproblems for a long time [21,22] and selection programs have started with moderate success. This, combined with the appearance of aflatoxin-producing species, especiallyAspergillus flavus, resulted in aflatoxin contamination above the EU limit in 2007, 2012 and at a lower degree in 2017. This alerted plant breeders and the milk industry in Northern Italy, Serbia, Slovenia, Croatia, Romania and in Hungary [23–26]. It seems that aflatoxin will not be a transitional problem we mentioned earlier. Battilani et al. [27] indicated a very strong predicted increase in aflatoxin contamination for nearly all of France, the whole of the Carpathian Basin and the Balkan area when the average temperature increases by 2◦C. At an increase of 5◦C, nearly all of
Toxins2018,10, 372 4 of 25
mainland Europe except Scandinavia will become moderately or heavily contaminated areas. For this reason, thisAspergillusand aflatoxin problem should be taken seriously.
Breeding aspects of resistance.The most important fact is that at present, knowledge of complete resistance does not exist against any of the toxigenic species; what we have is a partial one at different degrees or none at all. In the past decades, most breeders favored natural infection. They were and are mostly convinced that this is the right way. They think that during the long years of variety breeding and testing, the probability is high enough to select the most resistant plants and hybrids. The variety registration and post registration were proved in the highly epidemic years; however, the disease pressure under natural infection is not enough to find the best ones—maybe it can be suitable to discard the most susceptible ones. We should add that the toxigenic species rapidly change from year to year. After a ‘F. graminearum’ year, we might have a ‘F. verticillioides’ or an ‘A. flavus’ year or any combination of them. As we do not have any proof that the resistance to different toxigenic fungi would be the same, the data speak against it, and natural infection does not allow a solid base for the breeding of more resistant hybrids. Therefore, most of the hybrids belong to the susceptible or very susceptible category. When we see the literature, in most cases, the breeding started only against the most important species. In best cases, two species are involved, but never more. It seems that the breeding and registration system could not adapt to the genetic background of the resistance.
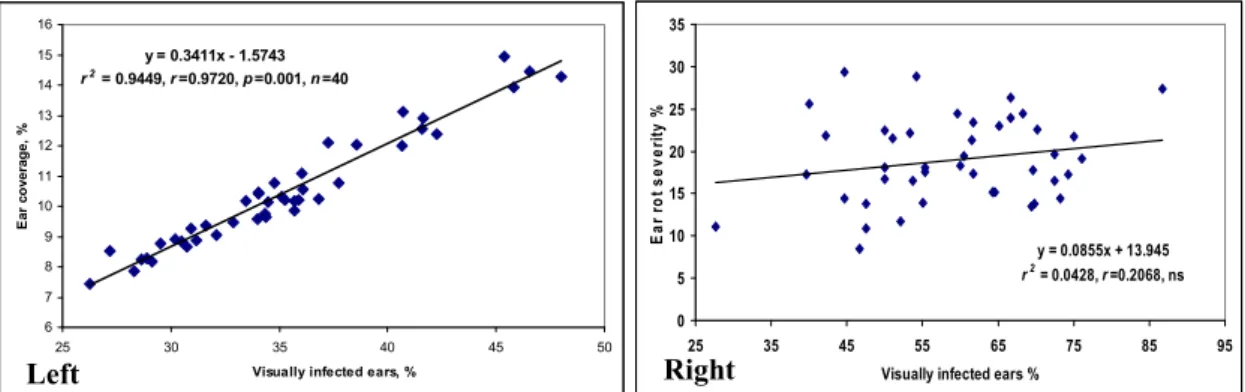
In the cases of variety registration, only natural infection was considered in Hungary and elsewhere [3]. Severe epidemics were rare, but 2010 showed a nation-wide epidemic. The maize post registration test, sown this year and performed in eight locations (Figure1) by the National Variety Office NEBIH, Hungary [28] with the support of the Association of Cereal Growers, Hungary brought important results. The mean data for infected ears from the total are given as a percentage, and the ear coverage is also rated as a percentage. The correlation is close, indicating that a higher ratio of infected ears correlates well with the infected ear surface. The most resistant hybrid had a 26.3% visual rate and 7.5% coverage (Figure1, left panel). The toxin content was not measured, but such infection severity like this normally causes toxin levels to rise far above the toxin limit. When considering the most severe epidemic in Eszterágpuszta, the least infected hybrid had a 26% rate out of the total, and an 11% ear area showed visible infection. The maximum was 85% and 29.4%, respectively (Figure1, right panel). The conclusion is clear: very resistant hybrids do not exist in this group. Therefore, the breeding efforts of various breeding firms are by far not enough to give farmers a chance to produce healthy grain when they face an epidemic that might not occur every year. The situation is slowly changing, however, because farmers look for better hybrids in this respect.
The reason is simple: they are pressured to keep toxin contamination levels under control. The other important conclusion is that in spite of the lack of the hybrids in the most resistant regions, we have a significant variability in resistance indicating a utilization of these differences. With the withdrawal of the susceptible hybrids from commercial production food safety, there would be a sharp increase in food and feed safety. Then, the breeding efforts could result in further significant improvement in food and feed safety.
For the reasons above, artificial inoculation methods should be introduced and applied at a much higher level than previously used in registration and breeding.
The artificial inoculations are normally conducted with a pure isolate or a mixture of isolates, but a mixture of different species can also be the case [3]. In wheat, we have learned that the different isolates have different aggressiveness; therefore, gathering data during epidemics at different severity may help to produce more reliable resistance data [29–31]. For this reason, we wanted to test our hypothesis (more isolates of the same species are used separately to have more reliable results) in maize.
Statistically significant resistance differences toFusariumspp. [3] andA. flavusalready exist [13,32–35], and all fungal species should be treated together (Fusariumspp.,A. flavus) as they will remain important players also in the future.
Figure 1. Natural infection of top maize hybrids in the post registration test organized by the National Alliance of cereal growers, performed by the National Variety Office (NÉBIH) 2010. (Left panel) Mean for eight locations, (Right panel) the most severely infected location, Eszterágpuszta.
For the reasons above, artificial inoculation methods should be introduced and applied at a much higher level than previously used in registration and breeding.
The artificial inoculations are normally conducted with a pure isolate or a mixture of isolates, but a mixture of different species can also be the case [3]. In wheat, we have learned that the different isolates have different aggressiveness; therefore, gathering data during epidemics at different severity may help to produce more reliable resistance data [29–31]. For this reason, we wanted to test our hypothesis (more isolates of the same species are used separately to have more reliable results) in maize. Statistically significant resistance differences to Fusarium spp. [3] and A. flavus already exist [13,32–35], and all fungal species should be treated together (Fusarium spp., A. flavus) as they will remain important players also in the future.
A real answer to the question of the resistance level and resistance specificity or non-specificity cannot be expected from steadily changing natural infection and steadily changing fungal populations. Even though we have data about resistance correlations of toxigenic species in maize, from the toxigenic species, a maximum of two were involved, but not more. In several cases, a correlation was found between F. graminearum and F. verticillioides, and in other cases between A.
flavus and F. verticillioides (see details in the review by Mesterhazy et al. [3], but not in every case.
What this means for us as researchers is that we should provide reliable data for the farmers and breeders on resistance behavior of the hybrids to all fungi. The data we have now show that relationships between resistances to different toxigenic species might be present, but not necessarily so. Therefore, we should test the hybrids separately against the most important toxigenic fungi to observe their resistance, toxin contamination and estimate their safety risks to individual pathogens and consider them together.
In this paper, our objectives were as follows: (1) To test the resistance of Hungarian and Serbian maize hybrids against toxigenic fungi such as F. graminearum, F. culmorum, F. verticillioides and A.
flavus. (2) To test toxin contamination following artificial inoculation. (3) To test the use of more isolates separately. (4) To suggest a screening methodology that allows the preference of multi toxigenic fungal resistance in maize hybrids and thereby significantly improve food and feed safety.
2. Results
2.1. Ear Rot
In this section, we aimed to compare the general means of infection to the different toxigenic species. Then, we present the ANOVA for the whole tests and also the ANOVA for every toxigenic species separately, and thereafter also the isolate specific data. As the dominant species dominate less pathogenic F. verticillioides and A. flavus, a Pearson range correlation test was also conducted to compare ranges and assess the stability of the genotypes to different toxigenic species. All tables and figures show results of two years and locations. This is true for the Figures 2–5.
y = 0.3411x - 1.5743 r2 = 0.9449, r=0.9720, p=0.001, n=40
6 7 8 9 10 11 12 13 14 15 16
25 30 35 40 45 50
Visually infected ears, %
Ear coverage, %
y = 0.0855x + 13.945 r2 = 0.0428, r=0.2068, ns 0
5 10 15 20 25 30 35
25 35 45 55 65 75 85 95
Visually infected ears %
Ear rot severity %
Right Left
Figure 1.Natural infection of top maize hybrids in the post registration test organized by the National Alliance of cereal growers, performed by the National Variety Office (NÉBIH) 2010. (Leftpanel) Mean for eight locations, (Rightpanel) the most severely infected location, Eszterágpuszta.
A real answer to the question of the resistance level and resistance specificity or non-specificity cannot be expected from steadily changing natural infection and steadily changing fungal populations.
Even though we have data about resistance correlations of toxigenic species in maize, from the toxigenic species, a maximum of two were involved, but not more. In several cases, a correlation was found betweenF. graminearumandF. verticillioides, and in other cases betweenA. flavusandF. verticillioides (see details in the review by Mesterhazy et al. [3], but not in every case.
What this means for us as researchers is that we should provide reliable data for the farmers and breeders on resistance behavior of the hybrids to all fungi. The data we have now show that relationships between resistances to different toxigenic species might be present, but not necessarily so. Therefore, we should test the hybrids separately against the most important toxigenic fungi to observe their resistance, toxin contamination and estimate their safety risks to individual pathogens and consider them together.
In this paper, our objectives were as follows: (1) To test the resistance of Hungarian and Serbian maize hybrids against toxigenic fungi such asF. graminearum,F. culmorum,F. verticillioidesandA. flavus.
(2) To test toxin contamination following artificial inoculation. (3) To test the use of more isolates separately. (4) To suggest a screening methodology that allows the preference of multi toxigenic fungal resistance in maize hybrids and thereby significantly improve food and feed safety.
2. Results
2.1. Ear Rot
In this section, we aimed to compare the general means of infection to the different toxigenic species. Then, we present the ANOVA for the whole tests and also the ANOVA for every toxigenic species separately, and thereafter also the isolate specific data. As the dominant species dominate less pathogenicF. verticillioidesandA. flavus, a Pearson range correlation test was also conducted to compare ranges and assess the stability of the genotypes to different toxigenic species. All tables and figures show results of two years and locations. This is true for the Figures2–5.
The artificial inoculation data (Table1) show the mean ear coverage data for hybrid toxigenic species. The mean data show seven-fold differences. In this test the most pathogenic species was F. graminearum with an ear coverage of 7.4%. For F. culmorum andF. verticillioides and the least pathogenic speciesA. flavus, their mean values were significantly lower. This corresponds to the data in the literature with the difference found betweenF. graminearumandF. culmorum. The correlations between the resistances to differentFusariumspp. were significant. The resistance ofA. flavusdid not show any significant correlation with that ofFusariumspp., so a common genetic base can be excluded.
The data show that because of the large differences between toxic species the general mean should be determined by using data ofF. graminearum, which were ten times higher than theAspergillusdata.
Toxins2018,10, 372 6 of 25
More importantly, the individual species showed closer relationships between their data and mean performance, but with no significance between the data fromAspergillusand the control data. For this reason, we measured the LSD to be 5% not only for the general means, but separately also for all toxigenic species and the control, as listed below in the mean data of Table1. The lowest coverage values were found in three Szeged and one NS hybrids and in the most sensitive group, two Szeged and two NS hybrids were found. This means that in both variety groups we had a large variability among hybrids from the best to the worst. The highlighted data show the genotypes, which have a lower than the average value for the given trait. We have three hybrids where all data are below the mean and also three hybrids where all data show consequently higher infection than the mean. For the remaining 14 hybrids all possible variations occur. Counting the risk of the given hybrid, a check infection is considered like Sarolta that has a good position with respect to all toxigenic fungi, but the natural infection is higher than the mean. The best case is when all toxigenic fungi show a low value and also the control values correspond to them, e.g., for SzeTC465. NS4030 is highly susceptible to all threeFusariumspp., but has extremely high resistance toAspergillusand natural infection.
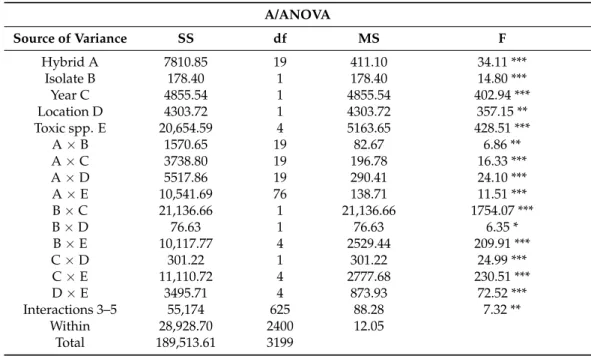
The ANOVA (Table 2) shows the influence of the main effects and their interrelationships.
The main effects and their interactions are all significant betweenp= 0.001 and 0.05. As interactions from five-way ANOVA for 3, 4 and 5 interactions are hard to interpret, we pooled (both SS and df-s) them into one common interaction that can be seen in Table2. The main effects were all highly significant, but we can estimate their relationships better from their interactions. For us, the interactions with hybrids are especially important (Table2). We see that all interactions with hybrids are much lower (more diminished) than the hybrid main effect. The hybrid main effect is superior to the A×B interaction at a significance level ofp= 0.001. We showed a significant difference between Hybrid effect (A) upon the Hybrid×Isolate (A×B) interaction, and Hybrid effect A upon Hybrid×Toxic spp.
(A×E) interaction. This means that even though the pathogenicity has a modifying effect, the decisive factor is the resistance level. For the year and location, the MS values do not differ significantly from the corresponding interactions; therefore, dominance of the main effects over these interactions cannot be determined.
Table 2.Five-way ANOVA of the ear coverage data of the maize resistance tests against toxigenic fungi in 2012–2013.
A/ANOVA
Source of Variance SS df MS F
Hybrid A 7810.85 19 411.10 34.11 ***
Isolate B 178.40 1 178.40 14.80 ***
Year C 4855.54 1 4855.54 402.94 ***
Location D 4303.72 1 4303.72 357.15 **
Toxic spp. E 20,654.59 4 5163.65 428.51 ***
A×B 1570.65 19 82.67 6.86 **
A×C 3738.80 19 196.78 16.33 ***
A×D 5517.86 19 290.41 24.10 ***
A×E 10,541.69 76 138.71 11.51 ***
B×C 21,136.66 1 21,136.66 1754.07 ***
B×D 76.63 1 76.63 6.35 *
B×E 10,117.77 4 2529.44 209.91 ***
C×D 301.22 1 301.22 24.99 ***
C×E 11,110.72 4 2777.68 230.51 ***
D×E 3495.71 4 873.93 72.52 ***
Interactions 3–5 55,174 625 88.28 7.32 **
Within 28,928.70 2400 12.05
Total 189,513.61 3199
Table 2.Cont.
Comparison of the main effects with two-ways interactions, based on MS values from Table3
A×B df 19, 19 Hybrid A/AB 4.97 ***
A×B df 1, 19 Isolate B/AB 2.16 ns
A×C df 19,19 Hybrid A/AC 2.09 ns
A×C df 1, 19 Year C/AC 24.67 ***
AD df 19, Hybrid A/AD 1.42 ns
AD df 1, 19 Location D/AD 14.82 **
AE df 19, Hybrid A/AD 2.96 *
AE df 1, 19 Toxic spp. E/AD 37.23 ***
***p= 0.001, **p= 0.01, *p= 0.05, ns = non significant.
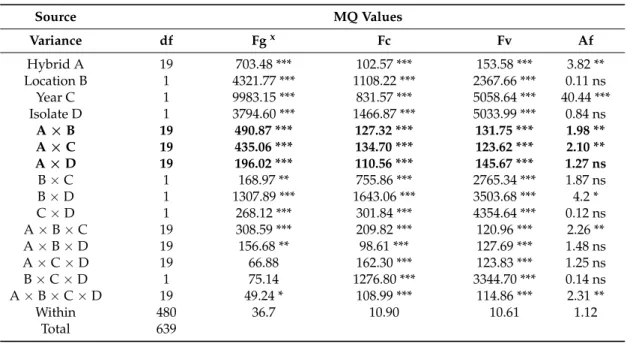
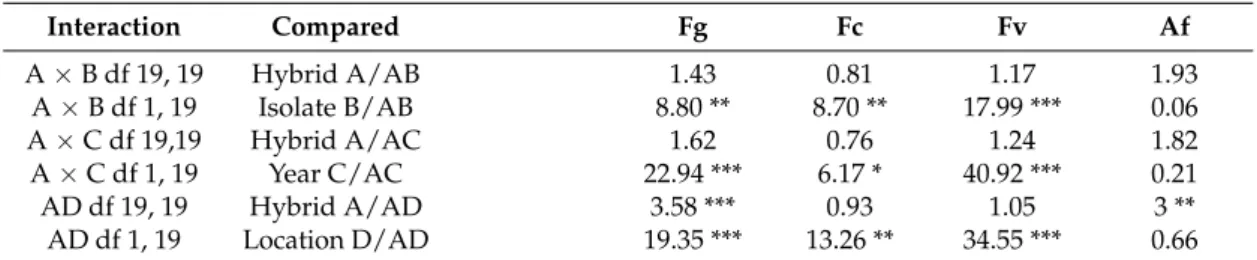
The ANOVA test, however, was only partially informative for the individual toxigenic fungi as the difference in aggressiveness was very high between them; the LSD was determined by the high F. graminearumvalues. For this reason, we also performed ANOVA for them separately. The results show (Table3) a similar pattern we had for the general ANOVA, but there were also differences.
The main effects were significant for allFusariumspp., but inA. flavusthe location and isolate did not differ significantly, e.g., their response was not different. Thus, stability seems to be higher, and the values were less influenced by isolate and location. ForF. graminearumthe hybrid effect was 1.5–4-fold higher than the two-way interactions with the hybrid component, which seemed to be more stable.
InF. culmorumthe interactions were larger than the hybrid effect, so the hybrid reaction is less exact.
F. verticillioidesis closer toF. graminearumas interactions (AB–AD) are lower than the hybrid effect but this does not reach a difference that could be considered to be significant. The location, year and isolate effects compared to the A×B, A×C and A×D interactions show a significant difference compared to the interactions in allFusariumspecies, but not inA. flavus.When considering the interactions at different toxigenic species, it is clear that the responses were different, e.g., we do not see a pattern that would be valid for all fungi. The Within values show large differences (1.12–36.7); therefore, a common analysis is possible as shown, but the species-specific ANOVAs could be performed to give a very clear picture of the data and cannot replace a general analysis as shown in Table2.
Table 3.Maize ear rot resistance tests, separate ANOVAs for the different toxic species, 2012–2013.
Source MQ Values
Variance df Fgx Fc Fv Af
Hybrid A 19 703.48 *** 102.57 *** 153.58 *** 3.82 **
Location B 1 4321.77 *** 1108.22 *** 2367.66 *** 0.11 ns
Year C 1 9983.15 *** 831.57 *** 5058.64 *** 40.44 ***
Isolate D 1 3794.60 *** 1466.87 *** 5033.99 *** 0.84 ns
A×B 19 490.87 *** 127.32 *** 131.75 *** 1.98 **
A×C 19 435.06 *** 134.70 *** 123.62 *** 2.10 **
A×D 19 196.02 *** 110.56 *** 145.67 *** 1.27 ns
B×C 1 168.97 ** 755.86 *** 2765.34 *** 1.87 ns
B×D 1 1307.89 *** 1643.06 *** 3503.68 *** 4.2 *
C×D 1 268.12 *** 301.84 *** 4354.64 *** 0.12 ns
A×B×C 19 308.59 *** 209.82 *** 120.96 *** 2.26 **
A×B×D 19 156.68 ** 98.61 *** 127.69 *** 1.48 ns
A×C×D 19 66.88 162.30 *** 123.83 *** 1.25 ns
B×C×D 1 75.14 1276.80 *** 3344.70 *** 0.14 ns
A×B×C×D 19 49.24 * 108.99 *** 114.86 *** 2.31 **
Within 480 36.7 10.90 10.61 1.12
Total 639
Toxins2018,10, 372 8 of 25
Table 3.Cont.
Comparison of the main effects to two-way interactions, based on MS values
Interaction Compared Fg Fc Fv Af
A×B df 19, 19 Hybrid A/AB 1.43 0.81 1.17 1.93
A×B df 1, 19 Isolate B/AB 8.80 ** 8.70 ** 17.99 *** 0.06
A×C df 19,19 Hybrid A/AC 1.62 0.76 1.24 1.82
A×C df 1, 19 Year C/AC 22.94 *** 6.17 * 40.92 *** 0.21
AD df 19, 19 Hybrid A/AD 3.58 *** 0.93 1.05 3 **
AD df 1, 19 Location D/AD 19.35 *** 13.26 ** 34.55 *** 0.66
***p= 0.001, **p= 0.01, *p= 0.05, ns = non significant.xFg =F. graminearum, Fc =F. culmorum, Fv =F. verticillioides, Af =A. flavus,Bold: two-way interactions containing the hybrid component.
The isolate specific data (Figure2) clearly show that the isolates of the same species do not automatically reflect the same or similar data. This is also reflected in the correlation values (see Table4). This means that we cannot obtain highly repeatable genetic results for a single inoculum.
InF. graminearumthere is a good agreement, despite the existing differences. ForF. culmorumand F. verticillioidesno significant correlation was found, e.g., the reactions to the two isolates strongly diverged. InA. flavusa medium level of correlation was observed. In 2012A. flavuswas recorded at an epidemic amount. Thus, performing theAspergillusresistance test became quite relevant and was introduced based on the observations from 2007. It is interesting thatA. flavusAF.126 reacted very similarly toF. verticillioidesSz 1.1.1 (r= 0.729,p= 0.001). F. verticillioidesSz.1.1.1 had a lower, but significant correlation ofr= 0.546 (p= 0.01) with the other isolate ofA. flavus(171). However, the data of theF. verticillioidesisolate 18TE did not have any significant relationship withA. flavus isolates. The data mean that we have no solid basis to accept the results of a single isolate as genetically valid resistance data against any toxigenic species. InF. graminearumthe tendency is similar, but the two isolates ofF. culmorumandF. verticillioidesdo not show any significant correlation for resistance.
A. flavusisolates reached a medium level significant relationship (r= 0.530,p= 0.02), so a general pattern does not exist.
Toxins 2018, 10, x FOR PEER REVIEW 8 of 25
A × B × D 19 156.68 ** 98.61 *** 127.69 *** 1.48 ns A × C × D 19 66.88 162.30 *** 123.83 *** 1.25 ns B × C × D 1 75.14 1276.80 *** 3344.70 *** 0.14 ns A × B × C × D 19 49.24 * 108.99 *** 114.86 *** 2.31 **
Within 480 36.7 10.90 10.61 1.12
Total 639
Comparison of the main effects to two-way interactions, based on MS values
Interaction Compared Fg Fc Fv Af
A × B df 19, 19 Hybrid A/AB 1.43 0.81 1.17 1.93 A × B df 1, 19 Isolate B/AB 8.80 ** 8.70 ** 17.99 *** 0.06
A × C df 19,19 Hybrid A/AC 1.62 0.76 1.24 1.82
A × C df 1, 19 Year C/AC 22.94 *** 6.17 * 40.92 *** 0.21 AD df 19, 19 Hybrid A/AD 3.58 *** 0.93 1.05 3 **
AD df 1, 19 Location D/AD 19.35 *** 13.26 ** 34.55 *** 0.66
*** p = 0.001, ** p = 0.01, * p = 0.05, ns = non significant. x Fg = F. graminearum, Fc = F. culmorum, Fv = F.
verticillioides, Af = A. flavus, Bold: two-way interactions containing the hybrid component.
The isolate specific data (Figure 2) clearly show that the isolates of the same species do not automatically reflect the same or similar data. This is also reflected in the correlation values (see Table 4). This means that we cannot obtain highly repeatable genetic results for a single inoculum. In F.
graminearum there is a good agreement, despite the existing differences. For F. culmorum and F.
verticillioides no significant correlation was found, e.g., the reactions to the two isolates strongly diverged. In A. flavus a medium level of correlation was observed. In 2012 A. flavus was recorded at an epidemic amount. Thus, performing the Aspergillus resistance test became quite relevant and was introduced based on the observations from 2007. It is interesting that A. flavus AF.126 reacted very similarly to F. verticillioides Sz 1.1.1 (r = 0.729, p = 0.001). F. verticillioides Sz.1.1.1 had a lower, but significant correlation of r = 0.546 (p = 0.01) with the other isolate of A. flavus (171). However, the data of the F. verticillioides isolate 18TE did not have any significant relationship with A. flavus isolates. The data mean that we have no solid basis to accept the results of a single isolate as genetically valid resistance data against any toxigenic species. In F. graminearum the tendency is similar, but the two isolates of F. culmorum and F. verticillioides do not show any significant correlation for resistance. A.
flavus isolates reached a medium level significant relationship (r = 0.530, p = 0.02), so a general pattern does not exist.
Figure 2. Expression of resistance based on ear rot data (coverage as %) of maize hybrids against toxigenic species and their isolates in maize hybrids against isolates of toxigenic species across years and locations, 2012–2013.
0 5 10 15 20 25
Eaer rot coverage % SzeTC465
Sze521
NS3014
Sarolta
NS6030
NS6102
Sze363
Kenéz
GKT288
NS5051
NS4015
Sze386
NS640
NS6010
Sze349
NS4023
SzeTC367
GKBoglár
NS5043
NS4030
Fg 13.05 F. Gram 13.38 F. cul 12375.2 F. cul 12551.2 F. vert 18TE F. vert SZ 1.1.1 Asp. AF 126 Asp Af 171
Figure 2. Expression of resistance based on ear rot data (coverage as %) of maize hybrids against toxigenic species and their isolates in maize hybrids against isolates of toxigenic species across years and locations, 2012–2013.
Table 4.Correlations between resistance reaction of maize hybrids against toxigenic species and their isolates across years and locations, 2012–2013.
Correlations Fg 13.38 Fg 13.05 Fc 12,551.2 Fc 12,375.2 Fv 18TE Fv SZ 1.1.1 Af 126 Af 171 Fgx13.05 0.722 ***
Fc 12,551.2 0.392 0.156
Fc 12,375.2 0.463 * 0.769 *** −0.079
Fv 18TE 0.7674 *** 0.674 ** 0.546 * 0.533 *
Fv SZ 1.1.1 0.108 −0.270 0.341 −0.092 0.111
Afl Af 126 0.047 −0.385 0.515 −0.299 0.090 0.729 ***
Afl Af 171 0.410 0.033 0.162 0.121 0.296 0.546 * 0.530 *
Check 0.316 0.085 0.078 0.040 0.081 0.498 0.405 0.790 ***
***p= 0.001, **p= 0.01, *p= 0.05. Bold: Correlations between isolates of the same toxigenic species,xFg = F. graminearum, Fc =F. culmorum, Fv =F. verticillioides, Af =A. flavus.
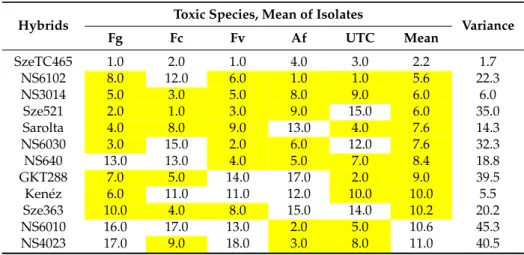
Spearman’s range correlations. Regarding the correlation values of the original toxic species data (Table1), we noted that the correlations between resistances to different fungal species were very different (Table5). In order to get a clearer picture about the individual positions of the given hybrids, we calculated the ranks of the 20 genotypes and their correlations. The mean ranks across fungal species varied between 2.2 and 18, indicating a cc. nine-fold difference in mean performance.
Two hybrids, specifically SzeTC465 and NS3014, produced lower than 10 ranks compared to all toxigenic species and the control as well as the general mean values across fungal species. On the other hand, three hybrids had above average susceptibility values compared to all toxigenic species. In these cases, the variance was also low (1.7–6). Each of the 15 remaining hybrids showed mixed performance with data, which were both lower and higher than the mean value. For example, NS6202 was superior with respect to Fg but not Fc. Sarolta had a good general performance except againstA. flavus. NS 640 showed susceptibility toF. graminearumandF. culmorum, but the resistance to other species was good.
In NS4030, we had high susceptibility toF. graminearum,F. culmorum, and F.verticillioides, but excellent performance againstA. flavusand natural infection (check). This means that we should prefer those hybrids that perform well with every toxigenic species and also under natural infection. It also means that all traits should be considered for making a good decision based on the values of the given hybrid.
The correlations show a similar picture compared to what we had for the original ear coverage data, but the main difference is that the low value of mean data fromA. flavusand natural infection (check, UTC) also gave a significant correlation with the mean performance.
Table 5.Resistance of maize to toxigenic fungi, ranks (1–20) and their variance for ear coverage across isolates, years and locations, 2012–2013.
Hybrids Toxic Species, Mean of Isolates
Variance
Fg Fc Fv Af UTC Mean
SzeTC465 1.0 2.0 1.0 4.0 3.0 2.2 1.7
NS6102 8.0 12.0 6.0 1.0 1.0 5.6 22.3
NS3014 5.0 3.0 5.0 8.0 9.0 6.0 6.0
Sze521 2.0 1.0 3.0 9.0 15.0 6.0 35.0
Sarolta 4.0 8.0 9.0 13.0 4.0 7.6 14.3
NS6030 3.0 15.0 2.0 6.0 12.0 7.6 32.3
NS640 13.0 13.0 4.0 5.0 7.0 8.4 18.8
GKT288 7.0 5.0 14.0 17.0 2.0 9.0 39.5
Kenéz 6.0 11.0 11.0 12.0 10.0 10.0 5.5
Sze363 10.0 4.0 8.0 15.0 14.0 10.2 20.2
NS6010 16.0 17.0 13.0 2.0 5.0 10.6 45.3
NS4023 17.0 9.0 18.0 3.0 8.0 11.0 40.5
Toxins2018,10, 372 10 of 25
Table 5.Cont.
Hybrids Toxic Species, Mean of Isolates
Variance
Fg Fc Fv Af UTC Mean
NS4015 12.0 7.0 10.0 11.0 17.0 11.4 13.3
NS5051 11.0 6.0 7.0 18.0 16.0 11.6 28.3
Sze349 15.0 16.0 17.0 10.0 11.0 13.8 9.7
Sze386 9.0 10.0 12.0 19.0 20.0 14.0 26.5
NS4030 19.0 20.0 19.0 7.0 6.0 14.2 49.7
GK Boglár 18.0 14.0 16.0 14.0 13.0 15.0 4.0
NS5043 20.0 19.0 15.0 16.0 19.0 17.8 4.7
SzeTC367 14.0 18.0 20.0 20.0 18.0 18.0 6.0
Mean 10.5 10.5 10.5 10.5 10.5 10.5 21.2
Correlations Fg Fc Fv Af Check Mean
Fc 0.7007
***
Fv 0.7759
***
0.6015
**
Af 0.0902 −0.0301 0.3338
Check 0.2391 0.1038 0.1759 0.6390
**
Mean 0.8013
***
0.6785
***
0.8245
***
0.5806
**
0.6162
**
***p= 0.001, **p= 0.01.xFg =F. graminearum, Fc =F. culmorum, Fv =F. verticillioides, Afl =A. flavus, highlighted:
ranks between 1 and 10. UTC: untreated control, natural infection.
The hybrids not bred for resistance against toxigenic fungi revealed 6–10 fold differences in resistance. This means that we have a wide variability to each pathogenic species to utilize it for the farmers. The resistance does not seem to be related to the most important pathogens, but we have three hybrids that show lower than average resistance to each pathogenic species, including natural infection. The Spearman range correlation was suitable to analyze the different or similar response of a given hybrid to different pathogens. The hypothesis that isolates will bring different or maximum similar results to different pathogens could be supported also in maize.
2.2. Toxin Data
In this chapter we had the same goals as for the 2.1 task.
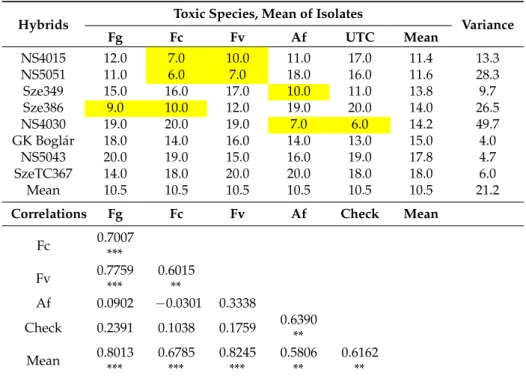
The toxin data across isolates, years and locations (Table6) show highly significant differences in the hybrids compared to all toxigenic species. Unfortunately, the twoA. flavusisolates did not provide any useful data for aflatoxin contamination in Szeged and Novi Sad (even they were controlled for aflatoxin production in vitro with positive result); therefore, this aspect could not be analyzed.
The maximum and minimum values differed 7–16 fold for the different toxins, where the DON of F. graminearumvalue was lowest. We made produced the toxin contamination from the non-inoculated control, but all data were 1–2 below the detection limit. Therefore, they are not shown. There are seven genotypes which showed a lower performance against all toxigenic species compared to the average (highlighted with yellow). This is the double number we found for ear coverage percentages.
We have only one genotype where all data are worse than the average. Altogether, this covers eight of the 20 hybrids having similarly good or poor resistance to the pathogens considered. This is similar to what we observed for the ear rot data, although individual hybrid reactions might differ in toxin production. For example, the highest toxin contamination was found forF. verticillioides, where the mean toxin contamination was twice as high as the DON forF. graminearum, but in ear rot, theF. graminearumdata were twice of the value of theF. verticillioidesdata. The close correlation between F. graminearum/F. culmorum for the ear symptoms was also supported here. However, correlations betweenF. verticillioidesandF. graminearumas well asF. verticillioidesandF. culmorumwere
not significant and in general, were negatively correlated with each other. Thus, we should call into question the close phenotypic correlation between the ear rot indices to have a selection value. In the visual symptoms,F. graminearumplayed the same role.
Table 6. Toxin contamination following artificial inoculation of ear rot pathogens in maize hybrids, across years, locations and isolates, 2012–2013. Unit: mg/kg. LSD data were from the independent toxin analyses and those of the general mean.
Hybrid Toxigenic spp.
Mean
Fg Fc Fc/Fg Fv
SzeTC465 2.45 2.31 2.38 4.41 3.06
NS3014 3.56 1.85 2.70 4.56 3.32
NS6102 3.97 3.15 3.56 2.88 3.34
NS4015 6.14 2.53 4.34 3.84 4.17
Sze386 6.19 2.21 4.20 5.50 4.63
Sarolta 3.07 3.18 3.12 8.71 4.98
NS6030 2.34 4.52 3.43 10.91 5.92
NS640 6.55 5.60 6.08 5.90 6.02
Sze349 8.86 4.55 6.70 7.07 6.83
GKT288 4.47 3.22 3.85 15.95 7.88
GK Boglár 10.89 5.02 7.96 7.85 7.92
Sze363 2.76 1.83 2.29 19.21 7.93
NS4023 12.00 4.80 8.40 7.23 8.01
Sze521 2.75 1.19 1.97 20.47 8.14
NS4030 14.52 9.47 12 3.23 9.07
NS6010 12.05 6.07 9.06 10.77 9.63
NS5043 15.20 13.28 14.24 3.18 10.55
Kenéz 1.19 0.72 0.95 30.60 10.83
SzeTC367 8.46 5.76 7.11 28.67 14.29
NS5051 3.49 3.06 3.28 43.83 16.79
Mean 6.55 4.22 5.38 12.24 7.67
LSD 5% 2.10 2.96 1.82 7.74 0.48
Correlations Fg Fc Fg/Fc Fv
Fc 0.8463 ***
Fc/Fg 0.9745 *** 0.9441 ***
Fv −0.3728 −0.3130 −0.3623
Mean 0.2547 0.2982 0.2830 0.7903 **
***p= 0.001, **p= 0.01.xFg =F. graminearum, Fc =F. culmorum, Fv =F. verticillioides, Afl =A. flavus, highlighted:
data lower than average.
According to the ANOVA calculated separately for each toxigenic species (Table7), the hybrid effect was significant for all threeFusariumspp., and the Szeged and Kupusina data again differed significantly. The ‘year’ effect was significant, except forF. culmorum, and the differences between isolates were also significant, except forF. verticillioides. The two-way interactions containing the hybrid effect were smaller than the genotype effect, but the difference between them was seldom shown to be significant. The visual symptoms showed a higher difference and higher stability. There is also proof that ear rot and toxin responses are not equivalent.
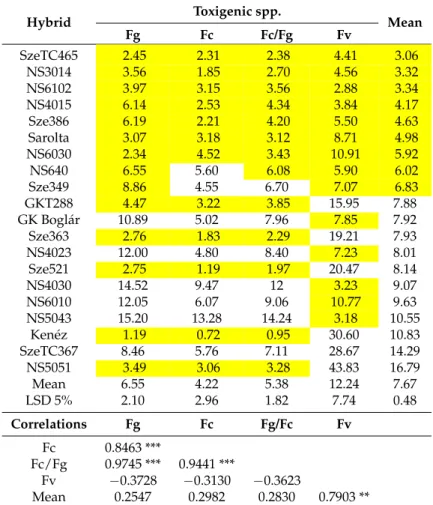
Here, the ranks were also calculated (Table8). Only five genotypes were found which showed a similar performance to different toxigenic species; three of them belonged to the most resistant group, having very good general resistance. Again, three were found with similar stability on the susceptible side. In the other 14 hybrids, different reactions were characteristic. Within the Szeged and Kupusina at Novi Sad genotypes, extremely good and bad performances were both found.
Among the hybrids highly susceptible toF. graminearumandF. culmorumwe found extremely low fumonisin concentration, such as in NS6010 and NS50143, or very low concentration in the response of NS4030 toF. verticillioides, but very high forF. graminearumandF. culmorum. However, we also
Toxins2018,10, 372 12 of 25
have good examples forF. graminearumand poor ones forF. verticillioidestoxin production (Sze521 and Kenéz). The correlations were surprising, in that the fumonisin data showed non-significant negative correlations with the DON data while the ear rot data were significantly and positively correlated.
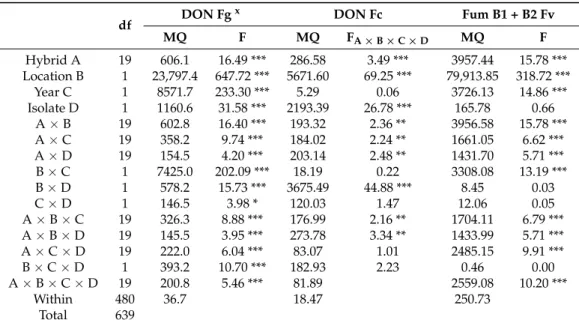
Table 7. Resistance of maize to toxigenic fungi; ANOVA for the toxin analyses individually, Szeged-Kupusina 2012–2013.
df DON Fgx DON Fc Fum B1 + B2 Fv
MQ F MQ FA×B×C×D MQ F
Hybrid A 19 606.1 16.49 *** 286.58 3.49 *** 3957.44 15.78 ***
Location B 1 23,797.4 647.72 *** 5671.60 69.25 *** 79,913.85 318.72 ***
Year C 1 8571.7 233.30 *** 5.29 0.06 3726.13 14.86 ***
Isolate D 1 1160.6 31.58 *** 2193.39 26.78 *** 165.78 0.66
A×B 19 602.8 16.40 *** 193.32 2.36 ** 3956.58 15.78 ***
A×C 19 358.2 9.74 *** 184.02 2.24 ** 1661.05 6.62 ***
A×D 19 154.5 4.20 *** 203.14 2.48 ** 1431.70 5.71 ***
B×C 1 7425.0 202.09 *** 18.19 0.22 3308.08 13.19 ***
B×D 1 578.2 15.73 *** 3675.49 44.88 *** 8.45 0.03
C×D 1 146.5 3.98 * 120.03 1.47 12.06 0.05
A×B×C 19 326.3 8.88 *** 176.99 2.16 ** 1704.11 6.79 ***
A×B×D 19 145.5 3.95 *** 273.78 3.34 ** 1433.99 5.71 ***
A×C×D 19 222.0 6.04 *** 83.07 1.01 2485.15 9.91 ***
B×C×D 1 393.2 10.70 *** 182.93 2.23 0.46 0.00
A×B×C×D 19 200.8 5.46 *** 81.89 2559.08 10.20 ***
Within 480 36.7 18.47 250.73
Total 639
***p= 0.001, **p= 0.01, *p= 0.05.xFg =F. graminearum, Fc =F. culmorum, Fv =F. verticillioides, Afl =A. flavus.
Table 8.Toxin contamination following artificial inoculation of ear rot pathogens in maize hybrids across years, locations and isolates, ranks, 2012–2013.Unit: ranges between 1–20.
Hybrid Toxigenic Spp. Ranks 1–20
Mean Variance
Fg Fc Fc/Fg Fv
Sze521 4 2 2 17 7.67 66.3
Kenéz 1 1 1 19 7.00 108.0
SzeTC465 3 6 4 5 4.67 2.3
NS6102 9 9 9 1 6.33 21.3
NS3014 8 4 5 6 6.00 4.0
NS6030 2 12 8 14 9.33 41.3
Sze363 5 3 3 16 8.00 49.0
NS4015 11 7 12 4 7.33 12.3
Sarolta 6 10 6 12 9.33 9.3
Sze386 12 5 11 7 8.00 13.0
NS640 13 16 13 8 12.33 16.3
GKT288 10 11 10 15 12.00 7.0
NS5051 7 8 7 20 11.67 52.3
Sze349 15 13 14 9 12.33 9.3
NS4023 17 14 17 10 13.67 12.3
NS4030 19 19 19 3 13.67 85.3
NS6010 18 18 18 13 16.33 8.3
GK Boglár 16 15 16 11 14.00 7.0
NS5043 20 20 20 2 14.00 108.0
SzeTC367 14 17 15 18 16.33 4.3
Mean 10.5 10.5 10.5 10.5 10.5 31.9
Fg Fc Fc/Fg Fv
Fc 0.8135 ***
Fc/Fg 0.9563 *** 0.9067 ***
Fv −0.4211 −0.2676 −0.4045
Mean 0.7724 *** 0.8575 *** 0.8091 *** 0.1726
***p= 0.001.xFg =F. graminearum, Fc =F. culmorum, Fv =F. verticillioides, Afl =A. flavus.Highlighted: data lower than average.Bold:Rather uniform performance against different toxigenic fungi.
Toxins2018,10, 372 13 of 25
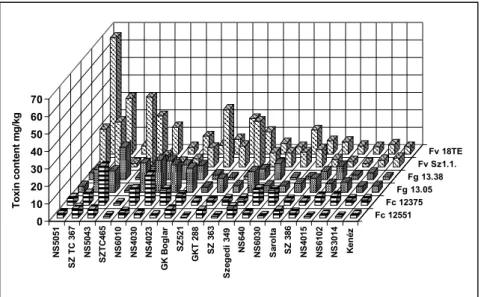
We also checked the differences between the responses of the isolates of the same toxigenic species (Figure3). The figure clearly shows that the two isolates of the same fungal species often show different toxin contamination in a given hybrid, similar to what we had observed in the ear rot data. The highest toxin contamination was recorded in fumonisin at relatively low ear rot values. The correlations between reactions to different isolates showed a variable picture (Table9).
ForF. verticillioidesandF. graminearumisolates we found moderate, but still significant correlations, but for the otherF. culmorum, a significant correlation was not found. These data will have consequences for the methodology of testing resistance. The correlations between the inocula of the same species are also divergent, supporting the view we formed based on the visual ear coverage data.
Fg Fc Fc/Fg Fv
Fc 0.8135 ***
Fc/Fg 0.9563 *** 0.9067 ***
Fv −0.4211 −0.2676 −0.4045 Mean 0.7724 *** 0.8575 *** 0.8091 *** 0.1726
*** p = 0.001. x Fg = F. graminearum, Fc = F. culmorum, Fv = F. verticillioides, Afl = A. flavus. Highlighted:
data lower than average. Bold: Rather uniform performance against different toxigenic fungi.
We also checked the differences between the responses of the isolates of the same toxigenic species (Figure 3). The figure clearly shows that the two isolates of the same fungal species often show different toxin contamination in a given hybrid, similar to what we had observed in the ear rot data.
The highest toxin contamination was recorded in fumonisin at relatively low ear rot values. The correlations between reactions to different isolates showed a variable picture (Table 9). For F.
verticillioides and F. graminearum isolates we found moderate, but still significant correlations, but for the other F. culmorum, a significant correlation was not found. These data will have consequences for the methodology of testing resistance. The correlations between the inocula of the same species are also divergent, supporting the view we formed based on the visual ear coverage data.
Figure 3. Toxin production of the tested toxigenic fungi and their isolates with respect to the toxin contamination of the hybrids with differing resistance to the toxigenic species across years and locations, 2012–2013. Toxins measured: x Fg = F. graminearum: DON, Fc = F. culmorum: DON, Fv = F.
verticillioides: fumonisin B1 + B2.
Table 9. Ear rot resistance of maize to 2-2 isolates of four toxigenic species and correlations between toxin responses of the isolates of toxigenic species from Figure 3, 2012–2013.
Correlations Fv 18TE a Fv Sz1.1. Fg 13.38 Fg 13.05 Fc 12375 Fc 12551 Fv Sz1.1. 0.4862 *
Fg 13.38 −0.2600 −0.4505 *
Fg 13.05 −0.1440 −0.3806x 0.6065 **
Fc 12375 −0.1986 −0.4384x 0.8549 *** 0.5869 **
Fc 12551 0.1020 −0.1461 0.3250 0.5484 * 0.2385
Mean 0.7855 *** 0.5205 * 0.1982 0.2963 0.2385 0.3553
*** p = 0.001, ** p = 0.01, * p = 0.05, x p= 0.1 a Fv = F. verticillioides, Fg = F. graminearum, Fc = F. culmorum.
Bold numbers: They are the correlations between the two isolates belonging to the same fungal species.
The data prove that the toxin responses differ from the symptom severity (ear coverage %), in spite of the similarity.
0 10 20 30 40 50 60 70
Toxin content mg/kg Kenéz
NS3014
NS6102
NS4015
SZ 386
Sarolta
NS6030
NS640
Szegedi 349
SZ 363
GKT 288
SZ521
GK Boglar
NS4023
NS4030
NS6010
SZTC465
NS5043
SZ TC 367
NS5051
Fv 18TE Fv Sz1.1.
Fg 13.38 Fg 13.05 Fc 12375 Fc 12551
Figure 3.Toxin production of the tested toxigenic fungi and their isolates with respect to the toxin contamination of the hybrids with differing resistance to the toxigenic species across years and locations, 2012–2013. Toxins measured:xFg =F. graminearum:DON, Fc =F. culmorum:DON, Fv =F. verticillioides:
fumonisin B1 + B2.
Table 9.Ear rot resistance of maize to 2-2 isolates of four toxigenic species and correlations between toxin responses of the isolates of toxigenic species from Figure3, 2012–2013.
Correlations Fv 18TEa Fv Sz1.1. Fg 13.38 Fg 13.05 Fc 12375 Fc 12551 Fv Sz1.1. 0.4862 *
Fg 13.38 −0.2600 −0.4505 *
Fg 13.05 −0.1440 −0.3806x 0.6065 **
Fc 12375 −0.1986 −0.4384x 0.8549 *** 0.5869 **
Fc 12551 0.1020 −0.1461 0.3250 0.5484 * 0.2385
Mean 0.7855 *** 0.5205 * 0.1982 0.2963 0.2385 0.3553
***p= 0.001, **p= 0.01, *p= 0.05, xp= 0.1aFv =F. verticillioides, Fg =F. graminearum, Fc =F. culmorum.Boldnumbers:
They are the correlations between the two isolates belonging to the same fungal species.
The data prove that the toxin responses differ from the symptom severity (ear coverage %), in spite of the similarity.
2.3. Relationships between Ear Rot and Toxin Contamination
It is important to note how much resistance can contribute to the reduction in toxin levels. For this reason, the general means were compared between ear rot and toxin contamination from the artificially inoculated treatments. AsF. graminearumandF. culmorumare closely related and their toxin spectrum is also very similar (DON, zearalenon), we treated them together. F. graminearumwas in this test more aggressive and reached higher DON contamination thanF. culmorum. Therefore, we were also