László Jeney – Dávid Karácsonyi (eds.)
Department of Economic Geography and Futures Studies, Corvinus Univ. of Budapest Geographical Institute, RCAES Hungarian Academy of Sciences
Minsk and Budapest, the two capital cities
Selected studies of
post-socialist urban geography
and ecological problems of urban areas
Department of Economic Geography and Future Studies of Corvinus University of Budapest,
International Visegrad Fundby and by
the bilateral agreement on researcher’s mobility between Hungarian Academy of Sciences
National Academy of Sciences of Belarusand
(project title: Scientific Preparation of Book-Atlas “Belarus in Maps”).
László Jeney – Dávid Karácsonyi (eds.)
Minsk and Budapest, the two capital cities
Selected studies of post-socialist urban geography and ecological problems of urban areas
Geographical Institute, RCAES
Hungarian Academy of Sciences Institute for Nature Management, National Academy of Sciences of
Belarus
Department of Economic Geography and Futures Studies, Corvinus University of Budapest
Faculty of Geography, Belarusian State University
Budapest – Minsk, 2015
Dávid Karácsonyi
Scientific review: István Tózsa English proofreading: Mária Sándori Cover design: Dávid Karácsonyi
László Jeney
Typography: László Jeney
Budapest–Minsk 2015
ISBN 978-963-503-591-5
Printed in Hungary by Duna-Mix
Publishers: István Tózsa and Péter Ábrahám
© Department of Economic Geography and Futures Studies, Corvinus University of Budapest, 2015
© Geographical Institute, Research Centre for Astronomy and Earth Sciences, Hungarian Academy of Sciences, 2015
Authors:
AntipovA, EkAtErinA: Faculty of Geography, BSU professor
Erőss, ÁgnEs: Geographical Institute, RCAES HAS junior research fellow FAkEyEvA, LiudmiLA: Faculty of Geography, BSU
associate professor
JEnEy, LÁszLó: Department of Economic Geography and Futures Studies, CUB senior lecturer
KaKarEKa, sErgEy: Institute for Nature Management, NASB associate professor
KarÁcsonyi, DÁviD: Geographical Institute, RCAES HAS research fellow
Khomich, vaLEry: Institute for Nature Management, NASB associate professor
korotAyEv, vLAdimir: Faculty of Geography, BSU PhD student
KovÁcs, zoLtÁn: Geographical Institute, RCAES HAS, scientific advisor, Dept. of Economic and Social Geography, Univ. of Szeged, professor KrauchuK, LuDmiLa: Institute for Nature Management, NASB
leading researcher
KuKharchyK, tamara: Institute for Nature Management, NASB associate professor, chief researcher Loginov, vLaDimir: Institute for Nature Management, NASB
academician, chief researcher oziEm, hEnryK: Faculty of Geography, BSU
associate professor PirozhniK, ivan: Faculty of Geography, BSU
professor
ProbÁLD, FErEnc: Center of Geography, Eötvös Loránd University of Budapest professor emeritus
struK, miKhaiL: Institute for Nature Management, NASB associate professor, leading researcher szabó, baLÁzs: Geographical Institute, RCAES HAS
junior research fellow BSU: Belarusian State University CUB: Corvinus University of Budapest
NASB: National Academy of Sciences of Belarus
RCAES HAS: Research Centre for Astronomy and Earth Sciences, Hungarian Academy of Sciences
Table of contents
I. Instead of an introduction: Minsk and Budapest – a basic
compare ... 11
Part A: Socio-economic development ... 17
II. Budapest a Central European metropolis: historical trajectories and post-socialist transformation ... 19
II.1. Introduction ... 19
II.2. The main phases of urban development before 1990 ... 20
II.2.1. Budapest between the unification and World War I ... 20
II.2.2. The interwar period ... 21
II.2.3. Urban development during state socialism ... 22
II.3. Main factors influencing the post-socialist urban development in Budapest ... 25
II.3.1. Administration and planning ... 25
II.3.2. Economic restructuring ... 26
II.3.3. Transformation of the housing market ... 27
II.4. The socio–spatial structure of Budapest ... 28
II.4.1. The City ... 30
II.4.2. Inner-urban residential quarter ... 31
II.4.3. Zone of transition ... 31
II.4.4. Housing estates ... 32
II.4.5. Zone of garden cities ... 33
II.4.6. Villa-quarter of Buda ... 34
II.4.7. Suburban zone ... 34
II.5. Main features of urban transformation after 1990 ... 35
II.5.1. City centre – explosion of business functions ... 37
II.5.2. Inner-urban residential quarters – up- and down-grading ... 38
II.5.3. Zone of transition – slow conversion ... 40
II.5.4. Housing estates – time bomb of communism ... 41
II.5.5. Zone of garden cities – new dynamism ... 41
II.5.6. Villa quarter of Buda – ageing wealth ... 42
II.5.7. Zone of agglomeration – limitless urban sprawl ... 43
II.6. Conclusions ... 45
II.7. References ... 46
III. Major issues of spatial structure planning of Minsk ... 49
III.1. Introduction ... 49
III.2. Minsk – a basis of economic power of the country ... 50
III.3. Minsk – the heritage of socialist era industrialization ... 53
III.4. Social diversity of Minsk ... 57
III.5. History and Perspectives of the Minsk Spatial Structure ... 60
III.6. The beginning of a new transformation of Minsk ... 68
III.7. Conclusion ... 68
III.8. References ... 69
IV. Spatial and temporal differentiation of demographic development of Minsk... 71
IV.1. Introduction ... 71
IV.2. Dynamics and factors of demographic development of Minsk ... 73
IV.3. The natural increase in the population dynamics and spatial structure formation in Minsk ... 76
IV.4. Migration factor in the population dynamics and spatial structure of Minsk ... 85
IV.5. Conclusion ... 92
IV.6. References ... 93
V. Main features of large housing estates and the results of their rehabilitation in Budapest ... 95
V.1. Introduction ... 95
V.2. Main specificities of large housing estates: comparison of Western and Central European examples ... 96
V.3. Brief history of large housing estates in Budapest ... 99
V.4. Survey method and classification ... 101
V.5. Dimensions of renovation at housing estates ... 102
V.6. Conclusions ... 109
V.7. References ... 110
Part B: Urban climate, environment and ecology ...115
VI. The urban climate of Budapest: trends and perspectives . 117 VI.1. Milestones of climate research in Budapest ... 117
Table of Contents
VII. The estimation of the impact of urbanization on climate and
extreme weather phenomena ... 133
VII.1. Task description ... 133
VII.2. Analysis of the results ... 136
VII.3. The role of urbanization in the increase of South Belarusian thermal resources ... 139
VII.4. Estimation of the contribution of urbanization to regional climate change ... 143
VII.5. Evaluation of the urban impact on air humidity, fog, heavy rains and hails ... 147
VII.5.1. Showers ... 152
VII.5.2. Hails ... 153
VII.3. Conclusions ... 154
VII.3. References ... 155
VIII. Integrated assessment of the state of urban environment (example of Minsk) ... 159
VIII.1. Introduction ... 159
VIII.2. Methods and materials ... 161
VIII.3. Results and discussion ... 163
VIII.3.1. Atmospheric air ... 163
VIII.3.2. Groundwater ... 165
VIII.3.3. Soil ... 166
VIII.3.4. Vegetation ... 169
VIII.3.5. Integrated assessment ... 170
VIII.4. Conclusion ... 173
VIII.5. References ... 173
IX. Ecological frame of environmental planning in urban agglomerations (case of Minsk) ... 177
IX.1. Introduction ... 177
IX.2. The current regulation of the environmental planning system of the urban area itself ...179
IX.3. The current regulation of the environmental planning systems of suburban areas ... 181
IX.4. The substantiation of the model of optimal planning organization of natural systems in suburban areas ... 183
IX.5. Rationale of the boundaries of the natural frame of suburban areas ... 185
IX.6. Allocation of the boundaries of the natural frame of Minsk agglomeration ...187
IX.7. Conclusions ... 191
IX.8. References ... 192
I. Instead of an introduction:
Minsk and Budapest – a basic compare
László Jeney – Dávid Karácsonyi
A quarter-century ago the transformation not only rearranged the map of Europe, but also actuates significant changes in the social and the economic processes. While Belarus was carrying the special model of post-Soviet course for development into execution after they have had marked out from Soviet Union, Hungary got a member of the European Union with the Visegrád Four Countries and the other post- socialist countries in the Middle Europe.
The changes have been worked on the urbanization process, also on the region of the two capital town and on the agglomeration of Minsk and Budapest. However the historical improvement of the two capitals were pretty different and the processes of the last 20 years were variant too, the direction of the changes were similar in the early 1990s. In Budapest and Minsk got the market the most important regulator instead of the state. The real estate market started to improve and the price of the plot turned up, however it was different in the two capitals. The cycle of the urbanization – agglomeration, suburbanization (or exurbanization), dezurbanization (or counterurbanization) and reurbanization – came out almost in the same time, as an obstruction. There are no differences in the two capital’s data – the population of both capital cities are about 2 million people – and neither in their roles in the urban network, so they can give a great ground to compare the similarity and the diversity of the post-Soviet and the post-socialist urbanization.
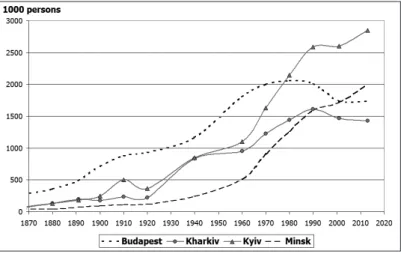
Looking at its metropolitan scale and history, Budapest surpasses Minsk in this respect. Its population has already surpassed 300 thousand in 1870 as long as Minsk has only reached this in 1941. The boost of the Hungarian capital started in the end of the 19th century, along with the industrialization of the Austro–Hungarian Monarchy and turned down approximately by the 1950s. It was exactly in the 1950s that the boost of Minsk started, as a result of the Soviet industrialisation and the industry has an important role in the city since the transition.
Budapest had half-million inhabitants in 1890 and doubled in 20
years. This was in Minsk a shorter process, but 60 years later between 1959 and 1972. Since the World War II the population of Minsk has grown constantly, it was 2 million people in 2013, in opposite of it the population of Budapest was the highest in 1980 and since then it showed a fall as a result of the suburbanization. Since the end of 2000s the population has represented a low rising, because of the reurbanization and the effect of the financial crisis in the rural region and the east side of the country, which one was much more smitten than the others. The Hungarian capital city has now odd 1.7 million inhabitant (Figure 1).
Figure 1: Population growth of Budapest, Kharkiv, Kyiv and Minsk (1870–2013) Source of data: homepage of Populstat1
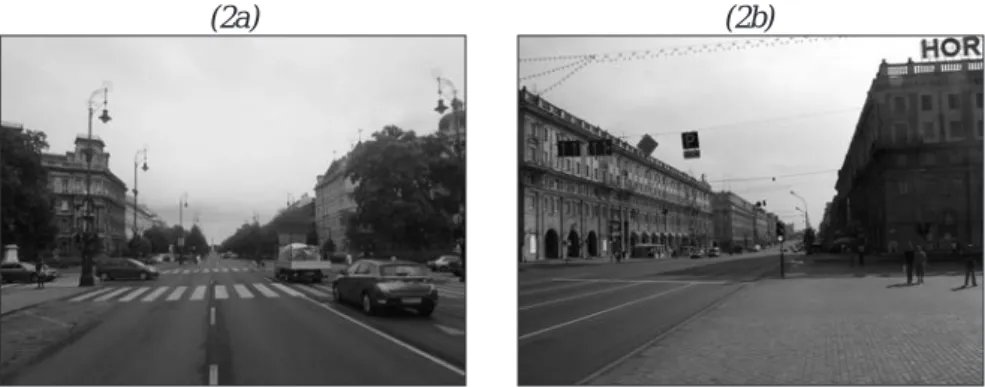
As a result of the different development in time also the facade of the two cities are basically varied from each other. While the inner city of Budapest is characterized by the classicism of the late 19th century, the image of Minsk ruined almost totally during the World War II practically begun to shape after the restoration. The city centre is dominated by the
‘Stalin’s baroque styled’ buildings even today, although the renovation of the medieval city core is steaming ahead nowadays. The different facade of the two inner cities is demonstrated by the two representative
I. Instead of an introduction: Minsk and Budapest – a basic compare
(2a) (2b)
Figure 2: Representative sites: Andrássy út (Andrássy Avenue) in Budapest from the late 19th century (2a) and Praspekt Nezalezhnastsi (Independence Avenue) – built during the 1950s, called after the anniversary of liberation of Minsk from German
occupation (July 1944) (2b)
Source: photos of Balázs Szabó (2a) and Dávid Karácsonyi (2b)
While the huge factories of Minsk is operating to this day, like the Minsk Tractor Works (MTZ ‘Belarus’), the Minsk Automobile Plant (MAZ), to mention just the most gigantic ones, in Budapest the post- industrial revitalization (MOM Park, Millenáris, Graphisoft, Marina etc.) of the brown fields (e.g. Csepel Works) is in a far-gone state (Figure 3).
(3a) (3b)
Figure 3: Millenáris Park (former Ganz Works) in Budapest (3a) and the Minsk Tractor Works (MTZ) (3b)
Source: photos of Balázs Szabó (3a) and Dávid Karácsonyi (3b)
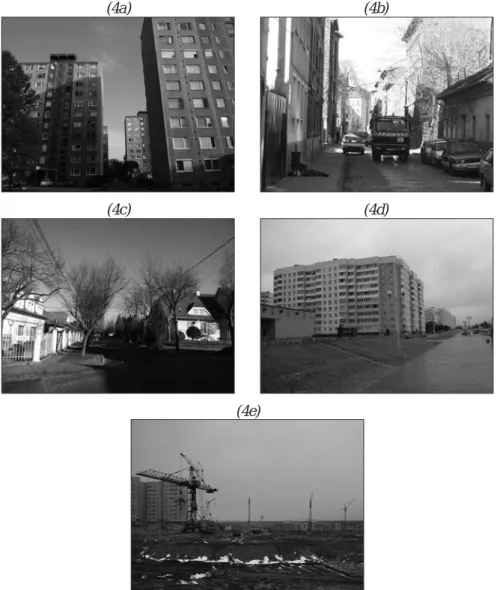
The atmosphere of the suburbs is basically different. While the greenbelt of Budapest is dominated by the buildings with gardens, which is rarely broken by a housing estate, in Minsk the suburb dominated by the housing estates incorporate the former villages as a bubble (Figure 4). In the first chapter of this book, titled with ‘Socio–economic development’, the study of Zoltán Kovács and Ivan Pirozhnik and his co-author focus onto these development features, the former one is according to Budapest, and the latter one to Minsk. The study of Pirozhnik analyses the city development through planning documents.
The study of Ekaterina Antipova and Liudmilla Fakeyeva aims to examine the demographic situation of Minsk. The study of Ágnes Erőss and Balázs Szabó perambulates the issue of the rehabilitation of the housing estates. This was perhaps one of the acutest issues of the development of the Hungarian capital in the last one and a half century, and by this will be a central theme also in Minsk probably, where huge housing estates are being built with industrial technology even to this day.
Despite the differences there are universal problems being valid generally for the cities, which got the focal point of the science with the world-wide urban explosion, the spread of the urbanized areas, the appearance of the problem of the global warming. The summer hot waves, the extent and the quality of the built-up areas of the state of the environment affects the life conditions like the urban development regulation or the land values. The second chapter of this publication deals with these issues, such as the urban climate or the urban heat islands.
Ferenc Probáld has already take up these issues the apropos of Budapest since 1960s. His publication offers a great summary of these questions.
Longinov academician circuits a similar problem; he examines the effects of the urbanization on the extreme weather conditions.
The first part in this tome there are two–two studies about Minsk and Budapest, but shares of the four studies of the second part on the environmental issues dominate by Minsk. Five among
I. Instead of an introduction: Minsk and Budapest – a basic compare
(4a) (4b)
(4c) (4d)
(4e)
Figure 4: Suburbs of Budapest and Minsk: Housing estate in Budapest (4a), slum district in Budapest (4b), greenbelt in Budapest (4c), Housing estate near Kamennaya Horka metro station in Minsk (4d) and Building of new block-of-flats
near Kamennaya Horka metro station in Minsk (4e)
Source: photos of Balázs Szabó (4a–4b), László Jeney (4c) and Dávid Karácsonyi (4d–4e)
Part A
Socio-economic development
II. Budapest a Central European metropolis: historical trajectories and
post-socialist transformation
Zoltán Kovács
2Abstract
This paper focuses on the main driving forces of urban development in Budapest, with special attention to the socio–spatial differentiation of the city and its metropolitan region in a historical perspective. The political and economic changes of the early 1990s generated large scale transformation process in the spatial pattern of the city. Due to the reestablishment of market mechanisms, the privatisation of housing, the liberalisation of the property market, and the growing presence of global capital the socio–economic structure of the city started to change abruptly. The different zones of the urban region were affected differently by the transformation, generating both up- and down-grading processes in the city. There are two major areas where upward processes are most evident in metropolitan Budapest: the central business district and the suburbs. Neighbourhoods lying between these two dynamic zones reveal some more controversial development.
Only a limited number of neighbourhoods provide clear examples for upward trajectory, and in most cases no signs of new investments can be observed. In some of these neighbourhoods physical deterioration is also accompanied by extreme forms of social segregation and social exclusion.
Keywords: Budapest, urban development, urban restructuring, post-socialist cities
II.1. Introduction
Budapest is the symbolic heart of Hungary in terms of its political, economic, administrative and cultural functions. More than one third of the national GDP is produced in Budapest, and nearly half of the foreign direct investments arriving into the country after 1989 was realised here. Most of the global companies have their headquarters there; all the main national institutions have their seat in
2 The author is grateful for the Hungarian Scientific Research Fund (OTKA) Grant Agreement no. K 105534..
the capital city. It is also home to a fifth of the Hungarian population.
Politically, socially and economically Budapest has gone through significant changes in the past quarter of a century (Földi, Zs.
2006). The objective of this chapter is to introduce the main phases of urban development in Budapest, to demonstrate the socio–spatial differentiation in the metropolitan area of the city and to define the main trends of urban transformation. It is also aimed at showing how local underlying structures, the new contextual elements (e.g.
free market, urban policies) and legacies of the past work together in setting a diverse path of development in the different urban zones within the city.
II.2. The main phases of urban development before 1990
Budapest as one of the youngest capital cities in Europe was officially established only in 1872, however, the roots of present- day city go back to the early middle ages. From the middle of the nineteenth century the Hungarian railway network was extensively developed which generated rapid industrial development. All the main railway lines radiated out from Buda and Pest in all directions across the Carpathian Basin. Due to the rapid development of railway network the twin cities became the centres of Hungarian industrial revolution where the products of an enormous agricultural hinterland were stored and processed. Industrial development was coupled by an inflow of labour. As the population grew the city is continuously expanded and new residential suburbs were built. At the time of the 1869 census with a total population of 280 thousand the three cities ranked already seventeenth among the large cities of Europe.
II.2.1. Budapest between the unification and World War I The compromise between Austria and Hungary in 1867 created
II. Budapest a Central European metropolis: historical trajectories and port-socialist transformation
Habsburg Empire. This made Budapest the twin capital of the dual monarchy and opened the second great phase of development of the city. The last third of the nineteenth century was the period of rapid urban growth and territorial expansion. Migrants were attracted primarily by the vigorous industrial and economic development. The rate of population growth was especially dynamic during the last decade of the century (45 percent in one decade). As a consequence, by the turn of the century the population of Budapest increased to 750 thousand, and the city advanced to the eighth place in Europe.
To keep control over the vibrant development a powerful body, called Fővárosi Közmunkák Tanácsa (Council of Public Works) was set up in 1870. The Council elaborated an imposing master plan which laid down the main features of spatial development, setting the direction of expansion and dividing the city into land-use zones (Lukács, J. 1989). Its regulations set the purposes of buildings, the size of plots, the height of the houses, as well as the material of the walls. Architecturally, the outcome was fascinating, a neatly built town consisting of four- and five-storey buildings in eclectic style, displaying fully harmony. The modern infrastructural development of the city was also impressive. Bridges were built over the Danube making physical communication between Buda and Pest easier, in 1887 trams appeared, in 1888 the first suburban railway line was opened and in 1896 the first underground railway of the continent was opened in the city.
II.2.2. The interwar period
World War I and the consequent dissolution of the Austro–
Hungarian Monarchy altered the spatial relationships of Budapest.
In the Trianon Treaty of Versailles Hungary lost 71 percent of its territory and 66 percent of its population. Budapest with more than 1 million inhabitants became the lonely star of the Hungarian urban system. Typically, the population of the second largest country town (Szeged) was only just over 100 thousand. Right after the war 62 percent of the country’s industrial output, and 45 percent of industrial employees concentrated here. Budapest became the over- sized capital of a small country, and it could not regain its earlier
international functions.
During the inter-war period the development of Budapest slowed down. Its population continued to grow, mainly due to the migration of ethnic Hungarians from the separated territories, but at a much slower pace. Typical of the inter-war period was the spontaneous unplanned nature of urban development much of it speculative. Traditional single family homes were built along the expanding urban fringe of Pest and as public utilities and urban infrastructure were not provided these neighbourhoods acquired a rural rather than an urban aspect (Compton, P. 1979). This was also the epoch of extensive suburban growth. As a consequence, the population of the suburbs increased from 130 thousand to 540 thousand between 1900 and 1949. By the 1930s Budapest was beginning to overcome the consequences of World War I, when the next world war overwhelmed it, causing enormous losses. As a consequence of World War II the population of Budapest dropped by more than half a million and the pre-war figure of 2 million was reached again only in 1972.
II.2.3. Urban development during state socialism
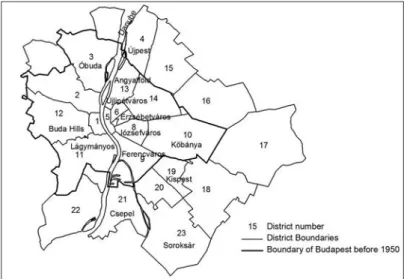
At the end of the 1940s a new communist constitution was implemented in Hungary, land and property was nationalised and nearly all commercial functions were prohibited or severely controlled (Enyedi, Gy. – Szirmai, V. 1992). According to Act I of 1950 local governments were replaced by hand-picked councils where representatives of the communist party were in absolute majority. This act also solved the question of ‘Greater Budapest’ that is the administrative union of the suburban settlements with the core city. Originally Budapest was divided into ten districts in 1873, later in the 1930 administrative reform the number of districts increased to fourteen. In the 1930s as contacts between Budapest and its hinterland intensified plans were made for the merger of suburban
II. Budapest a Central European metropolis: historical trajectories and port-socialist transformation
Figure 5: Territorial expansion and administrative division of Budapest Source: edition of Zoltán Kovács – Balázs Szabó
The post-war economic upswing and the forced development of industry which was the top priority of communist economic policy in the 1950s attracted many immigrants from the countryside and resulted in very intensive population growth again. In this period the average population growth was even higher than at the peak of the capitalist industrial development. Enyedi, Gy. (1990) identified this rapid socialist urban development as the first stage of global urbanization, which was in fact the completion of the capitalist urban boom, interrupted by the world wars and the interwar stagnation. As a result of the growing concentration of industrial workplaces and labour force the dominance of Budapest further increased in the Hungarian space structure. To prevent the mass inflow of people the communist regime introduced administrative measures in 1958. Only those were allowed to settle down in Budapest who had worked and lived at least 5 years in the city previously.
In accordance with national demographic trends and the new regional development policy gradually slowed down the growth of Budapest from the mid 1960s. The city entered the post-industrial phase of urban development, factory employment started to
decline, at the same time the rapid growth of services took place.
The number of industrial employees peaked with 612 thousand in 1964; twenty years later the industry of the city employed only 340 workers. The shrinkage of industry was also fostered by administrative measures. Between 1968 and 1981 approximately 250 industrial plants were closed down or removed from Budapest mainly for ecological reasons, while new establishment was strictly restricted.
The spatial expansion of the city accelerated from the 1960s due to large-scale housing development programmes.
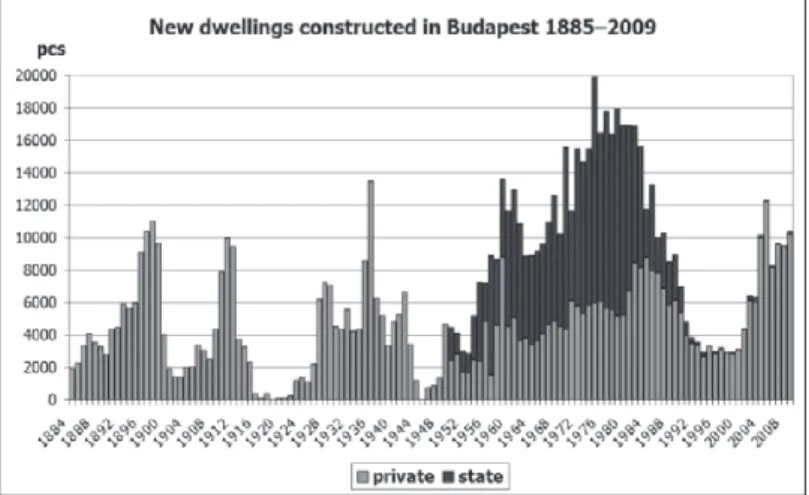
The basic premise of communist housing policy was that every family was entitled to its own home at reasonable cost and each family member to a separate room. A new national housing policy was started in 1960, called the ‘Fifteen-Year National Housing Development Plan’ which was intended to satisfy housing need in full, and set the target of 1 million new dwellings in the country, and 200 thousand in Budapest alone, in the subsequent fifteen years. The late 1960s and 1970s were the ‘golden age’ of housing construction, when 15–20 thousand dwellings were completed annually in Budapest. Great part of the new dwellings was built by the state mostly in the form of large housing estates (Figure 6). As in the other state-socialist countries, the state housing industry in Hungary relied on pre-fabricated technology and the establishment of gigantic housing factories. These factories were able to build extremely high density and high-rise estates of 12–15 thousand dwellings housing 40–50 thousand people. Due to site constraints, these estates were constructed on undeveloped ‘greenfield’ sites in peripheral locations. Most estates were poorly served by transport and other facilities and the organic link with the city was broken (Kovács, Z. – Douglas, M. 2004).
II. Budapest a Central European metropolis: historical trajectories and port-socialist transformation
Figure 6: Main phases of housing construction in Budapest Source: edition of Zoltán Kovács – Balázs Szabó
While there was an upswing of urban periphery from the 1960s onwards, the building stock of the historical quarters started to decline due to the lack of maintenance. The decline of historical neighbourhoods was basically the result of rent policy: heavily subsidised rents did not even cover the costs of basic repairs.
Investment and disinvestment in the urban arena generated new flows of migration which led to social erosion of the historical quarters. From the early 1970s the exodus of young middle-class families who migrated from the inner-city neighbourhoods mainly to the new housing estates became evident. The vacant dwellings released by better off families were allocated to lower status, poorer families, often Gipsy.
II.3. Main factors influencing the post-
socialist urban development in Budapest
II.3.1. Administration and planning
Administration and planning in Budapest is complex.
Collaborative working is difficult for many post-socialist countries and Hungary is no exception. Act 65/1990 was passed on August
3 1990 and the system of councils was replaced by democratically elected local governments. According to the Act, Budapest has a two-tier public administration. The city is divided into 23 districts (before 1992 22) which have their own resources and are governed by an independent elected body. Powers and responsibilities are divided between the Municipality of Budapest and the 23 districts.
The Municipality of Budapest is responsible for public services, such as transport, and it provides cultural, educational, health and social services that cover more than one district. It makes it difficult for planning in Budapest to be co-ordinated. A Regulation Framework on Urban Planning for the whole capital was prepared in the early 1990s by the Municipality, and the district development plans were supposed to be consistent with this framework.
However, the arrangement did not prove to be very successful from the outset, as the two governments could easily block each other’s development plans, e.g. the Municipality of Budapest through its zoning authority and the district governments through their right to issue building permits. The 1994 modification of the Act on Local Governments gave the Municipality more power in strategic planning issues that were relevant for the whole of the capital city (Tosics, I. 2006), but conflicts were still common. Overall city planning and management is fragmented and the districts tend to focus on their own autonomous interests.
II.3.2. Economic restructuring
Soon after the change of political system the old structure of the Hungarian economy collapsed and it underwent profound changes.
Large state companies were privatised and/or disintegrated. The decline of industry was marked in Budapest lowering the share of industrial workers from 36 to almost 20 percent of the active population between 1990 and 2001.
The impact of the economic breakdown was tremendous
II. Budapest a Central European metropolis: historical trajectories and port-socialist transformation
1990s. After 1990 Budapest and its metropolitan region became the magnet of capital investments. Due to the aforementioned conditions causing its high competitiveness, Budapest became a major target of FDI basically for its size, favourable geopolitical position and good accessibility from Western Europe.
The special position of Budapest could also be attributed to the high concentration of human and financial capital, the highly developed infrastructure and means of production. Typical for the weight of Budapest in the Hungarian economy that in 1996 35 percent of the national GDP was produced here, and the per capita GDP was 181 percent of the national average. Since then the weight of the city in the national economy has not decreased at all. In 2008 the city produced 38 percent of the Hungarian GDP, and the per capita GDP was 221 percent of the national average.
In certain creative sectors of the economy (e.g. cultural industries, R&D, business services, ICT) the role of Budapest is extremely dominant (Kovács, Z. et al. 2007).
II.3.3. Transformation of the housing market
In the transformation of housing market privatisation of public dwellings played a very important role. Before 1990 public housing made up 51 percent of the total dwelling stock in Budapest. In most of the centrally located districts housing was owned predominantly (95–97 percent) by the state. Privatisation of state housing in Budapest meant a pure ‘give away’ type of privatisation to sitting tenants, at a very low price. Most public dwellings were sold for between fifteen and forty percent of the estimated market value depending on the physical conditions of the dwelling. Further forty percent discount was offered to those who paid in cash, which meant that the great majority of the public dwellings was sold for nine percent of the market value. Due to these circumstances the privatisation of public housing was very rapid in Budapest and in the first half of the 1990s a large segment of the public housing sector became privatised.
The logic of privatisation favoured the better-off families, since tenants (now ‘buyers’) of best quality dwellings with desirable
location gained the biggest amount of value gap. These changes in the housing market had far reaching ecological implications. First of all, households had more opportunity to actualise relocation desires as they became owners, secondly, new conditions allowed a greater plurality of values and promotion of self-interest. Factors in housing preferences of households like security or accessibility of green spaces gained great importance. The outcome was a rapid differentiation of the housing market.
While public housing became residualised and served as a shelter for urban poor, new residential areas for the better off were developed. Geographically, public housing became increasingly concentrated in traditionally low-status areas (Józsefváros, Erzsébetváros). In a survey conducted in summer 1995 we found that households who remained in the public housing sector were on average less educated, with lower incomes and they had much higher probability to become unemployed than other housing classes (Kovács, Z. 1998). All these changes on the housing market had their imprints on the socio–spatial pattern of Budapest.
II.4. The socio–spatial structure of Budapest
The ecological structure of Budapest shows astonishing coincidence with the physical features of the city. In order to demonstrate the existing dimensions of social and residential segregation, the ratio of highly educated residents (i.e. people with university education) was selected in the 2001 census. The indicator reflects a very strong east–west polarisation in the social structure of the city (Figure 7).
II. Budapest a Central European metropolis: historical trajectories and port-socialist transformation
Figure 7: Social structure of Budapest (percentage of people with university education, 2001)
Source: edition of Zoltán Kovács – Balázs Szabó
The traditional high-status areas of the city can be found on the hilly Buda side, whereas the plain Pest, east of the Danube is the traditional stronghold of working class. Moving from the Danube towards the urban periphery, the social status of the residents gradually declines. Regarding the functional and morphological characteristics the metropolitan region of Budapest can be divided into seven major zones following the traditions of the classical human ecology (Szelényi, I. 1987). Each zone can be characterised by distinct socio–economic, functional and architectural features, thus, the boundary between the individual zones is fairly clear.
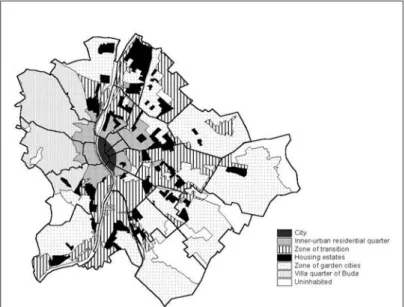
This concentric structure is the outcome of the organic growth of the city in the last 130 years, when the expansion of Budapest has occurred concentrically from the centre of the town outwards (Figure 8).
Figure 8: Spatial structure of Budapest Source: edition of Zoltán Kovács – Balázs Szabó
II.4.1. The City
The City is the oldest part of Budapest where the building stock was built in the 1880s and 1890s. This is a densely built up area stretching on the flat Pest side of the town, inside the arc of the Nagykörút (Grand Boulevard). (Some classification includes also the Várnegyed (Castle District) on the other side of the Danube in this zone.) This is a commercial district and the traditional shopping centre of Budapest, including also the governmental quarter (Lipótváros). The street layout here is regular, with representative public buildings from the late 19th century including the Hungarian Parliament, the National Museum and the Hungarian Academy of Sciences (Dingsdale, A. 1999). Another important characteristic, that despite the constant decrease of population the residential function of the City remained dominant up until the political
II. Budapest a Central European metropolis: historical trajectories and port-socialist transformation
city, the growth of a sizeable CBD similarly to West Europe was simply not possible.
II.4.2. Inner-urban residential quarter
Moving from the city centre towards the periphery we reach a densely built residential area on both sides of the Danube, with 3–4 storey blocks of flats from the late 19th century. This is the so-called inner-urban residential quarter of Budapest, which provides housing mostly for the elderly. In terms of the quality of the building stock and the social status of the residents the zone is rather heterogeneous.
On the Buda side, and in the northern sector of the zone on the Pest side the quality of housing is better and the social status of residents is higher. On the other hand towards the eastern edge of the inner residential zone, extensive slum areas are stretching. Many dwellings in these areas date from the turn of the 20th century, when they were built on a speculative basis, and provided housing for the poor. As there was no proper maintenance of building and/or regeneration of old housing stock during socialism, these quarters started to decline irresistibly and became slums. Younger and better off families gradually moved out to the newly erected housing estates in the 1960s and 1970s, and they were replaced by other less affluent strata (e.g. Gipsy) (Ladányi, J. 1997).
II.4.3. Zone of transition
Close to the former administrative boundary of Little Budapest (i.e. the city before 1950) a wide zone of industrial and transport functions was developed from the 1880s when the first wave of industrial revolution reached Budapest. As pressure on the land was relatively low the use of land here is less intensive, follow areas and low quality, low-rise housing for the working class are mixing with industrial estates, warehouses, transport areas (railway stations etc.). The name of the zone is symbolising that once it was the very periphery of the city, the place of urban–rural transition.
The use of this zone became more intensive during the early phase of state socialism as the development of industry speeded up again.
New plants were settled here others were further developed in the 1950s. However, as the city entered the post-industrial phase of its development the decay of the transitional zone started to accelerate.
Many industrial plants were closed down or removed from Budapest after 1968 mainly for ecological reasons. Virtually all of them were located in the zone of transition. Some part of the newly evolving derelict land was re-used in the 1970s and 1980s, mainly for housing purposes of smaller housing estates. This gave new impetus to the re-development of the zone, though large-scale regeneration could not take place. With the collapse of socialism, most of the industrial plants were closed down, and a massive brown-field zone of derelict industrial areas has evolved.
II.4.4. Housing estates
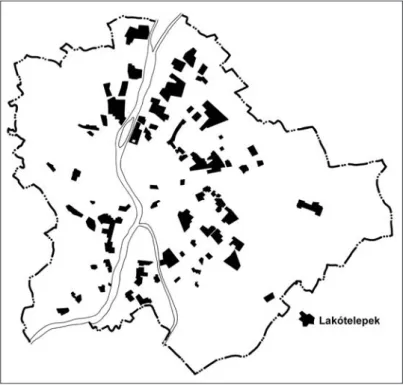
After World War II similarly to other state-socialist cities a ring of housing estates were gradually developed in Budapest. The peak of development in this zone was generated by the socialist housing policy in the 1960s and 1970s. To ease the serious housing shortage the state started to produce a vast number of almost identical 2-roomed flats in the form of housing estates (Egedy, T. 2000). These modern housing estates were located nearly exclusively on virgin sites close to the city boundary (Figure 9). The first generation of estates, built in the 1950s and 1960s was built close to the zone of transition and made use of existing transport and other infrastructure links. In typically low rise (2–3 storey) socialist–realist or ‘Stalin baroque’ style, they became symbols of the new political system. However, from the late 1960s pre-fabricated technology was applied which made the establishment of high density large scale housing estates possible. A typical housing estate of the 1970s comprised 12–15 thousand dwellings in ten-storey buildings and housed 40–50 thousand people. Due to site constraints, these estates were often constructed on undeveloped
‘greenfield’ sites in peripheral locations. Most estates were poorly
II. Budapest a Central European metropolis: historical trajectories and port-socialist transformation
Figure 9: Location of housing estates in Budapest Source: edition of the author
II.4.5. Zone of garden cities
The rise of what is now the outer residential ring started at the beginning of the 20th century when the lack of building plots and the extremely high rents within (Little-) Budapest fostered the growth of suburbs. Later the immigration waves from the disintegrated territories of Hungary after World War I and the world economic crisis generated mass movements towards the suburbs. As a consequence the population of the suburbs of Budapest increased from 130 to 530 thousand between 1900 and 1949. Most of these settlements were commuter villages or small towns prior to 1914 with low-rise, rural character.
Some of them grew to large cities with 60–70 thousand inhabitants due to new industrial functions arriving here in the inter-war period (e.g. Újpest, Kispest, Csepel). In 1950 as part of the newly introduced communist type administrative system (council system) these suburbs,
altogether 23 independent settlements, were forcefully attached to mainland Budapest. As a consequence, the total area of Budapest was enlarged from 207 to 525 square kilometres, and the population grew from 1 to 1.6 million. Despite its excessive development during state socialism this zone retained its rural character with lots of green areas and predominantly single family houses.
II.4.6. Villa-quarter of Buda
In general the Buda side is dominated by hilly landscape with forests. The rise of the Buda Hills started in the late 19th century when aristocrats and industrial magnates erected their elegant villas with spacious gardens. They were followed by members of the middle class who built their summer cottages in the upper lying regions in the subsequent decades. After World War II these villas and cottages were nationalised and divided into smaller dwelling units. A new renaissance of the Buda Hills started in the 1970s and 1980s when members of the communist ruling class started to build their single family homes and row-houses, reflecting the increasing polarisation of the socialist society. This is the stronghold of the middle class, comprising not only successful private entrepreneurs, but also some representatives of managerial and intellectual elites, most of whom made their fortunes rapidly in the favourable climate which emerged for them following the collapse of communism.
II.4.7. Suburban zone
This zone comprises the suburban settlements around Budapest which maintain strong ties with the city, lying in its daily commuting zone. After the ‘decapitation’ of the former suburban zone around Budapest in 1950 gradually a new zone of agglomeration evolved.
Through the development of the metropolitan transport network the city expanded its zone of influence dynamically in the 1950s and
II. Budapest a Central European metropolis: historical trajectories and port-socialist transformation
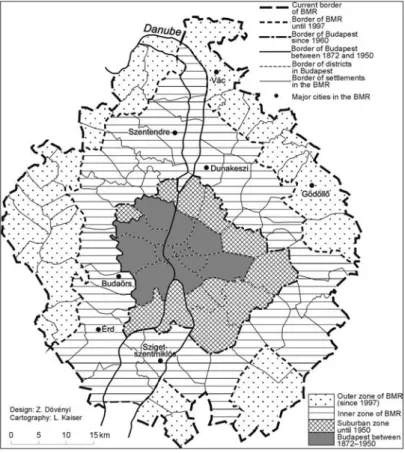
were further intensified after 1990; this was also recognised by regional planning, when the Hungarian government extended the boundary of the agglomeration with its decree in 1997. Today the agglomeration of Budapest officially consists of 78 settlements, some of them are towns of middle rank (Figure 10).
Figure 10: Division of Budapest Metropolitan Region (BMR) Source: edition of Zoltán Dövényi – Lívia Kaiser
II.5. Main features of urban transformation after 1990
After 1990 the political and economic transformations have generated far reaching changes in the internal socio–economic structure of Budapest. Due to the migration of better off households to
the suburbs the population of Budapest has decreased by over 300 thousand residents – from a little over 2 million in 1990 to about 1.7 million in 2009. As a consequence of suburbanization the balance of population between the core city and the agglomeration has shifted. In 1990 only 17 percent of the functional urban region resided in the zone of agglomeration whereas the share of agglomeration increased to 35 percent by 2009.
Before 1990, the communist state made hardly any investments in communal infrastructure or services in the suburban areas, consequently those areas were not considered desirable at all by the better off households. From the middle of the 1980s a new migration tendency started in the Budapest urban region, which could be labelled as initial, ‘low intensity’ suburbanization, marked by the change of the balance of migration of Budapest against the surrounding Pest county into negative. The loss was not significant for several years and was still counterbalanced by a positive migration balance to Budapest from other parts of Hungary. From the early 1990s, however, the period of intense suburbanization started. Due to suburbanization the loss of population of Budapest increased rapidly and almost reached the level of 18 thousand persons a year. This trend changed again after 2007 and the inflow of people from the countryside outnumbered those who left Budapest.
The selective deconcentration of the population resulted in radical changes of the social and demographic characteristics of the local society. Generally, the social status of the agglomeration increased. This is confirmed by the growing presence of highly educated residents, the proportion of people with university education (within the age group above 15) increased from 3.2 to 12.7 percent between 1990 and 2001. Looking at the individual zones tremendous shifts could be also figured out (Figure 11).
II. Budapest a Central European metropolis: historical trajectories and port-socialist transformation
Figure 11: Changes of social status in the different urban zones Source: edition of Zoltán Kovács – Balázs Szabó
Regarding the different urban zones we can also figure out the following socio–spatial processes in the post-1990 period. In the following the up- and down trajectories of the different ecological zones are briefly characterized.
II.5.1. City centre – explosion of business functions
The post-socialist urban development in the centre of Budapest was signalised by rapid and intensive reinvestment at the urban core, which resulted in the spectacular regeneration and expansion of the city centre (Kovács, Z. – Wiessner, R. 2004). The reasons should be sought in the wider restructuring of the economy, which brought about high dynamism of tertiary activities especially in the field of business services, commerce and tourism. Generally, this led to a growing demand for non-residential (business, office etc.) space in the city centre. The re-establishment of real estate market, based upon land-rent, made the rapid functional conversion in the centre of Budapest possible. Many new firms bought flats in the centre of the town for office purposes, and gradually changed the function of the buildings.
As a consequence, the city centre is losing its earlier residential
profile, which is also justified by the fact that the population number of the core has decreased by 29 percent between 1990 and 2001. This was the highest rate among the ecological zones. In addition to that the composition of the population is also changing.
The proportion of elderly (above 60) decreased from 29.6 to 27.2 percent, whereas the proportion of college educated increased from 20 to 25 percent between 1990 and 2001. These changes are clear signals of gentrification in the city centre. The volume of commercial and business investment has also been growing in the city centre. Large part of the headquarters of foreign companies and newly established domestic enterprises are also concentrated in the centre of Budapest which directly contributes to the physical upgrading of the city-centre. The weight of the CBD in the new form of capital accumulation is well demonstrated by the mushrooming of new office buildings, large-scale commercial and tourist investments. There is an obvious connection between the functional change and revitalisation of inner city neighbourhoods and the growing integration of Budapest to the world economy.
II.5.2. Inner-urban residential quarters – up- and down- grading
Deregulation of the housing market and the growth of income differentials are automatically producing new forms of polarisation in the urban space. In Budapest this process is most visible in the inner-urban residential quarters.
In the densely built-up inner quarters of Budapest state ownership of housing used to be extreme high (above 95 percent) before 1990. In terms of social composition, neighbourhoods along the Danube and inside the arc of Nagykörút (Grand Boulevard) have always had better-quality housing and thus higher social status.
Moving outwards from the line of Grand Boulevard the quality of housing stock and the status of residents rapidly declined. The
II. Budapest a Central European metropolis: historical trajectories and port-socialist transformation
1990. These areas were stuck in a vicious circle of social erosion and further physical decline after 1990.
The worst slums are located in Józsefváros (8th District) where a high proportion of the population is Gipsy, and that part of Erzsébetváros (7th District) where the Jewish ghetto was located in the final stages of World War II. Migration trends after the fall of communism further intensified the ethnic character of these districts (Kovács, Z. 1998). As economic restructuring hit hard the north–eastern regions of Hungary, the traditional stronghold of Gipsy minority, a gradual migration of poor, unemployed Gipsy could be observed from these regions towards the larger cities and Budapest. Most of the newly arriving Gipsy concentrate in the two above-mentioned neighbourhoods.
On the other hand, also positive examples could be already found for urban regeneration in these dilapidated inner-city residential neighbourhoods. Perhaps the earliest and most successful example is the SEM IX. project, which aimed at the comprehensive rehabilitation of the Middle Ferencváros (9th District). The long years of communism brought a substantial physical decay and a social downgrading in Ferencváros as well, which in turn resulted a severe social exclusion already by the late 1980s. In 1992 the local government has started here the first large-scale rehabilitation programme in the history of Budapest including housing renovation and construction of new dwelling units (partly public rentals), improvement of the green environment and public spaces etc. The project was designed according to the French SEM model (Societé d’Économie Mixte) which is a public–private partnership by the local government (with 51 percent) and a Hungarian–French consortium of investors (OTP Bank from Hungary and the French Caisse des Depôts Consignations with altogether 49 percent).
The first ten years of the rehabilitation project has proved to be very successful and innovative under Hungarian and East Central European circumstances. Roughly 100 buildings with obsolete conditions with 700 dwellings were torn down. In their place, new buildings were constructed with over 1000 dwelling units, and almost as many apartments have been completely renovated. The project created an attractive residential environment with green
inner-courtyards and a small pedestrian zone, and it can be seen as the flagship project of urban rehabilitation in Budapest (Kovács, Z. – Wiessner, R. 2004).
II.5.3. Zone of transition – slow conversion
Due to the lack of investment the industrial and commercial belt (the so-called zone of transition), that was established in the late 19th century between the inner residential quarters and the outer zone, became and industrial blight area by the early 1990s.
The decline of the zone started already in the 1970s and 1980s when many heavily polluting industrial plants were either closed down or removed to the country-side by the communist power.
The expansion of derelict industrial spaces was further intensified by the economic restructuring and the collapse of state socialist industry after 1989–1990.
Among the derelict industrial and commercial spaces low quality housing can also be found mainly in the form of single blocks of flats or small-scale housing estates built typically for the workers. The proportion of dwellings without bathroom is the highest here among the ecological zones of Budapest with 12 percent in 2001. Consequently, the social status of the belt is also traditionally low, in 1990 only 8.7 percent of the inhabitants held university or college degree, which increased to 13.3 percent by 2001, nonetheless this is still the lowest figure among the functional zones.
As a new phenomenon, economic transition has brought about new investments in the zone of transition since the late 1990s. Over the last few years more pronounced developments could be seen in the belt that are targeted mainly at locations with good accessibility and transport connections. Geographically, the investments concentrate mainly along the radial main roads (e.g.
Váci út, Üllői út). Once again, international companies are the
II. Budapest a Central European metropolis: historical trajectories and port-socialist transformation
near the Danube. Latter can be considered the first technopolis of Hungary with altogether 100 thousand m2 office space. The Hungarian state is also among the major investors, with the new campus of the Faculty of Science of the Eötvös Loránd University and the new National Theatre located on either side of Danube, south of the city centre.
II.5.4. Housing estates – time bomb of communism
Housing estates can be considered generally the losers of the transition. The popularity of housing estates in Budapest was at its peak in the 1970s, when large-scale estates were developed at peripheral locations by the central government. On the eve of political changes already 36 percent of the population lived on housing estates in Budapest, which comprised altogether 268 thousand dwelling units (typically 2 roomed flats). After 1990 there was no new housing estate project developed in Budapest.
Existing housing estates lost their popularity rapidly because of their architectural monotony, lack of green spaces, decreasing security and relatively high costs of amenities (especially heating).
This reflected very well in the mass out-migration of younger and better off people from these estates. As a consequence more than 110 thousand people left the housing estates and the total population of housing estates decreased by 15.2 percent between 1990 and 2001. The pace of population loss at housing estates was similar to that of the city centre. Due to the highly selective out- migration the social composition of housing estates has also been changing, the ratio of elderly is increasing, just like the socially disadvantaged families.
II.5.5. Zone of garden cities – new dynamism
This is the only zone within the administrative boundary of Budapest where a population growth has been observable since 1990. The most important advantages of this formerly socially mixed and rather insufficiently developed zone are: its low rise character with lots of green spaces, the relatively good accessibility
and the unlimited quantity of plots for new developments. These factors made the zone attractive both for individuals and some major real estate developers who realised their housing projects in this belt increasingly. A new phenomenon under the Hungarian circumstances is the mushrooming of the so-called residential parks (‘lakópark’) (Hegedűs, G. 2009).
These residential parks are very similar to the North American ‘gated communities’, as they are perfectly cut off from the surrounding areas and provide lots of additional services for the residents (e.g. guard and security system, parking facilities, play- ground). Most of the residential parks are located on the Buda side and at the periphery of Pest, fitted into green. Dwellings of such residential parks are sold by the developer on the free market at a price level which is 2–3 times higher than the average. Since these dwellings are affordable only for better off Hungarian households and foreigners the construction of residential parks resulted in the growing status of the zone of garden cities. The ratio of inhabitants with higher education grew from 10.5 to 16.6 percent between 1990 and 2001, and at the same time the society of this belt became also younger. The recent take off of the garden city belt can be considered a kind of ‘internal suburbanization’ in Budapest.
II.5.6. Villa quarter of Buda – ageing wealth
The villa quarter of Buda is the traditional enclave of upper–
middle class households. The attractive Buda Hills preserved, or even strengthened their upmarket position after the political changes of 1990. With the division of existing plots or creation new ones on the expenses of green areas, and the extension of former residential buildings the housing stock of the Buda Hills grew dynamically by 11.7 percent between 1990 and 2001. Despite the expansion of the housing market the population of the quarter did not grew, but even a modest (4.8 percent) population decrease
II. Budapest a Central European metropolis: historical trajectories and port-socialist transformation
Despite the accelerating ageing the social status of the zone has not changed, and it is still the highest status belt in Budapest. In 1990, already 33.5 percent of the inhabitants held a university or college diploma in the quarter which grew to 42.6 percent by 2001. This figure was twice the Budapest average in both years. In the future a further population decrease and concomitant ageing process is expected in the Buda Hills. The availability of sites for new housing construction has in the meantime strongly diminished, on the other hand the popularity of the suburban belt or the zone of garden cities with the residential parks is clearly higher among young and affluent families.
II.5.7. Zone of agglomeration – limitless urban sprawl As it was pointed out earlier, one of the most spectacular features of the post-socialist development in Budapest is the excessive growth of the suburbs. As in the western countries suburbanization was fuelled here both by residential mobility and the relocation of business functions from the city to the periphery.
In this process two stages of suburban development is observable after 1990. First the wave of residential suburbanization took off on the eve (or even before) the political changes (Kovács, Z. – Tosics, I. 2014).
The main thrust of residential suburbanization affected mainly villages located to the north and west of Budapest, which is a hilly landscape offering very attractive environment for the newcomers. The housing construction in these villages reached its peak by the end of the 1990s beginning of 2000s, above all in the form of detached family homes, terraced housing and some residential park projects. According to empirical research most of the new households are younger families with children (Kok, H. – Kovács, Z. 1999). However, a specific feature of suburbanization around Budapest is that not only the middle-class families, but also lower class and elderly people are leaving the city, who are suffering from rising living costs what they can hardly afford.
Their main destinations are however, the municipalities located to the east and south of the city, where the plain landscape offers
less attractive residential environment. In spite of these tendencies the average social status of the suburban belt is clearly growing, the new suburbs with their luxurious environment are in sharp contrast with the decaying inner urban neighbourhoods or high- rise housing estates.
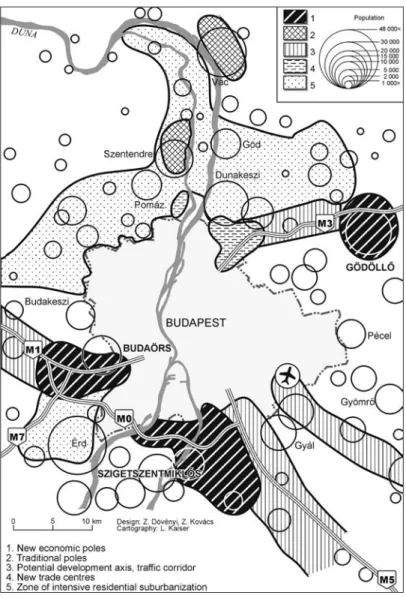
In addition to residential suburbanization clear sings of suburbanization of commercial functions could be also distinguished from the late 1990s. However, we should note that the suburban companies are less frequently relocations from the centre of the city, although there are several examples (e.g. Pannon GSM) also for that, but more often new commercial investments, mainly by foreign companies. The newly erected shopping and leisure centres, as well as office complexes are mostly in the form of green field investments. This process of the de-concentration of the economy led to the emergence of new economic growth poles, kind of edge-cities in the agglomeration zone of Budapest of which perhaps the most pronounced is the Budaörs–Törökbalint concentration at the western gate of Budapest, along the motorway leading to Vienna (Burdack, J. et al. 2004).
The growing relocation of work places and the dynamic increase of car ownership created new pattern of daily commuting around Budapest. On the whole the relative de-concentration of the population and firms resulted in a new spatial pattern of the agglomeration of Budapest (Figure 12).
II. Budapest a Central European metropolis: historical trajectories and port-socialist transformation
Figure 12: New spatial structure of the suburban belt around Budapest Source: edition of Zoltán Dövényi – Zoltán Kovács – Lívia Kaiser
II.6. Conclusions
Budapest as the capital city of Hungary and a major hub of international business corporations is a rapidly transforming city. The transformation process was launched by the political and economic
changes of the early 1990s. The different zones of the urban region were affected differently by the transformation, which is market-led and generates both up- and down-grading processes in the city. There are two major areas where upward processes are most evident in metropolitan Budapest: the central business district and the suburbs. Neighbourhoods lying between these two dynamic zones reveal some more controversial development. In most of the inner urban residential neighbourhoods that were severely neglected during the communist era a further decline can be observed. In some of these neighbourhoods physical deterioration is accompanied by extreme forms of social segregation and social exclusion. Only a limited number of neighbourhoods provide examples for upward trajectory, these are mostly the core areas of urban rehabilitation actions. Neighbourhoods affected by rehabilitation programmes are going through rapid population change, the old and less affluent population is being displaced in a gentrification process that resembles very much the western cities. The biggest challenge for the future development of the city is caused by the high rise housing estates. These large-scale monotonous housing estates are becoming more and more the shelter of the urban underclass.
II.7. References
Burdack, J. – Dövényi, Z. – Kovács, Z. 2004: Am Rand von Budapest – Die Metropolitane Peripherie zwischen nachholender Entwicklung und eigenem Weg. – Petermanns Geographische Mitteilungen 148: (3). pp. 30–39.
Compton, P. 1979: Planning and Spatial Change in Budapest. – In.
French, R. A. – Hamilton, F. E. I. (eds.): The Socialist City. – New York: John Whiley. pp. 461–491.
Dingsdale, A. 1999: Budapest’s Built Environment in Transition. – GeoJournal 49: (1). pp. 63–78.
Egedy, T. 2000: The situation of high-rise housing estates in Hungary. – In. Kovács, Z. (ed.): Hungary Towards the 21st century. The Human