patterns of children and adolescents in Korea: A c-CURE clinical cohort study
YEONG SEON JO
1,2, SOO YOUNG BHANG
3,
JUNG-SEOK CHOI
4,5, HAE KOOK LEE
6, SEUNG YUP LEE
7and YONG-SIL KWEON
6p1Department of Psychology, The Sung-Shin Women’s University, Seoul, South Korea
2Department of Psychiatry, The Catholic University of Korea Uijeongbu St. Mary’s Hospital, Gyeonggi, South Korea
3Department of Child and Adolescent Psychiatry, Eulji University School of Medicine, Seoul, South Korea
4Department of Psychiatry, SMG-SNU Boramae Medical Center, Seoul, South Korea
5Department of Psychiatry and Behavioral Science, Seoul National University College of Medicine, Seoul, South Korea
6Department of Psychiatry, Uijeongbu St. Mary’s Hospital, Catholic University College of Medicine, Gyeonggi, South Korea
7Department of Psychiatry, Eunpyeong St. Mary’s Hospital, Catholic University College of Medicine, Seoul, South Korea
Received: December 17, 2019 • Revised manuscript received: March 21, 2020 • Accepted: April 10, 2020 • Published online: July 7, 2020
ABSTRACT
Background and aim:Whereas many studies on Internet gaming disorder (IGD) have used self- report questionnaires, only a few have adopted clinical interviews and samples. The current study aimed at using data from face-to-face diagnostic interviews, based on the criteria for IGD in the DSM-5, to determine the Internet, gaming, and smartphone usage patterns of children and adolescents.Methods:A latent class analysis was conducted using data collected through diag- nostic interviews for Internet, gaming, and smartphone addiction with 190 participants (M 5 13.14 years,SD52.46; 143 boys, 47 girls) who were part of a multicenter clinical cohort study.
Results: Participants were classified into four groups: pleasure-seeking (Class 1), internal-use (Class 2), problematic-use (Class 3), and pathological-use (Class 4). The pleasure-seeking group (8.11%) showed low tendencies in general and proper control. The internal-use group (17.63%) showed significant increases in“cognitive salience”and“craving,”with strong internal desires.
The problematic-use group (37.28%) had no“interference with role performance”; however, they displayed“difficulty regulating use”and“persistent use despite negative consequences,” with a slight functional impairment. The pathological-use group (36.98%) scored the highest on all these items, revealing a severe functional impairment. Compared to the other groups, the pathological-use group had the highest depression and daily stress levels and displayed the lowest levels of happiness.Conclusions: This study provides basic data to elucidate Internet, gaming, and smartphone overuse patterns among children and adolescents, which could be used to develop differentiated intervention strategies for each group.
KEYWORDS
Internet, gaming, smartphone, usage patterns, children, adolescents, latent class model
Journal of Behavioral Addictions
9 (2020) 2, 420-432 DOI:
10.1556/2006.2020.00022
© 2020 The Author(s)
FULL-LENGTH REPORT
*Corresponding author’s.
e-mail:yskwn@catholic.ac.kr
INTRODUCTION
Gaming addiction was first identified as Internet gaming disorder (IGD) in the Diagnostic and Statistical Manual of Mental Disorders, 5th Edition (DSM-5; American Psy- chiatric Association [APA], 2013). Given the lack of empirical research, it was classified as a condition for further study and included as part of DSM-5 Section III, Emerging Measures and Models, rather than being considered a formal diagnosis (APA, 2013). Since 2014, the World Health Organization (WHO) has indicated gaming addiction as an important public health issue (World Health Organization [WHO], 2014). In 2015, gaming addiction was named “gaming disorder” (GD), and its listing in the International Classification of Dis- eases (ICD) was promoted (WHO, 2016). In 2019, GD was passed as an official disease included in the ICD-11 (WHO, 2019). Preliminary data showed that addiction to the Internet, games, and smartphones is a serious social phenomenon, which requires clinical attention; however, the introduction of GD as an official disease remains debated (Aarseth et al., 2017; Kuss, Griffiths, & Pontes, 2017a, 2017b; Rumpf et al., 2018; VandenBrink, 2017).
Thus, diagnostic evidence is needed regarding the clinical characteristics of GD. In addition to the existing games and Internet addiction, the high accessibility and mobility of smartphones has determined the inclusion of a smartphone addiction too (Yu & Sussman, 2020).
Although the addictive behaviors, concepts, usage devices, and usage contents are not clear yet, theories about the psychological and biological foundations of the prob- lematic use have been proposed. Further multidisciplinary research is needed to define the problematic overuse of Internet, games, and smartphones, users’ characteristics, and social consensus regarding treatment techniques.
Internet, gaming, and smartphone addiction are not affected by a single factor only; thus, various aspects should be considered in the biopsychosocial framework, such as personal characteristics, parent-related variables, peer- related variables, and school-related variables. Depression contributes to functional problems, such as restricting out- door activities because of excessive use of the Internet, gaming, and smartphones, as well as over-involvement with virtual interpersonal relationships (Jo et al., 2019;Lee et al., 2018; Liu et al., 2018; Wang, Cho, & Kim, 2018). Gaming addiction is associated with low self-esteem, high impul- siveness, and high aggressiveness (Park, Kim, & Kang, 2013;
Ryu et al., 2019; Wang et al., 2018). Children and adoles- cents with high aggression and high harm-avoidance tend to have an increased likelihood of gaming problems as they obtain increased positive psychological rewards through gaming (Park et al., 2013). High-risk groups for Internet addiction include those with high stress and low happiness levels (Kim & Yu, 2017;Lee et al., 2018; Park & Jo, 2018; Ryu et al., 2019). Moreover, happiness has a mitigating in- fluence on both smartphone (Park & Jo, 2018) and Internet addiction (Muusses, Finkenauer, Kerkhof, & Billedo, 2014).
Most research has used a variable-centered approach, exploring a single factor affecting Internet, gaming, and smartphone addiction and its relationship with other vari- ables (Jo et al., 2019; Kim & Yu, 2017;Lee et al., 2018; Liu et al., 2018;Muusses et al., 2014;Park et al., 2013;Park & Jo, 2018; Ryu et al., 2019). This approach assumes that partic- ipants in the sample are taken from a single population and sums multiple items into one addiction level. Therefore, interpreting the heterogeneous individual differences within addiction groups or the content of various items is chal- lenging (Meyer & Morin, 2016).
Conversely, a person-centric approach assumes that the relationships among variables differ between individuals (Meyer & Morin, 2016) and estimates the attributes shared by members in the same group by the levels of variables (Magnusson, 2003). Therefore, a person-centric approach would be beneficial to clarify the addictive usage patterns in children and adolescents and determine their personal characteristics through a latent class analysis (LCA) (Ver- munt & Magidson, 2002).
The latent classes of Internet addiction and use have previously been examined (Deleuze et al., 2015; Kwon &
Kwon, 2017;Park & Lee, 2018;Vermunt & Magidson, 2002;
Wang et al., 2018); however, most analyses were based on aggregated sub-factor scores from the addiction scale or by the type and level of addictive behavior, rather than each item (Deleuze et al., 2015; Kwon & Kwon, 2017; Lee et al., 2018; Park & Lee, 2018; Pickard, 2016). Previous research relied on self-report questionnaires; thus, the addiction level might be measured inaccurately because of the denial de- fense mechanism, a characteristic of addiction (Pickard, 2016).
This study included an LCA of data collected through face-to-face interviews conducted by clinical psychologists and psychiatrists. The diagnostic criteria for IGD in the DSM-5 were used to determine Internet, gaming, and smartphone usage patterns in a multicenter clinical cohort of children and adolescents. Additionally, we identified the usage patterns to determine distinct groups of individuals and examined the differences in users’ psychosocial char- acteristics to provide a comprehensive understanding of children and adolescents’Internet, gaming, and smartphone use. We asked, first, what are the latent subgroups of Internet, gaming, and smartphone usage patterns in children and adolescents? Second, what are the differences in psy- chosocial variables in the identified latent subgroups?
MATERIALS AND METHODS
Participants and procedure
The c-CURE study is a prospective cohort study designed to track the natural history of Internet, gaming, and smart- phone addiction in children and adolescents, and identify risks and protective factors. It was conducted from August 2015 to August 2019 in Seoul and Gyeonggi-do, Korea and included 194 participants (Jo et al., 2019). Children,
adolescents, and their primary caregivers who wished to participate completed a screening questionnaire on Internet and smartphone addiction. Participants with scores crossing the screening threshold were eligible to participate. In this study, data from 190 of the 194 participants were analyzed (four people with incomplete diagnostic interviews for addiction [DIA] were excluded).
Participants’ mean age was 13.14 (SD 5 2.46), and included 51 children and 139 adolescents (143 boys; 47 girls). Clinical psychologists and psychiatrists conducted face-to-face, semi-structured interviews with the participants and their primary caregivers. Participants and caregivers also completed self-report questionnaires (Fig. 1). Follow-up interviews with participants and caregivers were conducted after three and six months. Finally, we standardized the protocols, including training, to ensure the reliability and validity of the diagnostic evaluation.
Diagnostic interview for Internet, gaming, and smartphone addiction
The DIA is a semi-structured interview diagnostic tool developed by adding“craving”to the nine diagnostic items for IGD in the DSM-5 (Jo et al., 2019; Ryu et al., 2019).
Clinical psychologists and psychiatrists asked questions related to Internet’s contents and devices. The DIA in- terviews with each participant and primary caregiver lasted approximately 15–20 min. Participants’ responses were
combined with clinicians’ impressions and determined whether participants were addicted to the Internet, gaming, and/or smartphones. Items were rated on a four-point scale, ranging from 0 to 3 (0: no information, 1:no symptoms, 2:
below threshold, and 3:above threshold), and the number of DIA items were used to assess addiction (range50–10; 0–2 5 mild-risk, 3–4 5 moderate-risk, 5–10 5 addicted). The scale’s internal consistency for this study wasa50.768 at baseline anda50.813 at the six-month follow-up.
Internet and smartphone addiction scales
Internet addiction symptoms were measured using the Korean Scale for Internet Addiction (K-scale), Young’s Internet Addiction Test (YIAT) for children and adoles- cents, the Internet Addiction Proneness Scale for Child (O_C), and the Internet Addiction Proneness Scale for Adolescents (O_A). Both contained observer’s scales completed by the primary caregivers. Smartphone addiction symptoms were measured using the Smartphone Addiction Scale-short form version (SAS-SV) and the Smartphone Addiction Scale (S-scale). Higher scores indicated higher levels of Internet and smartphone addiction.
The K-scale is a 40-item questionnaire developed by the National Information Society Agency. It is measured on a 4- point Likert scale (Korean National Information Society Agency, 2013), and in this study the Cronbach’s alpha was 0.940. The YIAT was developed by Young (Young, 1998), and validated and translated into Korean by Kim et al. (Kim, Lee, & Oh, 2003). It consists of 20 questions rated on a 5- point Likert scale with an internal consistency in this study of 0.928. Primary caregivers completed the observer’s scales comprising 15 items rated on a 4-point Likert scale. The internal consistency in this study was 0.861 for O_C and 0.867 for O_A (Kim et al., 2015; Korean National Infor- mation Society Agency, 2011). The 10-item SAS-SV was rated on a 6-point Likert scale with an internal consistency of 0.903 in this study (Kwon, Kim, Cho, & Yang, 2013).
Different cutoff values were suggested for each sex group based on the ROC analysis. The SAS-SV has cutoff values of 31 points for boys and 33 points for girls, which indicate problematic use. The 15-item S-scale is measured on a 4- point Likert scale with an internal consistency of 0.898 in this study (Kim, Chung, Lee, Kim, & Jeon, 2016).
Psychosocial variables
Psychosocial variables associated with Internet, gaming, and smartphone addiction, such as depression, impulsivity, aggression, everyday stress, and happiness were measured, with higher scores indicating higher levels of the variables.
The Children Depression Inventory (CDI) and Beck Depression Inventory-II (BDI-II) were used to measure depression in children and adolescents, respectively. The BDI-II includes 21 items on a 4-point scale and was devel- oped by Beck et al. (Beck, Steer, & Brown, 1996) and vali- dated in Korean by Lee et al. (Lee, Lee, Hwang, Hong, &
Kim, 2017). The Cronbach’s alpha in this study was 0.944.
The 27-item CDI was adapted from the BDI for use with Fig. 1.Studyflow chart and sociodemographic characteristics. The
cutoff values for each screening scale are presented. K-scale: Korean Scale for Internet Addiction for adolescents; SAS-SV: Smartphone Addiction Scale-short form version; S-scale: Korean smartphone addiction scale; O_C: Internet Addiction Proneness Scale for Child, checked by caregivers; O_A: Internet Addiction Proneness Scale for Adolescents, checked by caregivers; DIA: Diagnostic interview for
Internet, game, SNS, etc. addiction
school-aged children (Kovacs, 1983), and translated into Korean byCho and Lee (1999). It is rated on a 3-point scale, and in this study, the Cronbach’s alpha was 0.813.
The Barratt Impulsiveness Scale-II (BIS-II), which mea- sures impulsiveness (Barratt & White, 1969), was translated by Lee into Korean (1992). The BIS-II assesses 23 items on a 4-point scale, and the internal consistency in this study was 0.821.
The Aggression Questionnaire (AQ) for measuring aggression levels was developed by Buss and Perry (1992) and translated into Korean by Seo and Kwon (2002); it consists of 27 items measured on a 5-point Likert scale. Its internal consistency in this study was 0.884.
The Daily Hassles Questionnaire (DHQ) developed by Rowlison and Felner (1988)and translated into Korean by Han and Yoo (1995)was used to measure adolescents’daily stress was. It includes 36 questions on a 4-point Likert scale with internal consistency in this study of 0.934.
The Happy Scale was developed to measure the happi- ness of Korean adolescents (Bang et al., 2007). It consists of four sub-factors: self-concept, family relationships, leisure activities, and friendship. This 30-item scale is measured on a 4-point Likert scale, with an internal consistency in this study of 0.922.
Statistical analyses
Data analyses comprised two stages. Latent class modeling based on the 10 DIA items was performed with Mplus 8.0, and maximum likelihood estimation was used. Differences in psychosocial variables among latent groups were analyzed with SPSS 23.0 (SPSS, Inc., Chicago, IL, USA). First, LCA was used to classify the latent classes of Internet, gaming, and smartphone usage patterns among participants based on the 10 DIA items. To perform the LCA, the number of clusters was determined. Given the lack of a widely accepted statistical indicator, several statistical information indices were used in combination (Nylund-Gibson, Asparouhov, &
Muthen, 2007). Specifically, the number of latent classes was determined using Akaike’s information criterion (AIC;
Akaike, 1987), Bayesian information criterion (BIC;
Schwarz, 1978), and sample-size-adjusted BIC (SABIC;
Sclove, 1987). For these indices, lower values indicated better agreement with the model (Muthen, 2004). A class was added when the proportion of participants belonging to the latent class was at least 5% (Jung & Wickrama, 2008). If the Lo-Mendell-Rubin adjusted likelihood ratio test (LMR LRT;
Lo, Mendenll, & Rubin, 2001) and bootstrap likelihood ratio test (BLRT; McLachlan & Peel, 2000), which statistically analyzed the research hypothesis assuming the number of latent classes as k and the null hypothesis assuming the number of latent classes as k-1, have a significant probability of less than 0.05, the null hypothesis is rejected and the research hypothesis is adopted. Entropy, which assesses the quality of latent class classification, increases as the proba- bility of belonging to one latent class is close to 1 while the probability of belonging to another latent class is close to 0 (Ramaswamy, DeSarbo, Reibstein, & Robinson, 1993).
Therefore, the range of entropy is between 0 and 1. If it is about 0.6, 80% or more, it is considered properly classified, and if it is 0.8 or more, 90% or more is considered properly classified (Muthen, 2004). In fact, entropy can be used to determine if too many latent classes are extracted and determine the usefulness of LCA to see whether the set of indicators are actually suitable for grouping in the samples.
Separately, in accordance with the recommendations of Muthen and Muthen (2000), the interpretability of each latent class and ratio of latent class to samples were considered. The final number of latent classes was deter- mined combining the values of each information criteria index, and the ratio and interpretability of each latent class.
To clarify Internet, gaming, and smartphone usage patterns per latent class, the collective characteristics of the latent class were interpreted.
Second, after the latent classes were divided, chi-square tests, analyses of variance (ANOVAs), and paired-samplet- tests were conducted to verify the differences in psychosocial variables between the latent classes. The differences between the groups that showed significant differences in the ANOVA were examined in more detail through Duncan’s post-hoc test. In addition, paired t-tests were conducted to identify the changes in Internet, gaming, and smartphone addiction symptoms and average Internet use on weekdays and weekends after six months.
Ethics
This study was approved by the Institutional Review Boards for human participants of Uijeonbu St. Mary’s Hospital (no.
UC150NMI0072), Eulji University Eulji Hospital (no., EMCS2015-05-020-001), and SMG-SNU Boramae Medical Center (no. 16-2016-4). Written consent was obtained from all participants and their primary caregivers after the re- searchers explained the study and discussed confidentiality and voluntary participation. This study was conducted in accordance with the Declaration of Helsinki.
RESULTS
Latent classes of Internet, gaming, and smartphone use
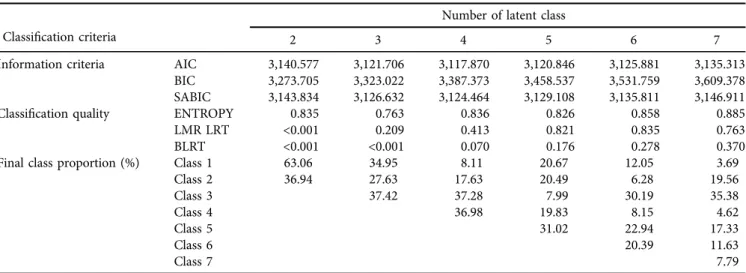
Determining the number of latent classes. The models assuming two, three, four, five, six, and seven latent classes were estimated to determine the number of latent classes by Internet, gaming, and smartphone usage patterns. Table 1 shows the concordance indices of the latent class models with different numbers of latent classes. Consequently, the AIC and SABIC values were lowest when the number of latent classes was four (Muthen, 2004). The value of BIC increased as the number of latent classes increased; however, the rate of change decreased after four latent classes. Further, the quality of classification was over 90% because entropy was 0.836 (i.e., >0.8; Muthen, 2004). Although the proba- bilities of LMR LRT and BLRT were not significant (p >
0.05), the relatively small number of cases (N 5190) may have influenced these results (Rost, 2006). When the number of latent classes was four, the proportion of latent classes was evenly distributed and a clinical interpretation was possible.
Thus, thefinal number of latent classes was four.
Forms of latent classes. Table 2andFig. 2show the mean, standard error, and stress levels of the DIA items for the four latent classes, which were named using each latent class’s characteristics with the following related variables. For Class 1, the levels of DIA 4 (difficulty regulating use) and DIA 6 (persistent use despite negative consequences) increased negligibly; however, the remaining items showed a low level of about 0.200 or lower overall; thus, the class was named the“pleasure-seeking”group. For Class 2, DIA 1 (cognitive salience) and DIA 10 (craving) levels increased significantly, DIA 7 (deceiving) increased negligibly, and the levels of all other items were noticeably lower than 0.100. Given that the
problematic behavioral characteristics of Internet, gaming, and smartphone use were appearing inherently, Class 2 was called the “internal-use” group. For Class 3, DIA 9 (inter- ference with role performance) was 0; however, DIA 4 (difficulty regulating use) and DIA 6 (persistent use despite negative consequences) increased considerably, with a slight functional impairment. Class 4, on the other hand, showed the highest levels on all DIA items compared to the other latent classes. In particular, the levels of DIA 4 (difficulty regulating use), DIA 6 (persistent use despite negative con- sequences), and DIA 9 (interference with role performance) were significantly higher than those of other potential groups, indicating severe functional impairment. Conse- quently, Class 3 was named the “problematic-use” group, and Class 4 was named the“pathological-use”group.
Fifteen people (8.11%) were in the pleasure-seeking group (Class 1), 34 (17.63%) in the internal-use group (Class 2), 71 (37.28%) in the problematic-use group (Class 3), and Table 1.Fit measures of latent classes models
Classification criteria
Number of latent class
2 3 4 5 6 7
Information criteria AIC 3,140.577 3,121.706 3,117.870 3,120.846 3,125.881 3,135.313
BIC 3,273.705 3,323.022 3,387.373 3,458.537 3,531.759 3,609.378
SABIC 3,143.834 3,126.632 3,124.464 3,129.108 3,135.811 3,146.911
Classification quality ENTROPY 0.835 0.763 0.836 0.826 0.858 0.885
LMR LRT <0.001 0.209 0.413 0.821 0.835 0.763
BLRT <0.001 <0.001 0.070 0.176 0.278 0.370
Final class proportion (%) Class 1 63.06 34.95 8.11 20.67 12.05 3.69
Class 2 36.94 27.63 17.63 20.49 6.28 19.56
Class 3 37.42 37.28 7.99 30.19 35.38
Class 4 36.98 19.83 8.15 4.62
Class 5 31.02 22.94 17.33
Class 6 20.39 11.63
Class 7 7.79
Notes: AIC: Akaike’s information criterion, BIC: Bayesian information criterion, SABIC: sample size-adjusted Bayesian information criterion, LMR LRT: Lo-Mendell-Rubin adjusted likelihood ratio test, BLRT: bootstrap likelihood ratio test. All values of LMR LRT and BLRT indicate theP-value.
Table 2.Means and standard errors of DIA items for the four latent groups
Class 1 Class 2 Class 3 Class 4
M SE M SE M SE M SE
DIA 1 (cognitive salience) 0.193 0.111 0.590 0.115 0.789 0.092 0.916 0.038
DIA 2 (withdrawal) 0.066 0.066 0.000 0.000 0.498 0.128 0.793 0.072
DIA 3 (tolerance) 0.153 0.114 0.068 0.051 0.326 0.144 0.887 0.068
DIA 4 (difficulty regulating use) 0.281 0.150 0.013 0.172 0.767 0.070 0.938 0.066
DIA 5 (decrease in other activities) 0.000 0.000 0.069 0.049 0.145 0.083 0.604 0.091
DIA 6 (Persistent use despite negative consequences)
0.355 0.142 0.000 0.000 0.585 0.104 0.770 0.071
DIA 7 (deceiving) 0.184 0.110 0.037 0.040 0.104 0.057 0.477 0.089
DIA 8 (escape of negative feelings) 0.206 0.105 0.230 0.081 0.193 0.057 0.348 0.077
DIA 9 (interference with role performance)
0.195 0.104 0.030 0.031 0.000 0.000 0.256 0.085
DIA 10 (craving) 0.226 0.118 0.604 0.100 0.947 0.037 0.985 0.016
Final class proportion (%) 8.11 17.63 37.28 36.98
Notes: DIA: Diagnostic interview for Internet, game, SNS, etc. addiction;M: mean;SD: standard deviation.
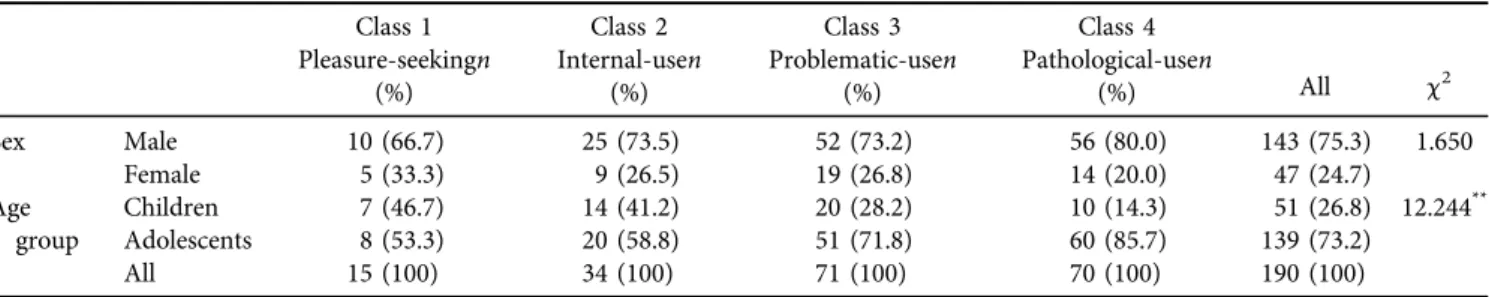
70 (36.98%) in the pathological-use group (Class 4). Each group included significantly more boys than girls; however, the gender differences between groups were statistically non- significant (Table 3). The mean ages were 12.00 (SD53.44) in the pleasure-seeking group, 12.59 (SD 5 2.82) in the internal-use group, 13.18 (SD52.65) in the problematic-use group, and 13.60 (SD51.63) in the pathological-use group.
Thus, age and IGD symptoms were associated. The number of adolescents was significantly higher than that of children in all groups, and the difference in age group by latent class was also significant (c2512.244, p< 0.01).
Clinical characteristics of Internet gaming disorder (IGD) diagnosis groups
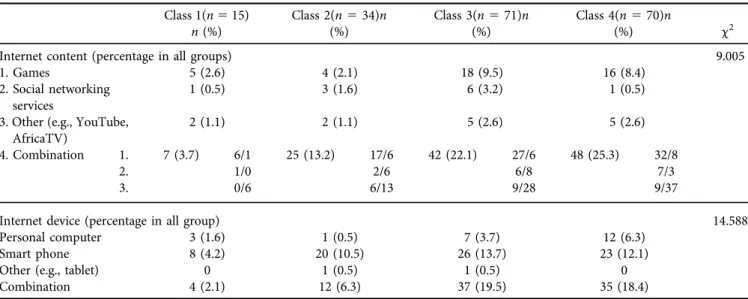
Differences in Internet-usage characteristics and addiction- related variables. Tables 4,5, and6show the differences in the Internet-usage characteristics and addiction-related variables across the latent classes. The differences in the Internet-usage patterns and Internet-enabled devices were not significant. Specifically, most latent classes used the Internet for games and videos (Table 4). While the pleasure- seeking (Class 1) and the internal-use groups (Class 2) tended to use a single smartphone device, the problematic- use (Class 3) and the pathological-use (Class 4) groups tended to use two or more devices.
The age when the participants first started using the Internet, online games, and smartphones was not statistically different per latent class (Table 5). Further, the average
weekday use time was not significantly different between groups (F(3,186)50.959,p50.413); however, the average weekend use time was significantly different (F (3,186) 5 2.917, p < 0.05). On weekdays and weekends, the average Internet use time was the highest for the problematic-use group, followed by the pathological-use, internal-use, and pleasure-seeking groups. Duncan’s post-hoc analyses showed that the average Internet use time for the pleasure- seeking group was 260.44 min, which was lower than the 402.68 min of the problem-use and the 392.31 min of the pathological-use groups.
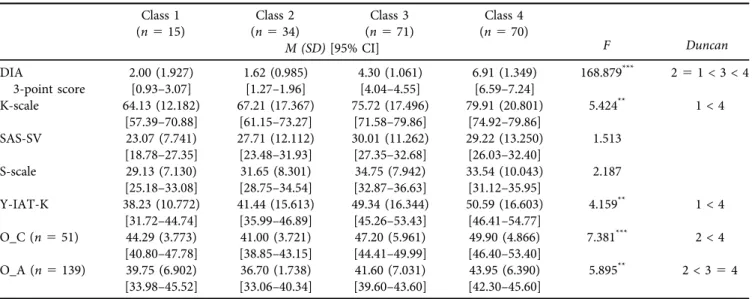
Concerning addiction levels among the four latent clas- ses, significant differences were found for all scales except for the SAS-SV, S-scale (Table 6). Post-hoc analyses revealed that the number of 3-point DIA threshold scores was highest in the problematic-use group (M5 4.30,SD51.061), fol- lowed by the pathological-use group (M 5 6.91, SD 5 1.349). Scores were lower for the internal-use and pleasure- seeking groups than for the problematic-use group; however, the differences between the two groups were non-significant.
The K-scale and the Y-IAT-K scale, which were used to examine participants’ Internet addiction levels, were the highest for the pathological-use group and lowest for the pleasure-seeking group. Parental observers’ scales for chil- dren’s and adolescents’ Internet and smartphone addiction were the lowest in the internal-use group and highest in the pathological-use group.
Differences in psychosocial variables. As shown inTable 7, there were significant differences in adolescents’daily stress (F(3,181)53.397, p< 0.05) and total happiness scores (F (3,180)55.751,p< 0.01), self-concept (F(3,180)55.769,p
< 0.01), family relationships (F (3,180)5 3.991, p < 0.01), leisure activities (F(3,180) 5 4.027,p < 0.01), and depres- sion in adolescents (F (3,132) 5 3.951, p < 0.05), being comparatively higher in the problematic-use and patholog- ical-use groups than in the pleasure-seeking group. Ado- lescents’daily stress levels (DHQ) were significantly higher and happiness levels (Happy) were significantly lower in the pathological-use group than in the pleasure-seeking group.
Self-concept was higher in the pleasure-seeking and inter- nal-use groups than in the pathological-use group; however, the two groups were not statistically different. Family re- lationships were lower in the pathological-use and prob- lematic-use groups than in the pleasure-seeking group;
Fig. 2.Form of four latent classes by DIA item
Table 3.Number of cases for the four latent groups based on DIA items
Class 1 Class 2 Class 3 Class 4
All c2
Pleasure-seekingn (%)
Internal-usen (%)
Problematic-usen (%)
Pathological-usen (%)
Sex Male 10 (66.7) 25 (73.5) 52 (73.2) 56 (80.0) 143 (75.3) 1.650
Female 5 (33.3) 9 (26.5) 19 (26.8) 14 (20.0) 47 (24.7)
Age group
Children 7 (46.7) 14 (41.2) 20 (28.2) 10 (14.3) 51 (26.8) 12.244**
Adolescents 8 (53.3) 20 (58.8) 51 (71.8) 60 (85.7) 139 (73.2)
All 15 (100) 34 (100) 71 (100) 70 (100) 190 (100)
*p< 0.05, **p< 0.01, ***p< 0.001.
DIA: Diagnostic interview for Internet, game, SNS, etc. addiction. Age is ordinary age (Korean age).
however, the difference between the pathological-use and problematic-use groups was non-significant. Leisure activity scores were the highest in the pleasure-seeking group;
however, the differences among the three other groups were non-significant.
Changes at the six-month follow-up. Table 8 shows the results of the correspondence sample t-test regarding the changes in Internet, game, and smartphone addiction symptoms and Internet use after six months. In the plea- sure-seeking group, 10 out of 15 people completed six- month follow-up evaluations, and the 3-point DIA threshold scores and use times were statistically the same over time.
In the internal-use group, 28 out of 34 people completed six-month follow-up evaluations, the 3-point DIA threshold scores and use times remained statistically unchanged.
On the other hand, the problematic-use group showed a significant change in the 3-point DIA threshold scores and average weekend Internet use time. Specifically, when
compared to the 3-point DIA threshold scores and average weekend Internet use at the six-month follow-up, the 3- point DIA threshold scores and average weekend Internet use were significantly higher at baseline (Table 8).
The pathological-use group showed a significant change in the 3-point DIA threshold scores. Specifically, when compared to the 3-point DIA threshold scores at the six- month follow-up, the 3-point DIA threshold scores were significantly higher at baseline. The average weekly and weekend Internet use times of the pathological-use group did not change significantly.
DISCUSSION
This study identified four latent classes of children and ad- olescents who were Internet, gaming, and smartphone users through a semi-structured assessment using the DIA developed by the c-CURE research team. Further, this study Table 4.Internet-usage characteristics of the four latent groups based on DIA items
Class 1(n515) n(%)
Class 2(n534)n (%)
Class 3(n571)n (%)
Class 4(n570)n
(%) c2
Internet content (percentage in all groups) 9.005
1. Games 5 (2.6) 4 (2.1) 18 (9.5) 16 (8.4)
2. Social networking services
1 (0.5) 3 (1.6) 6 (3.2) 1 (0.5)
3. Other (e.g., YouTube, AfricaTV)
2 (1.1) 2 (1.1) 5 (2.6) 5 (2.6)
4. Combination 1. 7 (3.7) 6/1 25 (13.2) 17/6 42 (22.1) 27/6 48 (25.3) 32/8
2. 1/0 2/6 6/8 7/3
3. 0/6 6/13 9/28 9/37
Internet device (percentage in all group) 14.588
Personal computer 3 (1.6) 1 (0.5) 7 (3.7) 12 (6.3)
Smart phone 8 (4.2) 20 (10.5) 26 (13.7) 23 (12.1)
Other (e.g., tablet) 0 1 (0.5) 1 (0.5) 0
Combination 4 (2.1) 12 (6.3) 37 (19.5) 35 (18.4)
DIA: Diagnostic interview for Internet, game, SNS, etc. addiction.
4. Combination: This means that content 1–3 is used as two duals. The left side of / is the primary Internet content and the right side of / is the secondary Internet content in the Internet content-combination.
Table 5.Internet-using behaviors of the four latent groups based on DIA items (N5190) Class 1(n515) Class 2(n534) Class 3(n571) Class 4(n570)
F Duncan
M (SD)[95% CI]
Age whenfirst began using: Internet
6.53 (2.326)
[5.25–7.82] 7.65 (1.704)
[7.05–8.24] 7.41 (1.952)
[6.95–7.88] 7.63 (2.342)
[7.07–8.19] 1.229 Age whenfirst began
using: Internet gaming
7.00 (2.360)
[5.69–8.31] 8.03 (2.263)
[7.24–8.82] 8.20 (2.500)
[7.60–8.80] 8.30 (2.176)
[7.78–8.82] 1.338 Age whenfirst began
using: smartphone
8.40 (2.558)
[6.98–9.82] 8.53 (2.377)
[7.70–9.36] 8.73 (1.841)
[8.29–9.17] 8.64 (2.000)
[8.17–9.12] 0.143 Usage time: weekdays
(min/day)
198.00 (157.444)
[110.81–285.19] 237.94 (164.865)
[180.42–295.47] 260.70 (115.367)
[233.40–288.01] 256.17 (145.644)
[221.44–290.90]) 0.959 Usage time: weekends
(min/day)
264.00 (156.379)
[177.40–350.60] 348.53 (165.971)
[290.62–406.44] 402.68 (171.414)
[362.10–443.25] 392.31 (197.311)
[345.27–439.36] 2.917* 1 < 354
*p< 0.05, **p< 0.01, ***p< 0.001.
DIA: Diagnostic interview for Internet, game, SNS, etc. addiction. Age is ordinary age (Korean age).
examined differences across the latent classes for variables related to Internet, gaming, and smartphone addiction.
We found that the Internet, gaming, and smartphone usage patterns of children and adolescents could be classified into four latent classes: pleasure-seeking group (Class 1:
8.11%), internal-use group (Class 2: 17.63%), problematic- use group (Class 3: 37.28%), and pathological-use group
(Class 4: 36.98%). Using the 3-point DIA threshold scores, the pleasure-seeking (Class 1) and internal-use group (Class 2) were mild-risk groups, the problematic-use group was a moderate-risk group, and the pathological-use group was an addicted group. The moderate-risk and addicted group together accounted for 74.26%— significantly higher than the mild-risk group—which is in contrast with previous Table 6.Internet and smartphone addiction scale of the four groups based on DIA items (N5190)
Class 1 (n515)
Class 2 (n534)
Class 3 (n571)
Class 4 (n570)
F Duncan
M (SD)[95% CI]
DIA
3-point score
2.00 (1.927)
[0.93–3.07] 1.62 (0.985)
[1.27–1.96] 4.30 (1.061)
[4.04–4.55] 6.91 (1.349)
[6.59–7.24] 168.879*** 251 < 3 < 4
K-scale 64.13 (12.182)
[57.39–70.88] 67.21 (17.367)
[61.15–73.27] 75.72 (17.496)
[71.58–79.86] 79.91 (20.801)
[74.92–79.86] 5.424** 1 < 4
SAS-SV 23.07 (7.741)
[18.78–27.35]
27.71 (12.112) [23.48–31.93]
30.01 (11.262) [27.35–32.68]
29.22 (13.250) [26.03–32.40]
1.513
S-scale 29.13 (7.130)
[25.18–33.08]
31.65 (8.301) [28.75–34.54]
34.75 (7.942) [32.87–36.63]
33.54 (10.043) [31.12–35.95]
2.187
Y-IAT-K 38.23 (10.772)
[31.72–44.74] 41.44 (15.613)
[35.99–46.89] 49.34 (16.344)
[45.26–53.43] 50.59 (16.603)
[46.41–54.77] 4.159** 1 < 4 O_C (n551) 44.29 (3.773)
[40.80–47.78] 41.00 (3.721)
[38.85–43.15] 47.20 (5.961)
[44.41–49.99] 49.90 (4.866)
[46.40–53.40] 7.381*** 2 < 4 O_A (n5139) 39.75 (6.902)
[33.98–45.52] 36.70 (1.738)
[33.06–40.34] 41.60 (7.031)
[39.60–43.60] 43.95 (6.390)
[42.30–45.60] 5.895** 2 < 354
*p< 0.05, **p< 0.01, ***p< 0.001.
DIA: Diagnostic interview for Internet, game, SNS, etc. addiction; K-scale: Korean Scale for Internet Addiction for adolescents; SAS-SV:
Smartphone Addiction Scale-short form version; S-scale: Korean Smartphone Addiction scale; O_C: Internet Addiction Proneness Scale for Child, checked by caregivers; O_A: Internet Addiction Proneness Scale for Adolescents, checked by caregivers.
Table 7.Psychosocial variable of the four groups based on DIA items (N5190) Class 1(n515) Class 2(n534) Class 3(n571) Class 4(n570)
F Duncan
M (SD)[95% CI]
CDI(n551) 13.00 (4.726)[8.63–
17.37]
12.50 (7.346)[8.26–
16.74]
10.68 (5.067)[8.24–
13.13]
14.70 (8.667)[8.50–
20.90]
0.864 BDI-Ⅱ(n5139) 4.25 (4.166)[0.77–
7.73]
9.15 (9.675)[4.62–
13.68]
16.10 (12.701)
[12.49–19.71] 15.83 (12.148)
[12.63–19.02] 3.951* 1 < 3, 4
BIS-Ⅱ 53.57 (11.359)
[47.01–60.13] 52.44 (7.110)
[49.96–54.92] 56.38 (11.140)
[53.70–59.05] 56.53 (9.764)
[54.17–58.89] 1.645
AQ 58.57 (17.531)
[48.45–68.69] 56.76 (10.462)
[53.11–60.42] 60.39 (15.267)
[56.66–64.11] 62.38 (18.300)
[57.95–66.81] 1.001
DHQ 58.36 (14.913)
[49.75–66.97] 60.24 (16.644)
[54.43–66.04] 68.41 (17.402)
[64.23–72.59] 69.95 (18.903)
[65.07–74.22] 3.397* 1 < 4 Happiness: total 66.14 (13.444)
[58.38–73.91] 60.44 (14.262)
[55.46–65.42] 54.84 (14.601)
[51.33–58.35] 50.79 (16.214)
[46.84–54.75] 5.751** 4 < 1 Happiess: self-concept 24.21 (6.693)
[20.35–28.08] 23.79 (5.897)
[21.74–25.85] 20.70 (6.680)
[19.09–22.30] 18.58 (7.320)
[16.80–20.37] 5.769** 4 < 2, 1 Happiness: family
relationships
24.14 (5.503) [20.97–27.32]
21.26 (7.296) [18.72–23.81]
18.87 (6.526) [17.30–20.44]
18.15 (7.099) [16.42–19.88]
3.991* 4, 3 < 1 Happiness: leisure
activities
9.50 (2.029)[8.33–
10.67]
7.88 (2.240)[7.10–
8.66]
7.72 (2.733)[7.07–
8.38]
7.09 (2.248)[6.54–
7.64]
4.027* 4, 3, 2 < 1 Happiness: friendship 8.29 (1.858)[7.21–
9.36]
7.50 (2.585)[6.60–
8.40]
7.55 (2.862)[6.86–
8.24]
6.97 (2.674)[6.32–
7.62]
1.170
*p< 0.05, **p< 0.01, ***p< 0.001.
DIA: Diagnostic interview for Internet, game, SNS, etc. addiction; CDI: Children Depression Inventory; BDI-II: Beck Depression Inventory- II; BIS-II: Barratt Impulsiveness Scale-II; AQ: Aggression Questionnaire; DHQ: Daily Hassles Questionnaire; Happy: Happiness index of Korean adolescents.M: mean,SD: standard deviation.
studies reporting only 20–30% of the participants to be problematic users (Kwon & Kwon, 2017;Wang et al., 2018).
However, this study’s data were collected through a clinical cohort study, where only participants who exceeded the cutoff criteria for self-reported addiction were included.
Using the DSM-5 diagnostic criteria for IGD and ICD-11 diagnostic criteria for GD, we found that the IGD group accounted for 32.4%, and the GD group accounted for 6.4%
(Jo et al., 2019), suggesting that the pathological-use group (Class 4) is a high-risk group for Internet, gaming, and smartphone addiction. The IGD of DSM-5 and GD of ICD- 11 were proposed for the diagnostic criteria, but did not include the severity criteria (APA, 2013;WHO, 2019). The four latent classes can be interpreted as the severity of symptoms caused by the use of the Internet, games, and smartphones, providing clinical implications.
When examining each latent class and the characteris- tics of addiction-related variables, the pleasure-seeking group (Class 1) showed slightly higher levels of“difficulty regulating use” and “persistent use despite negative con- sequences.” Consistent with this, the average Internet, gaming, and smartphone use time was the lowest in this group, and the 3-point DIA threshold score was relatively lower compared to the other groups. This group was experiencing the joy of use. The internal-use group (Class 2) showed significantly higher levels of“cognitive salience,”
“craving,”and a slight increase in“deceiving.”This group had internal desires rather than displaying outward be- haviors. Their average weekday/weekend Internet use was
the second lowest, next to that of the pleasure-seeking group (Class 1).
The addiction-related scales, self-reported by children and adolescents, were the lowest among the pleasure-seeking group, whereas the observer’s scale of addiction was higher than that of the internal-use group (Class 2). It was the opposite for the internal-use group (Class 2). The DIA point threshold level also showed less variation and a lower level than the pleasure-seeking group (Class 1), suggesting that the caregivers may have strict standards, such as supervising Internet, games, and smartphones use (Park & Noh, 2019), even though the pleasure-seeking group’s (Class 1) use was comparable to their peers. As the internal-use group (Class 2) primarily had internal desires, their responses to items about behavioral aspects were lower than the pleasure- seeking group (Class 1), indicating that internal desires may not lead to actual behaviors. In other words, the “denial” defense mechanism, a characteristic of addiction, may have been involved (Pickard, 2016). In addition, caregivers may not have noticed usage problems as their children’s/adoles- cents’internal desires were not visible.
The problematic-use group (Class 3) scored 0 on the item “inference with role performance”; however, they showed significantly higher levels of “difficulty regulating use”and“persistent use despite negative consequences.”The pathological-use group (Class 4) showed the most increase across all three items and scored the highest among the groups on other items. The 3-point DIA threshold scores for these groups were high with mean weekend use being Table 8.Comparison of DIA threshold scores and use time of the four latent groups over time
Variable M SD T df
Pleasure-seeking (Class 1)n510 DIA 3-point score Baseline 1.40 1.776 0.885 9
6 mo. FU 1.00 1.563
Usage time: weekdays (min/day) Baseline 195.00 177.904 0.546 6 mo. FU 208.50 215.691
Usage time; weekend (min/day) Baseline 258.00 171.581 0.499 6 mo. FU 243.00 202.707
Internal-use (Class 2)n528 DIA 3-point score Baseline 1.64 1.026 0.112 27
6 mo. FU 1.68 1.588
Usage time: weekdays (min/day) Baseline 222.50 163.018 1.501 6 mo. FU 181.43 121.067
Usage time: weekend (min/day) Baseline 326.79 165.598 1.907 6 mo. FU 258.21 154.777
Problematic-use (Class 3)n543 DIA 3-point score Baseline 4.37 1.113 4.896*** 42
6 mo. FU 2.93 1.82
Usage time: weekdays (min/day) Baseline 246.43 113.327 1.836 6 mo. FU 206.90 140.634
Using time: weekend (min/day) Baseline 396.43 151.606 2.464* 6 mo. FU 324.05 182.370
Pathological-use (Class 4)n548 DIA 3-point score Baseline 6.90 0.994 7.292*** 47
6 mo. FU 4.25 2.410
Usage time: weekdays (min/day) Baseline 249.39 156.104 0.195 6 mo. FU 245.61 137.271
Using time: weekend (min/day) Baseline 381.43 198.148 0.114 6 mo. FU 377.76 217.471
*p< 0.05, **p< 0.01, ***p< 0.001.
DIA: Diagnostic interview for Internet, game, SNS, etc. addiction,M: mean,SD: standard deviation, FU: follow-up.
significantly higher than in the pleasure-seeking group (Class 1). In other words, because of excessive use, the problematic-use group (Class 3) showed some functional impairment, and the problematic behaviors were manifest- ing externally. The pathological-use group (Class 4) showed severe functional impairment displaying external problem- atic behaviors as well as internal desires. The problematic- use group (Class 3) showed a higher ratio of using a single smartphone device or using two devices by pairing a smartphone with a personal computer or tablet. In addition, their average weekday/weekend Internet use was higher than the pathological-use group (Class 4) and the highest of all four groups. Further, the problematic-use group (Class 3) had the highest scores on the smartphone addiction-related scales. We posit that the problematic-use group (Class 3) began to show problematic behaviors owing to ease of access to their smartphones.
As for the gender characteristics, there was no statisti- cally significant difference among classes, but considering the characteristics of the study participants who show more game use problems, there is a higher frequency of boys than girls in the group with high severity (Table 3). Previous studies also show that boys report the game use problem more frequently than girls, whereas girls have more social network service (SNS) use problems (Dufour et al., 2016;
Kuss, Griffiths, Karila, & Billieux, 2013;Stavropoulos et al., 2018). When children and adolescents were compared ac- cording to age, the frequency of adolescents increased significantly as the severity of use problems increased (Ta- bles 2 and 3). As adolescents tend to pursue their private needs, they appear to be at a relatively high risk of devel- oping Internet addiction (Stavropoulos et al., 2018). In this study, we cannot conclude that the characteristics of the four groups explain the development of the use problem, but we can assume that the severity of Internet, game, and smart- phone addiction problems increases with age.
Concerning the differences in psychosocial variables between latent classes, the pleasure-seeking group (Class 1) had the lowest level of depression and daily stress and the highest level of happiness. Self-concept, family relationships, and leisure activities—sub-factors of the adolescent happi- ness index—were all significantly higher than other groups.
On the other hand, the pathological-use group (Class 4) showed the highest levels of depression and daily stress and lowest levels of happiness compared to the pleasure-seeking group (Class 1). This is consistent with previous studies (Jo et al., 2019; Kim & Yu, 2017; Lee et al., 2018b, 2018a; Liu et al., 2018;Muusses et al., 2014;Park & Jo, 2018;Ryu et al., 2019; Wang et al., 2018). Depression and stress were risk factors for problematic use of the Internet, games, and smartphones, whereas happiness (including self-concept), family relationships, and leisure activities were protective factors. The internal-use group (Class 2) had the highest happiness index related to self-concept, similar to the plea- sure-seeking group (Class 1). Leisure activities were the lowest; similar to the problematic-use (Class 3) and patho- logical-use (Class 4) groups. This implies that the internal- use group (Class 2) may only have internal desires for the
use of Internet, games, and smartphones, showing no out- ward functional impairment; however, they may transition to the problematic-use group if the condition persists.
Therefore, participants in the internal-use group (Class 2) should not be overlooked.
Depression levels were significant only among adolescents (Class 1<Classes 3 and 4). Adolescents cope with physical, emotional, and behavioral changes, and experience a variety of adaptation challenges (Achenbach & Edelbrock, 1983).
Adolescents, rather than children, have severe mood swings and emotional instability, and are subjected to full-scale ac- ademic stress because of the environmentally oriented edu- cation system and competitive school atmosphere.
Consequently, children and adolescents spend their leisure time playing games or watching videos, which can be accessed easily and do not take much time (Kim & Yu, 2017).
Therefore, teenagers and children should be encouraged to engage in leisure activities other than the Internet, gaming, and smartphones, for which a supportive environment should be created (Chung, Lee, Lee, & Lee, 2017).
Concerning the six-month follow-up, the overall levels of addiction and use decreased. In this c-CURE study, after the baseline evaluation, the psychiatrists explained the evalua- tion results and briefly provided face-to-face counseling on parenting and the use of Internet, games, and smartphones.
By conducting three- and six-month face-to-face follow-up evaluations, participants could monitor their own Internet, gaming, and smartphone usage patterns and self-manage their behaviors with encouragement and advice from clinical psychologists. This seems to have worked as a short-term education and counseling intervention. Specifically, the 3- point DIA threshold scores showed a significant reduction in the problematic-use (Class 3) and pathological-use (Class 4) groups. The average weekday/weekend Internet use of the problematic-use group (Class 3) significantly decreased, whereas the average Internet use time of the pathological- use group (Class 4) remained statistically the same as baseline. The average weekday/weekend Internet use time of the internal-use group did not decrease significantly. For the problematic-use (Class 3) and internal-use (Class 2) groups, we posit that the problematic tendencies in Internet, gaming, and smartphone usage could be addressed to prevent po- tential- or high-risk users by proactively identifying future problems and providing short-term psychoeducation (Park, Jon, Hong, Jung, & Hong, 2017;Park, & Noh, 2019;Yang, &
Kim, 2018). Guidelines on use of Internet, games, and smartphones are needed to cultivate healthy use habits as a primary prevention and intervention for high-risk groups.
Furthermore, a community-based prevention system providing psychological services and education on these matters is needed in the community (Chung et al., 2017).
Although the 3-point DIA threshold scores decreased in the pathological-use group (Class 4), their Internet, gaming, and smartphone use remained constant, suggesting that the symptoms were temporarily alleviated. Addiction symptoms are difficult to treat at once, as they tend to worsen over time, or may relapse after recovery (Marlatt & Gordon, 1980). One study reported that two-thirds of 367 patients
with IGD, who had completed a 5-year follow-up, received cognitive behavioral therapy for IGD, and medicated for comorbid conditions for eight weeks, did not fully recover and experienced ongoing difficulties (Han, Yoo, Renshaw, &
Petry, 2018). Therefore, the pathological-use group (Class 3), a high-risk group, may require extensive intervention, including basic psychoeducation, cognitive behavioral ther- apy, coexisting disease treatment, and drug treatment (Kim et al., 2018;Young, 2007). There is also a need for a long- term, therapeutic approach over a sufficient period, rather than a one-time, short-term therapeutic intervention. In other words, it is necessary to apply differentiated inter- vention methods and establish a dual intervention system depending on the Internet, gaming, and smartphone usage patterns of children and adolescents.
This study included only those who exceeded the screening threshold, and did not include a typical compar- ison group. Further, the sample size comprised only 190 participants, and the ratios of children to adolescents and girls to boys were about 1:3. Therefore, further research with more participants who are gender- and age-matched is required. Additionally, an extended follow-up could identify the patterns of change for each class, which could improve differentiation strategies.
This study provided data on the patterns of Internet, gaming, and smartphone overuse in children and adoles- cents by identifying characteristics of four latent classes using clinical cohort data. The results can be useful to develop differentiated intervention strategies according to the usage patterns of children and adolescents.
Funding Sources:This work was supported by a grant from the Korea Healthcare Technology R&D Project, Ministry for Health and Welfare, Republic of Korea (HM14C2603).
Authors’contribution:Y.S.K and Y.S.J designed the study and Y.S.J., Y.S.K., S.Y.B., J.S.C. designed the protocol. Y.S.J per- formed statistical analysis and interpretation of data. Y.S.J. and Y.S.K. wrote the first draft of the manuscript. Y.S.K., S.Y.B., J.S.C., H.K.L., and S.Y.L provided study supervision. Y.S.K.
managed the entire study process. All authors contributed to and have approved the final manuscript.
Conflict of interests: The authors declare no conflicts of in- terest with respect to the content of the manuscript.
REFERENCES
Aarseth, E., Bean, A. M., Boonen, H., Colder Carras, M., Coulson, M., Das, D. (2017). Scholars’open debate paper on the World health organization ICD-11 gaming disorder proposal.Journal of Behavioral Addictions, 6(3), 267–270. https://doi.org/10.
1556/2006.5.2016.088.
Achenbach, T. M., & Edelbrock, C. S. (1983).Manual for the child behavior checklist and revised child behavior profile. Burlington, VT, USA: University of Vermont, Department of Psychiatry.
Akaike, H. (1987). Factor analysis and AIC.Psychometrika,52(3), 317–332.https://doi.org/10.1007/BF02294359.
American Psychiatric Association. (2013).Diagnostic and statistical manual of mental disorders (DSM-5. Arlington, VA, USA:
American Psychiatric Publishing.
Bang, S. Y., Lee, H. K., Cho, S. S., Choi, S., Ryu, C. S., & Kim, B. H.
(2007).Korean youth happiness index development and research report. Seoul, Korea: Happy Home Foundation.
Barratt, E. S., & White, R. (1969). Impulsiveness and anxiety related to medical students’ performance and attitudes. Journal of Medical Education, 44(7), 604–607. https://doi.org/10.1097/
00001888-196907000-00007.
Beck, A. T., Steer, R. A., & Brown, G. K. (1996).Beck depression inventory-II (BDI-II). San Antonio, TX, USA: Psychological Corporation.
Buss, A. H., & Perry, M. (1992). The aggression questionnaire.
Journal of Personality and Social Psychology, 63(3), 452–459.
https://doi.org/10.1037/0022-3514.63.3.452.
Cho, S. C., & Lee, Y. S. (1999). Development of the Korean form of the Kovacs’children’s depression inventory.Journal of Korean Neuropsychiatric Association,29(4), 943–956.
Chung, S. K., Lee, J. K., Lee, S. Y., & Lee, S. B. (2017). Factors influencing Internet addiction among Korean college students based on the public health model.Alcohol and Health Behavior Research, 18(2), 59–77. https://doi.org/10.1556/2006.5.2016.
088.
Deleuze, J., Rochat, L., Romo, L., Van der Linden, M., Achab, S., Thorens, G. (2015). Prevalence and characteristics of addictive behaviors in a community sample: A latent class analysis.
Addictive Behaviors Reports,1, 49–56.https://doi.org/10.1016/j.
abrep.2015.04.001.
Dufour, M., Brunelle, N., Tremblay, J., Leclerc, D., Cousineau, M.
M., Khazaal, Y. (2016). Gender difference in internet use and internet problems among Quebec high school students.Cana- dian Journal of Psychiatry,61(10), 663–668.https://doi.org/10.
1177/0706743716640755.
Han, M. H., & Yoo, A. J. (1995). Development of daily hassles scale for children in Korea.Journal of the Korean Home Economics Association,33(4), 49–64.
Han, D. H., Yoo, M., Renshaw, P. F., & Petry, N. M. (2018). A cohort study of patients seeking internet gaming disorder treatment. Journal of Behavioral Addictions, 7(4), 930–938.
https://doi.org/10.1556/2006.7.2018.102.
Jo, Y. S., Bhang, S. Y., Choi, J. S., Lee, H. K., Lee, S. Y., & Kweon, Y.
S. (2019). Clinical characteristics of diagnosis for internet gaming disorder: Comparison of DSM-5 IGD and ICD-11 GD Diagnosis.Journal of Clinical Medicine, 8(7), 945. https://doi.
org/10.3390/jcm8070945.
Jung, T., & Wickrama, K. A. S. (2008). An introduction to latent class growth analysis and growth mixture modeling.Social and Personality Psychology Compass,2(1), 302–317.https://doi.org/
10.1111/j.1751-9004.2007.00054.x.
Kim, D. I., Chung, Y. J., Lee, Y. H., Kim, B. K., & Jeon, H. J. (2016).
Development and validation of youth smartphone addiction self-report scale.Korean Journal of Counseling,17(3), 319–335.
https://doi.org/10.15703/kjc.17.3.201606.319.
Kim, D. I., Chung, Y. J., Lee, Y. H., Kim, B. K., Jeon, H. J., & Lee, Y.
H. (2015). Development and validation of child smartphone
addiction observer scale.Korean Journal of Counseling, 16(6), 369–383.https://doi.org/10.15703/kjc.16.6.201512.369.
Kim, E., Lee, S., & Oh, S. (2003). The validation of Korean adolescent Internet addiction scale (K-AIAS).Korean Journal of Clinical Psychology,22, 125–139.
Kim, S. H., Yim, H. W., Jo, S. J., Jung, K. I., Lee, K., & Park, M. H.
(2018). The effects of group cognitive behavioral therapy on the improvement of depression and anxiety in adolescents with problematic Internet use. Journal of the Korean Academy of Child and Adolescent Psychiatry,29(2), 73–79.https://doi.org/
10.5765/jkacap.2018.29.2.73.
Kim, H. S., & Yu, K. L. (2017). An ecological, meta-analytic path analysis of variables related to Internet addiction in adolescents.
Korean Journal of Counseling and Psychotherapy,29(3), 659–
687.https://doi.org/10.23844/kjcp.2017.08.29.3.659.
Korean National Information Society Agency. (2011).Third stan- dardization of Korean Internet addiction proneness scale, NIA IV-RER-11050. Seoul, South Korea: Korean National Informa- tion Society Agency.
Korean National Information Society Agency. (2013).A validation study of K-scale as a diagnostic tool. Seoul, South Korea: Korean National Information Society Agency.
Kovacs, M. (1983).The children’s depression inventory: A self-rated depression scale for school-aged youngsters. Unpublished Manuscript. Pittsburgh, PA, USA: University of Pittsburgh.
Kuss, D. J., Griffiths, M. D., Karila, L., & Billieux, J. (2013). Internet addiction: A systematic review of epidemiological research for the last decade.Current Pharmaceutical Design,1(4), 397–413.
Kuss, D. J., Griffiths, M. D., & Pontes, H. M. (2017a). Chaos and confusion in DSM-5 diagnosis of internet gaming disorder:
Issues, concerns, and recommendations for clarity in thefield.
Journal of Behavioral Addictions,6(2), 103–109.https://doi.org/
10.1556/2006.5.2016.062.
Kuss, D. J., Griffiths, M. D., & Pontes, H. M. (2017b). DSM-5 diagnosis of internet gaming disorder: Some ways forward in overcoming issues and concerns in the gaming studies field.
Journal of Behavioral Addictions,6(2), 133–141.https://doi.org/
10.1556/2006.6.2017.032.
Kwon, M., Kim, D.-J., Cho, H., & Yang, S. (2013). The smartphone addiction scale: Development and validation of a short version for adolescents. PloS One, 8(12), e83558. https://doi.org/10.
1371/journal.pone.0083558.
Kwon, H. S., & Kwon, K. I. (2017). Study on the developmental steps of adolescent gaming addiction according to the level of engagement and addiction: Separating steps: Through latent class analysis and the role of related variables.Korean Journal of Youth Counseling, 25(1), 155–175. https://doi.org/10.35151/
kyci.2017.25.1.008.
Lee, H. (1992).Impulsivity test scale. Seoul, South Korea: Guidance Korea.
Lee, S. Y., Lee, H. K., Bang, S. Y., Jeong, H., Yim, H. W., & Kweon, Y. S. (2018b). Aggression and harm-avoidant trait impede re- covery from internet gaming disorder.Frontiers in Psychiatry, 9, 263.https://doi.org/10.3389/fpsyt.2018.00263.
Lee, E.-H., Lee, S.-J., Hwang, S.-T., Hong, S.-H., & Kim, J.-H.
(2017). Reliability and validity of the beck depression in- ventory-II among Korean adolescents.Psychiatry Investigation, 14(1), 30–36.https://doi.org/10.4306/pi.2017.14.1.30.
Lee, S. Y., Lee, D., Nam, C. R., Kim, D. Y., Park, S., Kwon, J. G.
(2018a). Distinct patterns of Internet and smartphone-related problems among adolescents by gender: Latent class analysis.
Journal of Behavioral Addictions,7(2), 454–465.https://doi.org/
10.1556/2006.7.2018.28.
Liu, L., Yao, Y. W., Li, C. R., Zhang, J. T., Xia, C. C., Lan, J.
(2018). The comorbidity between internet gaming disorder and depression: Interrelationship and neural mechanisms.
Frontiers in Psychiatry, 9, 154. https://doi.org/10.3389/fpsyt.
2018.00154.
Lo, Y., Mendenll, N. R., & Rubin, D. B. (2001). Testing the number of components in a normal mixture. Biometrika,88(3), 767–
778.https://doi.org/10.1093/biomet/88.3.767.
Magnusson, D. (2003). The person approach: Concepts, measure- ment models, and research strategy. New Directions for Child and Adolescent Development,101(2003), 3–23.https://doi.org/
10.1002/cd.79.
Marlatt, G. A., & Gordon, J. R. (1980). Determinants of relapse:
Implications for the maintenance of behavior change. In P. O.
Davidson & S. M. Davidson (Eds.), Behavioral medicine:
Changing health lifestyles(pp. 410–452). New York, NY, USA:
Brunner/Mazel.
McLachlan, G. J., & Peel, D. (2000).Finite mixture models. New York, NY, USA: Wiley.https://doi.org/10.1002/0471721182.
Meyer, J. P., & Morin, A. J. S. (2016). A person‐centered approach to commitment research: Theory, research, and methodology.
Journal of Organizational Behavior,37(4), 584–612.https://doi.
org/10.1002/job.2085.
Muthen, B. (2004).The sage handbook of quantitative methodology for the social sciences(pp. 345–368). Thousand Oaks, CA, USA:
Sage Publications.
Muthen, B., & Muthen, L. K. (2000). Integrating person‐centered and variable‐centered analyses: Growth mixture modeling with latent trajectory classes.Alcoholism: Clinical and Experimental Research, 24(6), 882–891. https://doi.org/10.1111/j.1530-0277.
2000.tb02070.x.
Muusses, L. D., Finkenauer, C., Kerkhof, P., & Billedo, C. J. (2014).
A longitudinal study of the association between compulsive Internet use and wellbeing.Computers in Human Behavior,36, 21–28.https://doi.org/10.1016/j.chb.2014.03.035.
Nylund, K. L., Asparouhov, T., & Muthen, B. O. (2007). Deciding on the number of classes in latent class analysis and growth mixture modeling: A Monte Carlo simulation study.Structural Equation Modeling, 14(4), 535–569. https://doi.org/10.1080/
10705510701575396.
Park, S.-G., & Jo, H. S. (2018). The relationship between happiness, depression and smart phone addiction. Korean Journal of Health Psychology,23(4), 1095–1102.https://doi.org/10.17315/
kjhp.2018.23.4.014.
Park, M. S., Jon, D. I., Hong, H. J., Jung, M. H., & Hong, N. (2017).
The effect of the internet addiction prevention program.Korean Association of Social Psychiatry,22(2), 84–90.
Park, S. M., Kim, E. H., & Kang, M. C. (2013). Latent profile analysis and related factors of Internet addiction in adolescents.
Korean Journal of Counseling, 14(5), 2987–3002. https://doi.
org/10.15703/kjc.14.5.201310.2987.
Park, S. M., & Lee, J. Y. (2018). Analysis of latent profiles and influencing factors on adolescents’ internet game addiction.
Korean Journal of Counseling,19(6), 203–224.https://doi.org/
10.15703/kjc.19.6.201812.203.
Park, B. K., & Noh, J. U. (2019). Effects of parenting behaviors and children’s happiness on media device addiction.Korean Journal of Child Studies, 40(3), 87–103. https://doi.org/10.5723/kjcs.
2019.40.3.87.
Pickard, H. (2016). Denial in addiction.Mind & Language,31(3), 277–299.https://doi.org/10.1111/mila.12106.
Ramaswamy, V., DeSarbo, W., Reibstein, D., & Robinson, W.
(1993). An empirical pooling approach for estimating market- ing mix elasticities with PIMS data.Marketing Science,12(1), 103–124.https://doi.org/10.1287/mksc.12.1.103.
Rost, J. (2006). Latent class analyses. In F. Petermann & M. Eid (Eds.), Handbook of psychological assessment (pp. 275–287).
Gottingen, Germany: Hogrefe.
Rowlison, R. T., & Felner, R. D. (1988). Major life events, hassles, and adaptation in adolescence: Confounding in the conceptu- alization and measurement of life stress and adjustment revis- ited.Journal of Personality and Social Psychology,55(3), 432–
444.https://doi.org/10.1037/0022-3514.55.3.432.
Rumpf, H. J., Achab, S., Billieux, J., Bowden-Jones, H., Carragher, N., Demetrovics, Z. (2018). Including gaming disorder in the ICD-11: The need to do so from a clinical and public health perspective. Journal of Behavioral Addictions, 7(3), 556–561.
https://doi.org/10.1556/2006.7.2018.59.
Ryu, H., Lee, J. Y., Choi, A., Chung, S. J., Park, M., Bhang, S. Y.
(2019). Application of diagnostic interview for internet addic- tion (DIA) in clinical practice for Korean adolescents.Journal of Clinical Medicine, 8(2), 202. https://doi.org/10.3390/
jcm8020202.
Schwarz, G. (1978). Estimating the dimension of a model.
Annals of Statistics,6(2), 461–464.https://doi.org/10.1214/aos/
1176344136.
Sclove, S. L. (1987). Application of model-selection criteria to some problem in multivariate analysis. Psychometrika, 52(3), 333–
343.https://doi.org/10.1007/BF02294360.
Seo, S., & Kwon, S. (2002). Validation study of the Korean version of the aggression questionnaire. Korean Journal of Clinical Psychology,21(2), 487–501.
Stavropoulos, V., Griffiths, M. D., Burleigh, T. L., Kuss, D. J., Doh, Y. Y., & Gomez, R. (2018) Flow on the internet: A longitudinal study of internet addiction symptoms during adolescence.
Behaviour & Information Technology,37(2), 159–172. https://
doi.org/10.1080/0144929X.2018.1424937.
VandenBrink, W. (2017). ICD-11 gaming disorder: Needed and just in time or dangerous and much too early? Journal of Behavioral Addictions, 6(3), 290–292. https://doi.org/10.1556/
2006.6.2017.040.
Vermunt, J., & Magidson, J. (2002). Latent class cluster Analysis.
In J. Hagenaars & A. McCutcheon (Eds.), Applied latent class analysis(pp. 89–106). Cambridge, MA, USA: Cambridge University Press. https://doi.org/10.1017/CBO978051 1499531.004.
Wang, H. R., Cho, H., & Kim, D. J. (2018). Prevalence and cor- relates of comorbid depression in an on clinical online sample with DSM-5 internet gaming disorder. Journal of Affective Disorders,226, 1–5.https://doi.org/10.1016/j.jad.2017.08.005.
World Health Organization [WHO]. (2014). Public health impli- cations of excessive use of the Internet, computers, smartphones and similar electronic devices meeting report. Tokyo, Japan:
World Health Organization.
World Health Organization [WHO]. (2016).Print versions for the ICD-11 beta draft (mortality and morbidity statistics). Geneva, Switzerland: World Health Organization.
World Health Organization [WHO]. (2019). International statis- tical classification of diseases and related health problems (ICD- 11): New release.Geneva, Switzerland: World Health Assembly.
Retrieved from https://www.who.int/news-room/detail/25-05- 2019-world-health-assembly-update.
Yang, S. Y., & Kim, H. S. (2018). Effects of a prevention program for Internet addiction among middle school students in South Korea. Public Health Nursing,35(3), 246–255. https://doi.org/
10.1111/phn.12394.
Young, K. S. (1998). Internet addiction: The emergence of a new clinical disorder.CyberPsychology and Behavior,1(3), 237–244.
https://doi.org/10.1089/cpb.1998.1.237.
Young, K. S. (2007). Cognitive behavior therapy with internet ad- dicts: Treatment outcomes and implications. CyberPsychology and Behavior,10(5), 671–679.https://doi.org/10.1089/cpb.2007.
9971.
Yu, S., & Sussman, S. (2020). Does smartphone addiction fall on a continuum of addictive behaviors?. International Journal of Environmental Research and Public Health,17(2), 1–21.https://
doi.org/10.3390/ijerph17020422.
Open Access statement.This is an open-access article distributed under the terms of the Creative Commons Attribution-NonCommercial 4.0 International License (https://creativecommons.org/licenses/by-nc/4.0/), which permits unrestricted use, distribution, and reproduction in any medium for non-commercial purposes, provided the original author and source are credited, a link to the CC License is provided, and changes–if any–are indicated.