Vacuum 175 (2020) 109270
Available online 17 February 2020
0042-207X/© 2020 The Authors. Published by Elsevier Ltd. This is an open access article under the CC BY-NC-ND license
(http://creativecommons.org/licenses/by-nc-nd/4.0/).
Tracing fcc iron in oxide dispersion strengthened steel by photoelectron emission, M ossbauer spectroscopy, and X-ray diffraction €
G. Pet o }
a, I. D � ezsi
b, L.F. Kiss
b, Z.E. Horv � ath
a, D. Oszetzky
b, A. Nagy
b, G. Moln � ar
a, Cs.
S. Dar � oczi
a,*, K. Frey
a, A. Horv � ath
aaCentre for Energy Research (EK), H-1121, Budapest, Konkoly-Thege M. út 29-33, Hungary
bWigner Research Centre for Physics, H-1121, Budapest, Konkoly-Thege M. út 29-33, Hungary
A B S T R A C T
The crystal structure, the magnetic properties, and the valence band density of states of an oxide dispersion strengthened (ODS) steel with nominal composition of Fe–18%Cr–13%Ni-2.5%Mo-3.2%Si-0.1%C þ1 wt% Y2O3 was investigated applying volumetric and surface sensitive methods. The sample volume contained majority fcc and minority bcc phases according to XRD and volumetric magnetic measurements, while the top layer of the grains contained only the paramagnetic fcc phase, revealed by conversion electron M€ossbauer spectrometry (CEMS) and by photoelectron measurements. The valence band photoelectron emission spectra reflected well the average distribution of the theoretically expected DOS, however, there were no signs of abrupt peaks in the region of 0–4 eV below the Fermi level that could have been attributed to 3d Fe states (bcc phase). It was demonstrated that the photoelectron emission can be utilized to distinguish the Fe atoms located in different crystallographic structures. The valence band data of the ODS steel was compared to that of originating from a bcc iron based magnetic alloy.
1. Introduction
The oxide dispersion strengthened (ODS) ferritic steels have attrac- ted attention as possible applicants in current fast nuclear reactors and in future fusion reactors [1], because they have excellent corrosion resistance, superior tensile and fatigue strength at elevated temperatures [2,3], and very good neutron irradiation tolerance [4]. Other important applications are heat exchange tubing, high temperature turbines blades, and the protecting surface of spacecrafts. In these cases the high temperature tolerance combined with the possible best resistance against the mechanical stress and wear are the key factors. When used as protecting surface in space, in order to reduce mass, the whole net thickness of the ODS steel has to be relatively thin because the physical characteristics of the top layer have emphasized importance. The sandwich structure itself represents a method to increase the surface/- volume ratio of the outer wall e. g., in the case a spacecraft. The wall has to show damage tolerance against the radiation and the outer debris.
The mechanical strengthening of ODS steels is the consequence of the homogeneously dispersed nano-size oxide particles in the steel matrix [5]. The thermal resistance of these materials (their stability and possible changes due to a heat load) have also primary importance. The systematic investigations on 14%Cr-ODS ferritic steels show that the annealing leads to finer and more homogeneous dispersion of the oxide particles with improved mechanical properties. The grain size remains
stable below 800 �C, while at higher temperatures the grains start to grow [6,7]. These structural changes are accompanied by altered mag- netic properties too, such as coercive field (Hc), remanent magnetization (Mr), and magnetostriction [6,8–11] measured at room temperature.
These magnetic properties, especially the magnetization and the magnetostriction are closely related to the local chemical environment and the electronic structure (Density Of States, DOS) of the Fe and Cr atoms. This structural changes may be followed by means of Mossbauer € and XPS photoelectron spectroscopies [12,13].
According to the basic microstructure of the ODS steels the Fe and Fe–Cr grains are closely surrounded by the dispersed yttrium-oxide particles. This inhibits the movement of the dislocations and the diffu- sion processes between the grains. The extrusion process strongly affects the precipitation of the oxide particles and their dispersion, consolidated via suitable hot isostatic pressure and additional heat treatments [5,14].
Because of the nano sized oxide particles are responsible for the improved mechanical and thermal properties, it can be expected that any change in their distribution may lead to altered properties, espe- cially in the proximity of the surface. The altered quality of the surface of the ODS steels may play very important role in corrosion processes. In order to test if there is a difference between the surface and the bulk properties, we decided to compare the results of volumetric and surface sensitive methods.
It is well known that according to the XRD pattern analysis a slight
* Corresponding author.
E-mail address: daroczi.csaba.sandor@energia.mta.hu (Cs.S. Dar�oczi).
Contents lists available at ScienceDirect
Vacuum
journal homepage: http://www.elsevier.com/locate/vacuum
https://doi.org/10.1016/j.vacuum.2020.109270
Received 2 December 2019; Received in revised form 10 February 2020; Accepted 12 February 2020
amount of the chromium atoms can be present in FeCr solid-solution with body-centered cubic structure [5]. The applied pressure during the ODS steel production and the pressure gradient in the direction of the sample surface may govern what structural changes may happen.
The properties and the electronic structure of bcc Fe under the effect of pressure of 0–30 GPa have been modeled theoretically. The calculated results show that there is a structural transition from the magnetic (bcc) Fe to nonmagnetic hexagonal closely packed (hcp) structure at approximately 11 GPa. The exchange splitting of the 3d electrons in the bcc Fe phase is deeper and wider than for the hcp. The magnetic moment in bcc Fe vanishes above 18 GPa, due to the structural transition to hcp Fe [15]. The ferromagnetic bcc Fe is ductile, while the hcp Fe becomes brittle above about 25 GPa. It was also modeled theoretically that the enthalpy barrier for the bcc–hcp transition is comparable with that of the bcc–fcc transition, while that of the fcc–hcp transition is relatively higher [16]. Therefore, at lower temperatures the occurrence of the metastable fcc state during the transition process must be transient. At higher temperatures, however, the fcc and the hcp phases dominate, while the bcc diminishes, attributed to configurational entropy [17,18].
2. Experimental 2.1. Samples
The ODS samples with nominal composition of Fe–18%Cr–13%Ni- 2.5%Mo-3.2%Si-0.1%C þ1 wt% Y2O3 were prepared from powders of Fe (99.9 at% purity, 75 μm diam.), Cr (99.9 at% purity, 75 μm diam.), Ni (99.6 at% purity, 75 μm diam.), Mo (99.9% purity, 75 μm diam.), and Y2O3 (99.99% purity, 30 nm diam.). The powders were degassed and sealed in a stainless steel container in vacuum of 10 2 Pa at 450 �C. The mixed powders were then mechanically alloyed with high-energy planetary ball milling at 380 rpm in argon protecting atmosphere for 3 h. The ball-to-powder weight ratio was 10:1. The canister contents were then consolidated by hot isostatic pressure (HIP) of 200 MPa at 1150 �C for 3 h. The hot samples were quenched to room temperature in 2–3 min.
2.2. Structure
The surface morphology of the prepared samples was checked by a white light interferometric surface analyzer (Zygo NewView 7100). A characteristic cross sectional line-cut profile is shown in Fig. 1. The surface morphology seen in the figure shows that the surface roughness was in the range of 1–2 μm vertically, and 10–50 μm horizontally. These elements are far too large to have a direct nano or chemical effect in the
ODS steel samples, similarly to the observed size-dependence of the valence band of Au nanoparticles [19]. This roughness might be related to the enlarged grains as a result of the relatively high consolidating annealing temperature, instead of the nano-size oxide particles which are supposed to have decreased size with temperature [6,7].
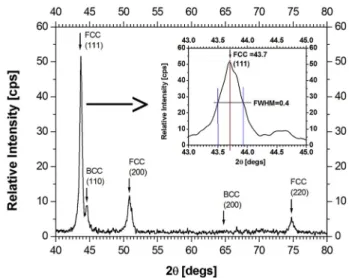
To determine the crystal structure of the ODS sample we used X-ray diffraction (XRD) [20]. Our instrument was a “Bruker AXS D8 Discover” XRD diffractometer, equipped with a Gobel-mirror and a scintillation € detector, utilizing Cu Kα radiation. The XRD spectrum of the sample with line positions and Miller-indices of the identified majority fcc phase and minority bcc phase were identified in the range of 2Θ ¼40�–80�(Fig. 2).
The 2Θ value for the strongest ODS Fe peak is at 43.7�and the FWHM is 0.4�. From the X-ray diffraction lines of the ODS sample this peak was identified as the Fe(111) plane of fcc iron. A hint of broadening of the Fe (111) reflection indicates some mechanical strains, or other defects and lattice imperfections in the iron component. The X-ray diffraction data for the magnetic reference sample consisted mostly of the Fe(200) reflection of the martensite (Fe bcc) structure with a small Fe(111) fcc component and another reflection showing even lower Cr content.
2.3. Magnetic measurements
Volumetric magnetization of two samples was measured as a func- tion of the applied magnetic field by a Foner-type vibrating-sample magnetometer [21]. The measurements were undertaken at room tem- perature (300 K) and revealed a low value (2 A m2/kg) magnetization for the ODS sample (austenite phase) and a much larger magnetization (20 A m2/kg) for the magnetic martensite reference sample.
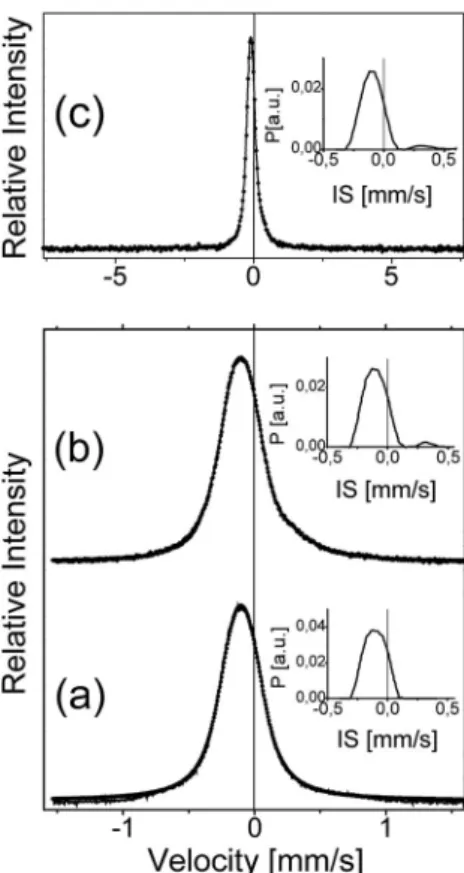
In order to see the magnetic properties of the top 60–300 nm thick layer, conversion electron M€ossbauer spectroscopic (CEMS) measure- ments was performed by a conventional constant acceleration type spectrometer in order to determine the detailed magnetic properties of the ODS sample. The spectrum was obtained using a 50 mCi 57Co(Rh) single line source. The isomer shift (IS) values are given relative to α-Fe at room temperature (300 K). The CEMS spectra for the ODS sample (Fig. 3) are shown with two velocity scales (insets a and b), and for the non-magnetic reference sample (inset c), all measured at room tem- perature. Both spectra consist of a relatively broad single line, and are very similar to those measured earlier for STT-95 absorber samples by Mossbauer transmission measurements [22,23]. The average isomer € shift (δ) and the line width (w) are 0.091(2) mm/s, and 0.337(7) mm/s, respectively. The inset histogram-like distribution for the ODS sample shows a small peak around 0.3 mm/s, suggesting another state of
Fig. 1. Surface morphology of the polished ODS steel sample, obtained by means of a Zygo NewView 7100 interferometric surface analyzer (cross- sectional line cut profile).
Fig. 2.X-ray diffraction (XRD) spectrum of the ODS steel sample with line positions and Miller-indices of the identified majority fcc and minority bcc phases.
iron. This small peak was not detected in the case of the reference sample. The M€ossbauer spectra indicated the presence of austenitic (fcc) phase Fe. No ferrite or martensitic phase contents were observed. The enhancement on the positive velocity tail of the peak of the ODS dis- tribution curve in Fig. 3 shows the presence of Fe3þin a small amount.
Maybe this can be attributed to the presence of oxygen in the 1% Y2O3, interacting with the iron.
2.4. UPS and XPS measurements
Focusing on the electronic properties of the surface, photoelectron investigations were performed on the as prepared ODS and as received magnetic reference samples, loaded into a Kratos ES300 photoelectron spectrometer. The measurements were carried out in 10 9 - 10 10 mbar UHV, provided by high performance ion getter pumps. For the mea- surements we used He I (21.2 eV) and Al Kα (1486.7 eV) UV and X-ray sources. The energy resolutions of the UV photoelectron spectrum (UPS), and the X-ray photoelectron spectrum (XPS) measurements were 0.1 eV and 1 eV, respectively. The energy scale of the UPS and XPS photoelectrons was calibrated to the Fermi level of the metal parts (which is at the midpoint of the steep drop at the high energy end of the kinetic energy spectrum of the photoelectrons for each sample and spectrum), however, as it turned out lately, more reliable procedures are advisable [24].
Because of the very high surface sensitivity of these methods, the surfaces of the samples were cleaned in situ by 5 keV Arþion beam until the spectrum was stabilized, and the reference spectrum was equivalent to the data given in the literature for the clean Fe [25]. The ion getter pumps are very effective at extracting N2, O2, CO, and CO2 gases without introducing hydrocarbon contamination, therefore, after a long enough Arþion cleaning we can expect that any O or C contamination that are still detected were present inside the sample. The survey XPS spectrum is given in Fig. 4a, with an expanded view of the Fe 2p core level emission shown in Fig. 4b. The survey XPS spectrum was used to determine the O,
C, content and metallic chemical components. The concentrations of the O and C components are rather large, and may form some oxides with the metallic components. The most important component, namely the Fe, was measured by the strength of its 2p emission separately.
The valence band of the α-Fe has ferromagnetic characteristics very similar to the bcc Fe, namely, large Fe 3d originated density of states (DOS) at the Fermi level. According to earlier observations [26], there is a strong correlation between the valence band DOS, the ferromagnetic properties, and the mechanical properties.
The splitting of the Fe 2p peak, seen in Fig. 4b, corresponds to that of a separate clean pure iron surface, namely 13.2 eV splitting, instead of 13.6 eV characteristic for the iron oxide [25]. Nevertheless, the little increase in the spin-orbit splitting compared to the reference sample, and the additional intensity on the high energy part of the main peak can be partially attributed to iron oxide. We should note that there is some additional emission approximately at 708–715 eV and at 717–726 eV binding energy ranges, causing a little broadening of the Fe 2p emis- sions. This broadening can not be explained by simple oxide formation, because that would suggest a larger, 13.6 eV splitting. Therefore, we suppose an indirect effect such as the deformation of the Fe–Fe distances by some mechanical stresses or by other mechanical modifications.
Another support for such a deformation-induced broadening is the broadened Fe(111) reflection line in the XRD spectrum of the ODS sample, shown in Fig. 2.
The valence band emissions of the photoelectrons induced by He I and Al Kα radiation are shown in Figs. 5 and 6. In the case of the Al Kα excitation the thickness of the irradiated region is deeper. Theoretically a certain fraction of the valence band photoelectron emission may come from the valence states of Cr or Ni, but we were not able to identify any Fe–Ni–Cr intermetallic states. Only the emission coming from the Fe valence band states could be identified. These states include the 3p, 3d and 4s electrons, while the 3d electrons making the largest contribution to the valence band density of states.
Fig. 3. The conversion electron Mossbauer spectra (CEMS) of the ODS steel (a, € b) and of a non-magnetic stainless steel reference sample (c).
Fig. 4.X-ray photoelectron spectrum (XPS) (a): Survey measurement spectrum of the ODS steel sample after surface cleaning. (b): The Fe 2p emission doublet in the ODS steel sample (continuous line is measured data, dashed line is reference measurement according to “La Surface”, taken from Moulder et al. (Ref. 25)).
3. Discussion
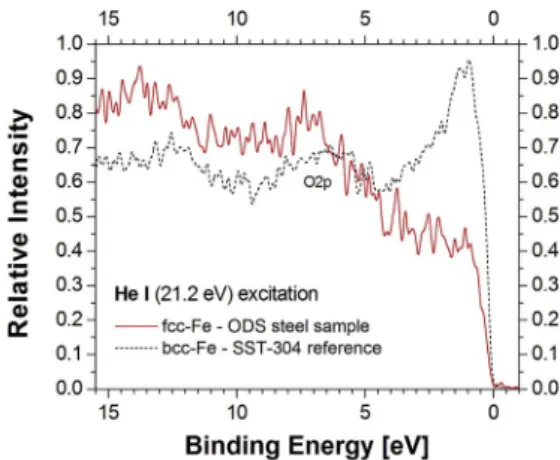
In our ODS steel sample the concentrations of Cr and Ni are relatively low compared to the iron’s (0.18, 0.13, and 0.622, respectively), and the formation of their intermetallic compound phase is thermodynamically unexpected. Nevertheless, in normal atmosphere the contamination- related DOS (mainly coming from C 1s and O 1s) and the compounds- related DOS could be expected. They can be investigated separately, mostly by valence band, and partly by core level photoemission, and also by X-ray diffraction. In our case the formation of compounds could be estimated as being rather small, evidenced by the lack of compound- originated diffraction and emission, not seen in Figs. 2 and 4. Only the effects of some non-interacting components were visible. On the other hand, in Figs. 5 and 6 it can be seen that in the fcc curves (solid lines) there are broad photoemission peaks at 7.5 eV and 9 eV binding energies with around 4 eV and 3 eV FWHM, using He I and Al Kα excitations, respectively. These are not modifying the recorded UPS and XPS valence band spectra at the vicinity of the Fermi level, and could originate from the Fe 3d states with higher binding energies.
The electron emission intensity for the magnetic SST reference sample shown in Figs. 5 and 6 in the 0–5 eV binding energy range (dashed lines) correlates well with the valence band emission of the Fe 3d bcc states, with a relatively large peak at the Fermi level, in contrast to the missing peak for the fcc valence band emission (Fig. 5, solid line).
Around 7 eV we can see also a peak feature that can possibly be attributed to O 2p emission.
According to the theoretical models, the photoelectron yield for the ODS sample in the range of 0–9 eV below the Fermi level, seen in Fig. 5 (solid line) is due to unresolved peaks, which are characteristic for the fcc iron [27]. There is no reason to suppose a chemical interaction induced change in the iron below or above the Fermi level other than the modification of the valence band density of states. The emission in the 5–10 eV region could more likely be attributed to the structural differ- ences between the bcc and fcc iron phases. This can be tested by measuring the mechanical properties of the ODS steel.
In the literature [27] the electronic properties of fcc and bcc Fe–Mn (9%) alloys were also calculated using the self-consistent full potential linearized-plane–wave method, under the generalized gradient approximation to full lattice relaxation. By minimizing the total energy, the lattice constant was calculated for the ground state. The total energy dependence of the volume, and the DOS was also determined by this calculation. It was found that the calculated DOS for the bcc and for the fcc phases are different. In the case of the bcc phase the DOS should have a rather large maximum right at the Fermi level, while for the fcc phase the DOS should decrease by one-third at the Fermi level, and should have two maximums around 1.8 eV and þ0.4 eV energies below and above the Fermi energy, respectively. Our experimental results (Fig. 5) are in good agreement with those theoretical findings. The DOS for the bcc phase is experimentally well documented [28,29], but for the fcc Fe phase our data are the first experimental verification (to the best of our knowledge) for the calculated DOS. The broadening of the photo-electron spectrum near to the EF was already observed, and was attributed to the broadened localized 3d states [28,29]. We suppose that this broadening can be explained as the effect of the mechanical strains between the different phases being present.
The production pressure and temperature of our ODS samples were 200 MPa and 1423 K, while the calculated triple point for the Fe bcc-fcc- hcp system is at 7.3 GPa and 820 K [30]. In standard conditions (1 bar and 300 K), the iron is ferromagnetic and has a bcc structure. At higher temperatures, namely between 1185 and 1667 K the crystal structure gradually changes to fcc. Introducing higher pressure (above roughly 11 GPa) the structure transforms further to hcp, even at lower tempera- tures, however, in the latter case the transformation remains slow.
During our ODS sample production the pressure was not high enough to effectively promote the transformation to hcp, but the temperature was suitable for the bcc-fcc transformation, consequently, the finally ach- ieved structure is expected to be a mixture of the bcc and fcc phases. The XRD spectrum of the ODS sample (Fig. 2) confirms that the majority phase is fcc, with some minor bcc phase still being present. The CEMS measurement, however, justified only the presence of the austenitic fcc phase (Fig. 3), and failed at observing the bcc phases (high Cr content ferritic, or martensitic). Also, the volumetric Foner-type magnetization measurement revealed that the magnetization of the ODS sample was roughly an order of magnitude lower than that of the martensitic reference sample (2 A m2/kg vs. 20 A m2/kg), suggesting that the amount of the fcc phase was at least 10 times of the bcc phase in the whole volume of the ODS sample. The straightforward explanation is the limited depth sensitivity of the CEMS technique, because roughly 65% of the detected electrons are coming from 60 nm deep, and 96% from 300 nm deep. Bearing this depth sensitivity in mind, we should conclude to much less bcc phase in the surface of the ODS sample. The size of the grains is in the range of 200–400 nm, and maybe only the grains being the closest to the sample surface are involved, as a thermodynamic effect [7], or as the consequence of the interaction with the container wall during the sample production. In the case of the photoelectron mea- surements (UPS and XPS) the samples were cleaned in the UHV chamber by in situ 5 keV low angle Arþbeam, but this directly modifies only the top 1–5 nm thick surface layer (depending on the time duration), and this is thinner than the typical size of Y2O3 oxide particles (10–40 nm) surrounding the grains. Therefore, we can expect that the cleaning process could be responsible only for a change in the very surface of the Y2O3 oxide coverage of the grains, while in accordance with our XPS Fig. 5. The valence band region of the UPS spectra of the ODS steel sample
(solid line) and of the bcc structured magnetic SST reference sample (dashed line), both obtained by He I excitation (21.2 eV).
Fig. 6. The valence band region of the XPS spectra of the ODS steel sample (solid line) and of the magnetic SST reference sample (dashed line), both ob- tained by Al Kα excitation (1486.7 eV).
survey measurement, the cleaning was effective at removing the iron oxide from the surface, might had been present earlier (Fig. 4).
The XPS and UPS measurements on the ODS samples gave results that are in line with what we saw in the case of the magnetic mea- surements (CEMS vs. Foner), namely: while the UPS measurement (Fig. 5) with its limited depth sensitivity revealed only the presence of the fcc phase (together with some O 2p intensity that can be related to oxides), the XPS measurement (Fig. 6) with its deeper sensitivity range suggested a little bit of bcc phase also being present. The photoelectron spectroscopy undertaken in UHV turned out to be a viable alternative to test the crystalline state of ODS steels.
The structure and the chemical composition of these materials can slightly change in the vacuum environment of spacecrafts, and the photoelectron spectroscopy can test it in similar conditions. Up to roughly 100 km altitude the relative composition of the atmosphere remains similar, only the air pressure drops exponentially. Between 200 and 650 km altitude region, however, the UV irradiation generated atomic oxygen becomes the dominant component (oxygen zone, or ozone). At the orbit of the International Space Station (ISS, 408 km) roughly 90% of the atmosphere is atomic O, with minority N2, N and He.
The material density depends very much on the solar activity, but usu- ally remains better than the usual UHV vacuum levels used for spec- troscopic measurements. Nevertheless, as the spacecraft’s orbital velocity is in the range of 7.8 km/s, this results in a continuous 5 eV energetic oxygen erosion [31], furthermore, there are also much more energetic ions (4–500 MeV) bombarding the spacecraft, together with occasional micro meteorites (1–50 μm). In order to simulate the space environment we should apply high flux low-energy oxygen irradiation in parallel with low flux high-energy ion irradiation. The effect of the low-energy (<2 keV) oxygen irradiation alone was investigated in tita- nium and in a carbon-boron composite, and preferential sputtering and increased surface roughness was found [32]. In a somewhat comple- mentary study, Fe–Cr–Ni–Mn single crystal stainless steel was bom- barded with 1 MeV energy proton pulses. They found the target locally melted, and after the rapid quenching a dislocation-rich poly-crystalline, or even amorphous structure [33]. In order to test the corrosion effects of the more complex space radiation, further experiments are needed.
When the corrosion resistance is investigated in fluid environments, only its consequences on the depth profile of the mechanical, structural, electronic, and magnetic properties of the ODS steel can be investigated.
But even in this case the photoelectron spectroscopy may lead to a better understanding of the iron based systems containing fcc and bcc phases, leading to different spectra near the valence band. The role of the chemical structure of the oxide nanoparticles are also getting investi- gated, because they may have a core-shell structure and connected to the grain boundaries [34]. In another work the decomposition, precipitation and vacancy generation of the Y2O3 component was investigated theo- retically [35]. In an experimental XPS investigation it was found that beside the Y2O3 oxide particles, Cr2O3 and Fe2O3 were also generated [36]. Other experimental investigations show that during the heat treatment of the ODS source material the Fe2O3 forms a metastable oxide layer, while the discrete Cr2O3 and Y2O3 oxides are grown pref- erentially at the grain boundaries [37].
4. Conclusions
The structure of an oxide dispersive steel (ODS) was investigated.
Our sample has majority fcc and minority bcc phases, as revealed by XRD and volumetric magnetic measurements. In the top 100 nm deep layer, however, only the fcc phase was detected by the CEMS and the UPS measurements. The XPS measurements with its deeper sensitivity was able to pick up a signal that might had been originated from the small amount of bcc phase. The missing bcc phase on the top layer of the grains can be attributed to the interaction between the container wall and the sample material during the production, via corrupting the Y2O3
oxide coverage of the grains. We expect that the altered distribution of
the oxide particles in the surface of our ODS steel (promoting the fcc phase vs. the bcc) can affect the corrosion and wear resistance both, in vacuum and in fluid environments. The slightly different surface composition and structure of the ODS steels may have an importance in possible application in different systems e. g. in large energy productive high temperature reactors and in spacecrafts.
Data availability
The raw/processed data required to reproduce these findings cannot be shared at this time due to technical or time limitations.
Declaration of competing interest
To the best of my knowledge there is NO conflict of interest.
Acknowledgement
This work was supported by the Hungarian OTKA [grant number 109570]. Discussions with Prof. Imre Bakonyi were highly acknowledged.
References
[1] K. Oka, S. Ohnuki, S. Yamashita, N. Akasaka, S. Ohtsuka, H. Tanigawa, Structure of nano-size oxides in ODS steels and its stability under electron irradiation, Mater.
Trans. 48 (2007) 2563–2566.
[2] A. Kimura, R. Kasada, N. Iwata, et al., Development of Al added high-Cr ODS steels for fuel cladding of next generation nuclear systems, J. Nucl. Mater. 417 (2011) 176–179.
[3] S. Ukai, M. Fujiwara, Perspective of ODS alloys application in nuclear environments, J. Nucl. Mater. 307–311 (2002) 749–757.
[4] G.R. Odette, M.J. Alinger, B.D. Wirth, Recent developments in irradiation resistant steels, Annu. Rev. Mater. Res. 38 (2008) 471–503.
[5] A. K Rivai, A. Dimyati, W.A. Adi, Mechanosynthesis of a ferritic ODS (oxide dispersion strengthened) steel containing 14% chromium and its characterization, IOP Conf. Ser. Mater. Sci. Eng. 202 (2017), 012068.
[6] H.L. Ding, R. Gao, T. Zhang, X.P. Wang, Q.F. Fang, C.S. Liu, Annealing effect on the microstructure and magnetic properties of 14%Cr-ODS ferritic steel, Fusion Eng.
Des. 100 (2015) 371–377.
[7] R. Gao, T. Zhang, H.L. Ding, Y. Jiang, X.P. Wang, Q.F. Fang, C.S. Liu, Annealing effects on the microstructure and mechanical properties of hot-rolled 14Cr-ODS steel, J. Nucl. Mater. 465 (2015) 268–279.
[8] M.J.R. Sandim, R.A. Renzetti, C. Bormio-Nunes, H.R.Z. Sandim, Magnetic characterization of ODS-Eurofer steel: remanent magnetization and magnetostriction behavior, Fusion Eng. Des. 126 (2018) 5–9.
[9] V.B. Oliveira, M.J.R. Sandim, D. Stamopoulos, R.A. Renzetti, A.D. Santos, H.R.
Z. Sandim, Annealing effects on the microstructure and coercive field of two ferritic–martensitic Eurofer steels: a comparative study, J. Nucl. Mater. 435 (2013) 189–195.
[10] M.J.R. Sandim, F.U. Farrao, V.B. Oliveira, E.H. Bredda, A.D. Santos, C.A.M. dos Santos, H.R.Z. Sandim, Effect of tempering on the microstructure, electrical, and magnetic properties of Eurofer-97 steel, J. Nucl. Mater. 461 (2015) 265–270.
[11] R.A. Renzetti, H.R.Z. Sandima, M.J.R. Sandim, A.D. Santos, A. M€oslang, D. Raabe, Annealing effects on microstructure and coercive field of ferritic–martensitic ODS Eurofer steel, Mater. Sci. Eng. 528 (2011) 1442–1447.
[12] J. Degmova, J. Dekan, J. Simeg Veternikova, V. Slugen, Mossbauer spectroscopy € study of laboratory produced ODS steels, Acta Physica Polonica A No 4 (131) (2017) 1171–1173.
[13] E. Gil, J. Cortes, I. Iturriza, N. Ordas, XPS and SEM analysis of the surface of gas atomized powder precursor of ODS ferritic steels obtained through the STARS route, Appl. Surf. Sci. 427 (2018) 182–191.
[14] I. Hilger, X. Boulnat, J. Hoffmann, C. Testani, F. Bergner, Y. De Carlan, F. Ferraro, A. Ulbricht, Fabrication and characterization of oxide dispersion strengthened (ODS) 14Cr steels consolidated by means of hot isostatic pressing, hot extrusion and spark plasma sintering, J. Nucl. Mater. 472 (2016) 206–214.
[15] V. Iota, J-H Park Klepeis, C.-S. Yoo, Electronic structure and magnetism in compressed 3d transition metals, Appl. Phys. Lett. 90 (2007), 042505.
[16] Z. Lu, W. Zhu, T. Lu, W. Wang, Does the fcc phase exist in the Fe bcc–hcp transition? A conclusion from first-principles studies, Model. Simulat. Mater. Sci.
Eng. 22 (2014), 025007, 19pp.
[17] B. Wang, H.M. Urbassek, Atomistic dynamics of the bcc M fcc phase transition in iron: competition of homo- and heterogeneous phase growth, Comput. Mater. Sci.
81 (2014) 170–177.
[18] J.S. Wrobel, D. Nguyen-Manh, M.Y. Lavrentiev, M. Muzyk, S.L. Dudarev, Phase stability of ternary fcc and bcc Fe-Cr-Ni alloys, Phys. Rev. B 91 (2015), 024108.
[19] G. Peto, G.L. Moln} �ar, Z. P�aszti, O. Geszti, A. Beck, L. Guczi, Electronic structure of gold nanoparticles deposited on SiOx/Si, Mater. Sci. Eng. C 19 (2002) 95.
[20] J.M. Cowley, “X Ray Diffraction” in Diffraction Physics, 1975. North Holland, Amsterdam.
[21] S. Foner, Versatile and sensitive vibrating-sample magnetometer, Rev. Sci. Instrum.
30 (1959) 548.
[22] D.C. Cook, Strain induced martensite formation in stainless steel, Metall. Trans. A 18 (1987) 201.
[23] J. Sakamoto N. Hayashi, T. Toriyama, M€ossbauer study of martensitic transformation in Xe ion-irradiated type 304 austenitic stainless steel, Hyperfine Interact. 80 (1993) 1019.
[24] G. Greczynski, L. Hultman, X-ray photoelectron spectroscopy: towards reliable binding energy referencing, Prog. Mater. Sci. 107 (2020), 100591.
[25] J.F. Moulder, J. Chastain, Handbook of X-Ray Photoelectron Spectroscopy.
Reference Book of Standard Spectra for Identification and Interpretation of XPS Data, Physical Electronics Division, Perkin-Elmer Corp. Eden Prairie, Minn., 1992.
[26] Z. Li, Z. Liu, W. Liu, Sci. China E: Techn. Sci. 45 (2002) 195.
[27] E. Ucgun, H.Y. Ocak, Electronic properties of austenite and martensite Fe-9%Mn alloys, Cent. Eur. J. Phys. 6 (2008) 808.
[28] S. Hüfner, Photoelectron Spectroscopy Principles and Applications, Springer Verlag, Berlin-Heidelberg, 1993, pp. 411–418.
[29] D.E. Eastmen, Photoemission spectroscopy of metals, North Holland Amsterdam, in: D.A. Shirley (Ed.), Techniques of Metal Research, vol. 6, 1972, p. 411. Part I.
[30] P.I. Dorogokupets, A.M. Dymshits, K.D. Litasov, T.S. Sokolova, Thermodynamics and equations of state of iron to 350 GPa and 6000 K, Sci. Rep. 7 (2017) 41863, 2017.
[31] S.W. Samwel, Low earth orbital atomic oxygen erosion effect on spacecraft materials, Space Res. J. 7 (1) (2014) 1–13.
[32] L.I. Ivanovm, A.P. Komissarov, N.A. Machlin, V.A. Poliakov, Vacuum 43 (10) (1992) 955–959.
[33] A.D. Pogrebnjak, A.G. Lebed, Yu.F. Ivanov, Modification of single crystal stainless steel structure (Fe-Cr-Ni-Mn) by high-power ion beam, Vacuum 63 (2001) 483–486.
[34] V. Badjeck, M.G. Walls, L. Chaffron, J. Malaplate, K. March, New insights into the chemical structure of Y2Ti2O7-δ nanoparticles in oxide dispersion-strengthened steels designed for sodium fast reactors by electron energy-loss spectroscopy, J. Nucl. Mater. 456 (2015) 292–301.
[35] Y.D. Ou, W.S. Lai, Vacancy formation and clustering behavior in Y2O3 by first principles, Nucl. Instrum. Methods Phys. Res. B 269 (2011) 1720–1723.
[36] S. Ningshen, M. Sakairi, K. Suzuki, S. Ukai, The passive film characterization and anodic polarization behavior of 11% Cr ferritic/martensitic and 15% Cr oxide dispersion strengthened steels in different electrolytic solutions, Appl. Surf. Sci.
274 (2013) 345–355.
[37] E. Gil, J. Cort�es, I. Iturriza, N. Ord�as, XPS and SEM analysis of the surface of gas atomized powder precursor of ODS ferritic steels obtained through the STARS route, Appl. Surf. Sci. 427 (2018) 182–191.