Green LED as an Effective Light Source for Curing Acrylate-Based Dental Resins in Combination with Irgacure 784
Article in Advances in Condensed Matter Physics · April 2018
DOI: 10.1155/2018/8265305
CITATIONS
0
READS
54 7 authors, including:
Some of the authors of this publication are also working on these related projects:
Nanoparticles in macromolecular crowdingView project
Development of smart fluorescent dyesView project Bukovinszky Katalin
Debreceni Egyetem, Orvos- és Egészségtudományi Centrum 14PUBLICATIONS 15CITATIONS
SEE PROFILE
Szaloki Melinda University of Debrecen 25PUBLICATIONS 42CITATIONS
SEE PROFILE
Istvan Csarnovics University of Debrecen 52PUBLICATIONS 149CITATIONS
SEE PROFILE
Sandor Keki University of Debrecen 183PUBLICATIONS 1,411CITATIONS
SEE PROFILE
All content following this page was uploaded by Miklós Nagy on 24 April 2018.
The user has requested enhancement of the downloaded file.
Research Article
Green LED as an Effective Light Source for Curing
Acrylate-Based Dental Resins in Combination with Irgacure 784
Katalin Bukovinszky,
1Melinda Szalóki,
1István Csarnovics,
2Istvan Szabó,
3Sándor Kéki,
4Miklós Nagy ,
4and Csaba Heged 4 s
11Department of Biomaterials and Prosthetic Dentistry, University of Debrecen, Debrecen, Hungary
2Department of Experimental Physics, University of Debrecen, Debrecen, Hungary
3Department of Solid State Physics, University of Debrecen, Debrecen, Hungary
4Department of Applied Chemistry, University of Debrecen, Debrecen, Hungary
Correspondence should be addressed to Csaba Heged˝us; hegedus.csaba.prof@dental.unideb.hu Received 18 January 2018; Revised 5 March 2018; Accepted 15 March 2018; Published 23 April 2018
Academic Editor: Jia-De Lin
Copyright © 2018 Katalin Bukovinszky et al. This is an open access article distributed under the Creative Commons Attribution License, which permits unrestricted use, distribution, and reproduction in any medium, provided the original work is properly cited.
Low intensity green light emitting diodes (LED) were shown to be an effective light source to induce the photopolymerization of an acrylate-based photocurable dental restorative resin mixture of bisphenol A glycerolate dimethacrylate (BisGMA), triethylene glycol dimethacrylate (TEGDMA), and diurethane dimethacrylate (UDMA), in combination with fluorinated diaryl titanocene (Irgacure 784). Dental matrices were prepared by the LED light source at different intensities. The mechanical properties, such as Vickers microhardness, compressive strength, diametric tensile strength, flexural strength, and𝐸-modulus of the created samples, were investigated. The kinetics of the photopolymerization was followed by Raman spectroscopy and conversion values were determined. It was found that, despite its narrow-emission range centered at a wavelength of 531 nm, the green LED light source is suitable for the preparation of dental matrices with good mechanical properties and high conversion values.
1. Introduction
Photopolymerization [1] has become an essential tool in three-dimensional (3D) printing [2] and photolithography [3], in the construction of polymer electronics [4], optical materials [5], membranes [6], and coatings, and in sur- face modifications. The most common photopolymeriza- tion monomers are cyclic or linear epoxides (cationic) and acrylate-based monomers (radical) [1]. Acrylate-based pho- topolymers are important materials for cardiovascular appli- cations [7], for in vivo drug delivery [8], and for minimally invasive procedures. Dimethacrylate-based resins have many applications in restorative dentistry, being used as adhesives and pit-and-fissure sealants, can be combined with silane- coated glass fillers to render the most widely used esthetic direct restorative material, and can be used as cementation agents and veneering materials [9–12]. Photopolymeriza- tion starts with exposure to a light source, the operation
wavelength of which depends on the photoinitiator added.
For the photopolymerization process to be effective, the spec- tral radiant power of the light-curing unit must fall within the spectral range required to activate the photoinitiator present in the resin [13].
Several types of light-curing units are available for photo- activation of photopolymerizable dental resins. The contem- porary technologies include quartz-tungsten-halogen lights (QTH), plasma arc lights, high-intensity QTH lights, and light emitting diodes (LED). The most common photoini- tiator in dental practice is camphorquinone (CQ) in com- bination with tertiary amines as coinitiators [14]. CQ has a relatively broad absorption in the ultraviolet (UV) region and an absorption band in the visible region with a maximum wavelength (𝜆max) of 468 nm [14, 15]. Unfortunately, CQ has a low molar absorption coefficient in the visible region of the spectrum. Normally, UV light would be used in combination with CQ, but due to the risk of tissue burning
Volume 2018, Article ID 8265305, 10 pages https://doi.org/10.1155/2018/8265305
and carcinogenic and photoallergic effects, the application of irradiation below 400 nm is restricted in dental applications, and visible light is favored [16].
To overcome the relatively low initiation efficiencies, other high-performance visible photoinitiators have been developed for resins used in specialty applications, such as direct laser imaging, holography, or photopolymerization color printing [17]. Fluorinated diaryl titanocene (Irgacure 784) proved to be effective for initiating the polymerization of acrylate monomers under visible light exposure, having high photosensitivity and absorbing light in a large wavelength region of up to 550 nm, meaning it may be suitable for use in dental composites [18]. Another advantage of Irgacure 784 is that it is not reliant on diffusion controlled electron transfer reactions because it undergoes unimolecular decomposition [19]. However, the application of Irgacure 784 may have the disadvantage of residual color when used in excess, but this issue is also present in CQ/amine initiator systems [20] and could be overcome by optimizing the amount of initiator or could be lowered by the application of fillers.
The degree of conversion of the dental resin, which is the marker of polymerization efficiency, depends on the correlation between the spectral distribution of the light source and the absorption spectra of the photoinitiator [21]. Essentially, QTH light sources have been used for the photopolymerization of dental resins, but their application is energetically inefficient, and their effective lifetime is limited by degradation [22]. On the other hand, LED have many intrinsic advantages making them ideally suited for the photopolymerization of oral biomaterials. Their first major advantage for photopolymerization is their high energy efficiency in terms of energy required for a cure cycle. LED have high durability, meaning a long lifetime with little degradation of light output. The second major advantage is that their typical spectral line width is 5–20 nm. So, as the photoinitiators present in oral biomaterials have light absorption spectra with distinct maxima, effective and rapid photopolymerization could result if the wavelength of the LED was chosen in this range [21].
While the photocuring of dimethacrylate-based dental resins in combination with Irgacure 784 and LED light source has many advantages, similar to other free-radical polymerizations, it may be strongly inhibited by free-radical scavengers such as oxygen. However, the inhibition effect of oxygen was studied in detail by Gauthier et al. for bisphenol A glycerolate dimethacrylate:triethylene glycol dimethacrylate- (Bis-GMA:TEGDMA-) based dental composites [23]. They showed that, with the proper selection of the monomer viscosity and polymerization temperature, oxygen inhibition only occurs in the surface layer, to a depth of about 20𝜇m, and below that approximately 90% conversion could be reached.
To the best of our knowledge, no studies have been published on the preparation of dental acrylate resins using Irgacure 784 as a photoinitiator in combination with a green LED light source. Herein, we report on our investigation into the effect of a LED light-curing unit on the mechanical prop- erties and conversion rates of acrylate-based experimental resin containing Irgacure 784 photoinitiator.
2. Experimental Materials and Methods
2.1. Preparation of Experimental Resin Matrix. The photocur- able resin matrix was a mixture of bisphenol A glycerolate dimethacrylate (BisGMA), triethylene glycol dimethacrylate (TEGDMA) (Sigma-Aldrich Co., St. Louis, MO, US), and diurethane dimethacrylate (UDMA) (Sigma-Aldrich Chemie GmbH, Steinheim, Germany) monomers in a 21.4 : 25.4 : 53.3 weight ratio, respectively, containing 2% (m/m) Irgacure 784 (BASF Hungary Ltd.) as a photoinitiator. Dimethylfor- mamide (DMF, high-performance liquid chromatography (HPLC) grade) was obtained from Sigma-Aldrich. The mate- rials were used without further purification.
2.2. Photopolymerization of the Samples. To exclude oxygen, the photocuring process was performed under laminate conditions. The experimental resin was inserted into a Teflon mold and the top surface was flattened by a polyester strip (to seal the surface from oxygen) as is shown in Figure 1(b).
Light activation was performed for 30 s with the LED at light intensities of 0.7, 1.0, 1.2, 1.4, 2.0, 4.0, and 6.0 mW/cm2. The photopolymerizations were done in a dark room, without any backlights. The specimen disks were 2 mm thick and 10 mm in diameter.
2.3. Light-Curing Unit Description. In our experiments, we used a light emitting diode light source (LED) (Megaled, 3 W green power LED, Hungary) unit in order to polymerize the experimental resin matrix. The emission range of the LED light source is centered at a wavelength of 531 nm. The full width at the half maximum is 32 nm, while the half width at the half maximum is 16 nm for our LED light source. The size of the irradiated region was 3 × 3 cm. Therefore, the samples were irradiated through a cuboid, a tube with both sides open, which was covered inside with a highly reflective coating to make the irradiation spot more homogenous. The optical spectrum of the light source was measured with a fiber optical spectrophotometer (Ocean Optics, USB650, US).
The intensity of the light source was measured by a power meter setup (ThorLabs, PM100, US). In addition, the spectral irradiance distribution of the light source was detected with a spectroradiometer (EKO Instruments, LS-100, Japan). The UV-vis spectra of the photoinitiator in toluene were recorded on an Agilent Cary 60 spectrophotometer (Agilent, Santa Clara, CA, US) in a quartz cuvette with a 1.00 cm optical length. A 3.00 cm3solution was prepared from the sample.
2.4. Resin Density, Extraction, and Water Swelling Experi- ments. The densities of the cured samples were determined in a pycnometer at 25∘C, using water as the medium.
For the swelling studies, three of the samples at different light intensities, 0.7, 1.0, 1.2, 1.4, 2.0, 4.0, and 6.0 mW/cm2, were placed in excess deionized water and were allowed to reach equilibrium at ambient temperature for a week. The surfaces of the wet disks were cautiously wiped dry and their weights were measured immediately. After 24 h, the cured samples were extracted with DMF in a Soxhlet-type extractor overnight. The extracted samples were dried in vacuum at 50∘C for 2 days and their weight was measured.
(a) (b)
Figure 1: Experimental layout for Raman spectroscopy (a) and the laminated Teflon mold used for preparing the resins (b).
2.5. Characterization of Polymerization Kinetics of Exper- imental Resin with Raman Spectroscopy at Different Light Intensities. The Raman spectra were recorded with a system incorporating a waveguide spectrophotometer (Ocean Optics QE 6500, US), and the light source was a CW laser operating at 785 nm. As this wavelength is out of the absorption range of the photoinitiator, the laser light did not affect the photopolymerization process. The monomer was irradiated in a polystyrene cuvette and the spectra were taken before and after polymerization (Figure 1).
In addition, in situ investigation of the Raman spectra was completed; the spectra were recorded during the illumination every second. This measurement setting allows calculating and establishing the kinetics at different types of irradiation.
With these measurements, the chosen light intensities varied between 0.7 and 10.0 mW/cm2. The laser was focused to the center of the cuvette, so the spectral information was collected from the volume and not from the surface. The polymerization time was chosen as 250 s to allow for the front of the polymerization to reach the Raman source. The images, which display changes in composition and degree of conversion (𝛼), were generated with OriginPro 8.0software.
2.6. Preliminary Vickers Microhardness Measurements. The specimens were prepared as described in Section and were stored at room temperature for 24 h before testing. At each light intensity, three samples were prepared (𝑛 = 3) and five microhardness indentations were made per specimen.
Vickers microhardness measurements were made with a 100 g load for 20 seconds in a microhardness testing machine (Buehler Vickers Microhardness, Micromet 5103, US). In this
preliminary investigation, our aim was to choose the optimal light intensity for polymerization of the samples, where the Vickers microhardness data showed the best results. The subsequent mechanical measurements were performed at the chosen light intensity.
2.7. Diametral Tensile Strength Measurements. The uncured resin was placed in a Teflon mold and the samples were covered with a thin polyester foil. The polymerization of the samples was performed at a light intensity of 1.4 mW/cm2 of the LED light source for 30 s. The size of the specimens was 3 mm thick and 6 mm in diameter. The diametral tensile stress (DTS) of the experimental resin was determined by a mechanical testing device (INSTRON 5544, US) equipped with 2-kN load cell at a crosshead speed of 1 mm/min. DTS was calculated from the maximum compression load (𝐹) at the specimen fracture in a diametric position, with the following equation: DTS = 2𝐹/(𝜋ℎ𝑑), whereℎis the height of the specimen,𝑑is the diameter of the specimens, and𝜋is a constant at 3.14.
2.8. Flexural Strength Measurements. The flexural strength of the experimental resin samples was investigated with a mechanical testing device (INSTRON 5544, US) equipped with 100-N load cell at a crosshead speed of 1 mm/min. The span distance was 18 mm. The three-point flexural strength tests were implemented on prismatic specimens. The sam- ples were photopolymerized with the LED light source at 1.4 mW/cm2power density for 30 s in a Teflon mold. The cross section size of the specimens was 2 mm×2 mm and 25 mm in length. In average, 14 specimens were prepared and stored at
O
OH O
O
O OH O
O
O
O O
O O
O
O O
O
O HN
R
O
O
O O
NH R
TEGDMA
BisGMA
UDMA Irgacure 784
N F F
F
N F
Ti
#(3
#(3
#(3
#(3
#(3
#(3 #(3
#(3
#(3
#(2
#(2
#(2
(2#
(2#
(2#
(3#
R = H or#(3(~1:1)
Figure 2: The chemical structure of the photoinitiator and acrylate monomers used in this study.
room temperature for 24 h before testing. The flexural stress and modulus (modulus of elasticity) data were calculated by MSZ EN ISO 178.
2.9. Compressive Strength Measurements. Compressive strength tests were performed with a mechanical testing ana- lyzer (INSTRON 8874, High Wycombe, UK) equipped with 25-kN load cell. Fifteen cylindrical samples (𝑛 = 15) were created. The resin was inserted in a single increment into a Teflon mold, and the top surface was flattened by means of a polyester strip. For the sample preparation, the light activation was performed for 30 s at 1.4 mW/cm2. The size of the specimens was 6 mm in height and 3 mm in diameter.
The crosshead speed was 1 mm/min. The compressive data were calculated by MSZ EN ISO 604:2003.
3. Results and Discussion
3.1. Monomers and Light Source. Our resin contained a mon- omer mixture of BisGMA, TEGDMA, and UDMA (Figure 2) in a 21.4 : 25.4 : 53.3 weight ratio. Asmussen and Peutzfeldt [24] examined the influence of these monomers on the mechanical properties of experimental resin composites.
They stated that for the designed mechanical properties of
dental composite resins it is best to apply monomers in this optimal ratio for that purpose. The aromatic monomer BisGMA is rigid compared to TEGDMA and UDMA. The urethane linkage in UDMA, the favorable stereochemistry, and the long chain in TEGDMA provide flexibility to these molecules. The application of more flexible monomers is expected to increase the conversion of polymerization.
The photoinitiator used was Irgacure 784, mixed to the matrix in 2% (m/m). In addition to the copolymer composition, the photoinitiator also influences the physical properties of the resins. Sabol et al. studied Irgacure 784 in an epoxy photopolymer and assumed that two absorptive photoproducts are generated during photoinitiation [25].
This photoinitiator does not require an electron donor to produce free radicals so it is suitable for the substitution of CQ in dental photopolymer systems. Irgacure 784 absorbs photons at the green exposing wavelength(𝜆)of 532 nm. The absorption of light quanta by Irgacure 784 causes reversible isomerization, resulting in an intermediary isomer with dif- ferent absorption spectra, which can either relax and return to the original state or cause photocleavage, resulting in a stable acryl compound and an unstable titanocene diradical that can react with a reducing agent to form a stable transparent final product. Another possible method of forming a final
0.0E + 00 2.0E− 03 4.0E− 03 6.0E− 03 8.0E− 03 1.0E− 02
0 200 400 600 800 1000 1200 1400 1600
(-−1 =G−1 ) Spectral irradiance (mW/=G2 /nm)
400 450 500 550 600 650
350
(nm)
Figure 3: Ultraviolet-visible (Uv-vis) absorption spectrum of Irgacure 784 photoinitiator in toluene (left) and spectral irradiance distribution of the green LED light source.
stable product is the reaction of the isomer with a reactive component of the resin matrix [25].
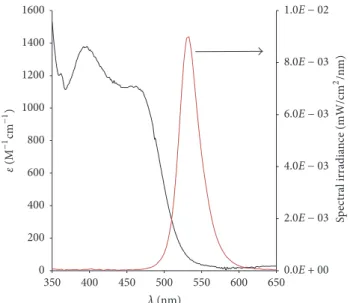
Since we used a green LED light source to initiate the photopolymerization process, knowing the characteristics of the lamp and sensitivity of the initiator in the green region of visible light is important. The transmittance spectrum of the LED lamp and the absorption spectrum of Irgacure 784, recorded in toluene, are presented in Figure 3.
From Figure 3, the LED light source emits in a relatively narrow range (490–590 nm), which can be assigned to the green region of visible light. The peak of emission was found to be at 531 nm, while the full width of the half maximum is 32 nm. Irgacure 784 has high absorption below 500 nm, which drops rapidly above this wavelength and is practi- cally transparent above 550 nm. However, the molar extinc- tion coefficient is still approximately 𝜀 90 M−1cm−1 at the emission maximum of the light source; therefore, we con- cluded that Irgacure 784 can be effectively used in combina- tion with a green LED light source.
3.2. Kinetic Investigation of the Photopolymerization. To gain insight into the photopolymerization process of our dental resin, kinetic measurements were performed. However, the chain polymerization of acrylate monomers during pho- topolymerization may involve very complex reactions; there- fore, it is only possible to work with simplified models.
The reaction rate (𝑑𝛼/𝑑𝑡) of a theoretical radical chain polymerization is usually given by
𝑑𝛼
𝑑𝑡 = 𝑘𝑝(𝑄𝐼𝑎
𝑘𝑡 )1/2(1 − 𝛼) , (1) where 𝛼 is the degree of conversion, 𝐼𝑎 is the intensity of absorbed light in moles of light quanta per liter-second,𝑄 is the quantum yield of initiation, and 𝑘𝑝 and 𝑘𝑡 are the rate constants for propagation and termination, respectively.
Equation (1) is only valid if we assume steady-state con- ditions. However, during propagation, the reaction kinetics are affected by autoacceleration, which is a consequence of altered diffusion. Since (1) is no longer applicable, the rate of reaction must be rewritten as a function of the radical concentration,[𝑅]:
𝑑𝛼
𝑑𝑡 = 𝑘𝑝(1 − 𝛼) [𝑅] , (2) where[𝑟] = ∑𝑛𝑖=0[𝑅𝑀𝑖].
Unfortunately, (2) does not consider that the glass tran- sition temperature(𝑇𝑔)of the restorative material must be higher than the maximum temperature that can be reached in the oral cavity, in order to prevent failures of the restorations due to thermal fatigue. As the photocuring progresses,𝑇𝑔of the network formed also increases, and the initially viscous liquid monomer mixture becomes a glassy solid. In this glassy network, the mobility of the monomers and radicals is greatly reduced, and due to this vitrification effect the reaction becomes diffusion controlled and the termination step of the polymerization is governed by the strong decrease in the molecular mobility. Maffezzoli and Terzi [26] proposed a simple expression, capable of describing the overall kinetic process by modelling the kinetic behavior of acrylates during photocuring conditions, using a simple pseudo-autocatalytic expression. According to Maffezzoli, (2) can be transformed to include the two effects of diffusion, autoacceleration and vitrification, as presented in
𝑑𝛼
𝑑𝑡 = 𝑘app𝛼𝑚(𝛼∞− 𝛼)𝑛(1 − 𝛼) , (3) where𝑘app = 𝑘app,𝑜√𝐼𝑜 is the apparent rate constant of the polymerization,𝐼𝑜is the initial light intensity,𝑚and𝑛are the fitting parameters, and𝛼∞represents the maximum degree of conversion. Notably, according to (3), the reaction rate converges to zero as the degree of conversion (𝛼) approaches 𝛼∞.
Raman spectroscopy is an appropriate technique to deter- mine the degree of conversion (𝛼) [27] for (3). Measurements were obtained before and after 150 s of irradiation, and the results are presented in the spectral range of 500–2000 cm−1 in Figure 4.
The vinyl double bonds (C=C) and aromatic ring quad- rant stretching vibration (Ph), which were used to calculate the conversion [27, 28], are observed at 1639 and 1610 cm−1, respectively, as indicated by the arrows. The highest intensity of the band, at 1639 cm−1, was observed for the samples before irradiation. The monomer has the largest number of C=C bonds before polymerization. The intensity of the C=C band decreased upon irradiation due to the consumption of the double bonds in the polymerization reaction, whereas the intensity of the Ph band remained constant during the irradiation. The conversion (𝛼) was calculated using the two- frequency technique, as a ratio between aliphatic C=C, at
Before irradiation After irradiation 0
50 100 150 200 250
Intensity
1000 1500 2000
500
Wavenumber (=G−1)
Figure 4: Representative Raman spectrum before and after irradia- tion with a LED light source.
1637 cm−1—𝐼C=C, and aromatic, at 1610 cm−1—𝐼Ph, carbon double bonds peaks based on
𝛼 = [1 − (𝐼C=C/𝐼Ph)polymer
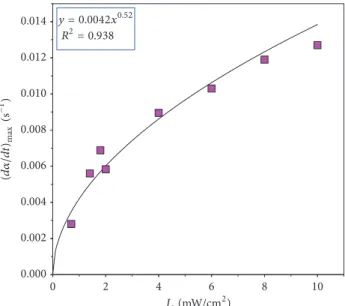
(𝐼C=C/𝐼Ph)monomer] × 100%. (4) Conversion data were calculated based on (4) from the Raman spectra recorded every second for 250 s in total, at light intensities between 0.7 and 10.0 mW/cm2. The measured reaction rates along with the calculated ones, per (3), were plotted as a function of the light intensity as shown in Figure 5.
From Figure 5, the experimental points can be well fitted using (3). The𝑥variable has a power of 0.52, which agrees with the square root dependency (𝐼𝑜1/2) of the reaction rate upon the light intensity. The applicability of the model, des- cribing the overall kinetic behavior, was tested by comparing the theoretical conversion data with the experimental data.
According to Figure 6, the conversion of photocuring shows a significant light intensity dependence.
Using a low value of 1.4 mW/cm2, only 50% conversion was obtained, taking more than 200 s to reach the final value. However, little difference was observed for 𝐼𝑜 of 6 and 10 mW/cm2, where a conversion of more than 70% was achieved after 150 s. For dental applications, higher light intensities are favorable; however these values fall well below those previously reported for CQ [16].
3.3. Resin Density, Water Swelling Experiments, and Physical Properties of the Cured Resins. An increase in density is a good indicator of resin formation because the crosslinked 3D structure is more compact than the mixture of the unreacted monomers, as with acrylate polymerization. The density of
y = 0.0042x0.52 R2= 0.938
2 4 6 8 10
0
Io(mW/=G2) 0.000
0.002 0.004 0.006 0.008 0.010 0.012 0.014
(d/dt)G;R(s−1)
Figure 5: The reaction rates(𝑑𝛼/𝑑𝑡)as a function of light intensity (𝐼𝑜). The solid line represents the fitted curve based on (3).
0 50 100
Time (s)
150 200
Conversion
0.7 0.6 0.5 0.4 0.3 0.2 0.1 0.8
0
10mW 6mW 3mW
1.4mW/=G2 /=G2 /=G2 /=G2
Figure 6: Comparison between the degree of conversion measured by Raman spectroscopy and that of calculated based on (3) at different light intensities.
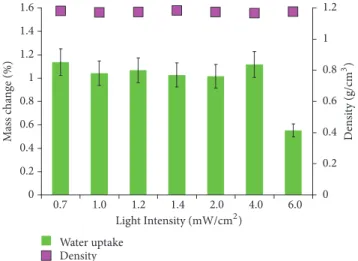
the monomer mixture and that of the cured samples were measured in a pycnometer, relative to water. The density increased from1.121 ± 0.001g/cm3in the monomer mixture to 1.16 to 1.18 g/cm3(the error was less than 2.5% in each case), as seen in Figure 7.
The resin densities did not show any significant variation, indicating similar structural properties and conversion of the monomers. For practical applicability, swelling experiments were performed in deionized water for seven days at ambient temperature. The samples did not uptake water, with a mass increase of about 1% in each case, which is favorable for
0.7 1.0 1.2 1.4 2.0 4.0 6.0
Water uptake Density 0
0.2 0.4 0.6 0.8 1 1.2 1.4 1.6
Mass change (%)
Light Intensity (mW/=G2)
0 0.2 0.4 0.6 0.8 1 1.2
Density (g/=G3)
Figure 7: Densities and water uptake of the photocured resins irradiated at different intensities after an irradiation time of 30 seconds.
0.7 1.0 1.2 1.4 2.0 4.0 6.0
after 1 week 0
5 10 15 20 25 30
Vickers microhardness (kgf/GG2 )
Light intensity (mW/=G2) after 24 h
Figure 8: Vickers microhardness values for the samples cured by a LED light source at different intensities, with an irradiation time of 30 seconds, after storage for 24 hours and one week.
in vivo applications. The cured samples were extracted in DMF to determine the conversion of the monomers. In each case, the weight loss was approximately 9-10%, indicating a conversion close to 90%, even with a light intensity as low as 1 mW/cm2. This result shows that Irgacure 784 can be considered effective when combined with the narrow- emission green LED.
Another important factor to consider for practical appli- cations is the surface hardness of the material. Therefore, the Vickers microhardness of the resins was measured after 24 h and after one week. The results are presented in Figure 8. It is important to measure the hardness of the samples at two different times to account for the effect of postcuring. That is, while most of the polymerization reaction occurs during the first minutes after irradiation, a significant portion of reaction may take place after curing [29].
Based on Figure 8, the Vickers hardness versus light inten- sity does not show any significant variation. Good hardness data were measured even near a light intensity of 1 mW/cm2. Notably, the increase in hardness after one-week storage is not significant, indicating high conversion at each inten- sity, which aligns well with the extraction results. Unfor- tunately, above an irradiation intensity of 6 mW/cm2, the surface properties of the samples rapidly deteriorated and became gel-like, making the hardness measurements unre- liable. This phenomenon may be accounted for by the large amount of Irgacure 784 photoinitiator (2% m/m) in the system. Although in the literature 2% (m/m) values can be found for both CQ and Irgacure 784 [30, 31], the latter is much more effective. Therefore, for further experiments, a 1.4 mW/cm2power density was used for the LED light source.
At first glance, the maximum Vickers hardness of this resin, 20–25 kgf/mm2, falls below that of the sound dentin, at 40 to 60 kgf/mm2. However, the physical properties of dental filling materials differ in many aspects, such as type and amount of filler, type and amount of initiators, and salinization of the filler particles. These effects may be more determinative than the nature of the copolymer matrix. In this study, we only focused on the properties of the pure resin.
Hardness is not the only property affecting the practical applicability of dental restorative materials. Mechanical pro- perties are a function of the degree of conversion and the 3D structure of the polymer network. As shown by Asmussen and Peutzfeldt [24], the diametral tensile strength, flexural strength, and modulus of the elasticity are also influ- enced by monomer composition. During sample prepara- tion, we used the optimal composition [24] of BisGMA : TEGDMA : UDMA in a weight ratio of 21.4 : 25.4 : 53.3 and only one light intensity setting at 1.4 mW/cm2, where the Vickers hardness value was found to be near the maximum.
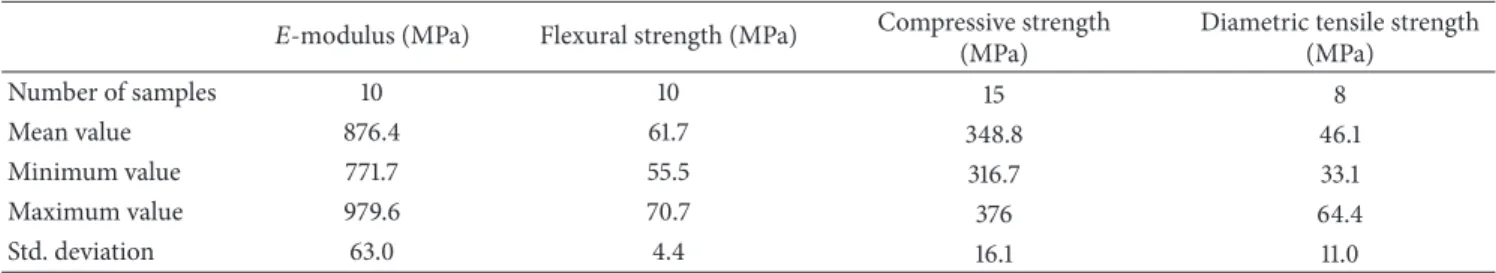
The measured mechanical properties are shown in Table 1. In addition, hypothesis tests, including independent sample𝑡- tests and the nonparametric Mann–Whitney tests, were run.
Commercial dental composite restoratives have a flexural strength in the range of 60 to 180 MPa [32, 33]. Our data falls within this range and is in good agreement with our pre- viously reported values obtained for BisGMA-based resins, using CQ as initiator [34]. The𝐸-modulus of about 0.9 GPa was found to be a bit lower than that previously reported for similar compositions [24, 35]. However, this is the pure resin and for practical applications the 𝐸-modulus can be significantly enhanced by the addition of filler materials [35].
Compressive strength has a particularly important role in the mastication process, since most of the masticatory forces are of compressive nature. The compressive strength values of our copolymer matrix are, at around 300 Mpa, in the order of those published by Galv˜ao et al. [36]. The high diametral tensile strength values may be attributed to the high degree of conversion of the methacrylate double bonds [37]. However, the diametral tensile test is only suitable for truly brittle materials. Materials that plastically deform would produce erroneous DTS values [38]. Without filler, our matrix may not be truly better and this could explain the high standard deviation values obtained during this measurement, whereas
Table 1: Mechanical properties of the photocured resins at 1.4 mW/cm2light intensity, with an irradiation time of 30 seconds. The sample size is denoted by𝑛.We used IBM SPSS Statistics Version 22 for all statistical calculations.
𝐸-modulus (MPa) Flexural strength (MPa) Compressive strength (MPa)
Diametric tensile strength (MPa)
Number of samples 10 10 15 8
Mean value 876.4 61.7 348.8 46.1
Minimum value 771.7 55.5 316.7 33.1
Maximum value 979.6 70.7 376 64.4
Std. deviation 63.0 4.4 16.1 11.0
the other mechanical measurements resulted in errors less than 10%.
4. Discussion
The applicability of a narrow-emission green LED light source, in combination with Irgacure 784 during the pho- tocuring of an acrylate-based dental resin, was studied. The resin contained a monomer mixture of BisGMA, TEGDMA, and UDMA in a previously reported 21.4 : 25.4 : 53.3 weight ratio for the best mechanical properties, and 2% m/m Irgacure 784 was used. Our LED light source emits in a relatively narrow range of 490 to 590 nm, with a peak emission at 531 nm. In this range, Irgacure 784 still has a molar extinction coefficient of approximately𝜀90 M−1cm−1 making it effective in combination with the green LED light source. The photopolymerization was performed at different light intensities ranging from 0.8 to 10 mW/cm2 and was followed by Raman spectroscopy in a polystyrene cuvette. The conversion (𝛼) was calculated using the two- frequency technique, as a ratio between aliphatic C=C and aromatic carbon double bond peaks. To handle the complex processes of photocuring for kinetic investigations, we used a modified version of Maffezzoli’s equation, which is capable of describing the overall kinetic process by modelling the kinetic behavior of acrylates during photocuring conditions, using a simple pseudo-autocatalytic expression. By includ- ing autoacceleration and vitrification in the expression, we obtained very good agreement between the experimental and calculated kinetic values. The maximum conversion values were found to be about 70–80% after 150 s irradiation time at light intensities of 6–10 mW/cm2.
For physical and mechanical investigations, specimen disks with dimensions of 2 mm by 10 mm were prepared using the same light intensities as used in the kinetic investigations.
The density of the cured resins was found to increase compared to that of the monomers and was found to be nearly constant ( ∼ 1.17–1.19 g/cm3) with light intensity. Extraction with DMF revealed a weight loss of less than 10% for each sample, indicating approximately 90% conversion for these thin disks even at a light intensity of about 1 mW/cm2. The cured resins did not swell in water, took up less than 1%
water in a week, and therefore may be suitable for dental applications.
Good Vickers microhardness values of 20–25 kgf/mm2 were obtained, even at low light intensities. This intensity
value is more than one magnitude lower than those used in dental practice. However, at light intensities over 6 mW/cm2, the hardness values deteriorated rapidly potentially due to the high concentration of Irgacure 784 and the thin disk samples.
The compressive strength and diametric tensile strength of the resins, cured at 1.4 mW/cm2 light intensity, were in the range of 300 MPa and 30 MPa, in good agreement with those of practically applied dental restorative composites. The flexural strength was found to be about 60 MPa and the𝐸- modulus was approximately 0.9 GPa.
Conflicts of Interest
The authors declare no conflicts of interest.
Acknowledgments
This work was financially supported by NFKI (National Research, Development and Innovation Office, Hungary) (Grant K-116465), GINOP-2.3.2.-15-2016-00011, GINOP- 2.3.2.-15-2016-00022, and GINOP-2.3.2-15-2016-00041. The work/publication is supported by the EFOP-3.6.1-16-2016- 00022 project. The project is cofinanced by the European Union and the European Social Fund. Furthermore, this paper was also supported by the J´anos Bolyai Research Scholarship of the Hungarian Academy of Sciences (Mikl´os Nagy).
References
[1] M. Tehfe, F. Louradour, J. Lalev´ee, and J. Fouassier, “Photopoly- merization Reactions: On the Way to a Green and Sustainable Chemistry,”Applied Sciences, vol. 3, no. 2, pp. 490–514, 2013.
[2] B. C. Gross, J. L. Erkal, S. Y. Lockwood, C. Chen, and D. M.
Spence, “Evaluation of 3D printing and its potential impact on biotechnology and the chemical sciences,”Analytical Chemistry, vol. 86, no. 7, pp. 3240–3253, 2014.
[3] M. C. Gather, A. K¨ohnen, A. Falcou, H. Becker, and K. Meer- holz, “Solution-processed full-color polymer organic light- emitting diode displays fabricated by direct photolithography,”
Advanced Functional Materials, vol. 17, no. 2, pp. 191–200, 2007.
[4] E. Suhir, Y. C. Lee, and C. P. Wong,Micro- and Opto-Electronic Materials and Structures: Physics, Mechanics, Design, Reliability, Packaging, Springer US, New York, NY. USA, 2007.
[5] T. J. Trout, J. J. Schmieg, W. J. Gambogi, and A. M. Weber, “Opti- cal photopolymers: Design and applications,”Advanced Materi- als, vol. 10, no. 15, pp. 1219–1224, 1998.
[6] H. Bian, J. Yang, N. Zhang, Q. Wang, Y. Liang, and D. Dong,
“Ultrathin free-standing polymer membranes with chemically responsive luminescence via consecutive photopolymeriza- tions,”Polymer Chemistry, vol. 7, no. 5, pp. 1191–1196, 2016.
[7] S. Baudis, F. Nehl, S. C. Ligon et al., “Elastomeric degradable biomaterials by photopolymerization-based CAD-CAM for vascular tissue engineering,”Biomedical Materials, vol. 6, no. 5, Article ID 055003, 2011.
[8] P. Bruno, G. Malucelli, B. Tylkowski, J. Ferr´e, and M. Giam- berini, “Acrylic microspheres as drug-delivery systems: Synthe- sis through in situ microemulsion photoinduced polymeriza- tion and characterization,”Polymer International, vol. 62, no. 2, pp. 304–309, 2013.
[9] F. H. Coelho-de-Souza, D. S. Gonc¸alves, M. P. Sales et al.,
“Direct anterior composite veneers in vital and non-vital teeth:
A retrospective clinical evaluation,”Journal of Dentistry, vol. 43, no. 11, pp. 1330–1336, 2015.
[10] U. Erdemir, H. S. Sancakli, B. C. Yaman, S. Ozel, T. Yucel, and E.
Yildiz, “Clinical comparison of a flowable composite and fissure sealant: A 24-month split-mouth, randomized, and controlled study,”Journal of Dentistry, vol. 42, no. 2, pp. 149–157, 2014.
[11] K. L. Van Landuyt, J. Snauwaert, J. De Munck et al., “Systematic review of the chemical composition of contemporary dental adhesives,”Biomaterials, vol. 28, no. 26, pp. 3757–3785, 2007.
[12] Z. C. Li and S. N. White, “Mechanical properties of dental luting cements.,”The Journal of Prosthetic Dentistry, vol. 81, no. 5, pp.
597–609, 1999.
[13] R. B. Price, J. L. Ferracane, and A. C. Shortall, “Light-Curing Units,”Journal of Dental Research, vol. 94, no. 9, pp. 1179–1186, 2015.
[14] W. D. Cook, “Photopolymerization kinetics of dimethacrylates using the camphorquinone/amine initiator system,” Polymer Journal, vol. 33, no. 3, pp. 600–609, 1992.
[15] Z. Kucybała, M. Pietrzak, J. Paczkowski, L.- ˚A. Lind´en, and J. F. Rabek, “Kinetic studies of a new photoinitiator hybrid system based on camphorquinone-N-phenylglicyne derivatives for laser polymerization of dental restorative and stereolitho- graphic (3D) formulations,”Polymer Journal, vol. 37, no. 20, pp.
4585–4591, 1996.
[16] E. A. Kamoun and H. Menzel, “Crosslinking behavior of dex- tran modified with Hydroxyethyl methacrylate upon irradia- tion with visible light-effect of concentration, coinitiator type, and solvent,”Journal of Applied Polymer Science, vol. 117, no. 6, pp. 3128–3138, 2010.
[17] D. Zhou and Y. Ito, “Visible light-curable polymers for biomedi- cal applications,”SCIENCE CHINA Chemistry, vol. 57, no. 4, pp.
510–521, 2014.
[18] C. Decker, “Photoinitiated crosslinking polymerisation,”
Progress in Polymer Science, vol. 21, no. 4, pp. 593–650, 1996.
[19] H. Kitano, K. Ramachandran, N. B. Bowden, and A. B. Scran- ton, “Unexpected visible-light-induced free radical photopoly- merization at low light intensity and high viscosity using a titanocene photoinitiator,”Journal of Applied Polymer Science, vol. 128, no. 1, pp. 611–618, 2013.
[20] D.-H. Shin and H. R. Rawls, “Degree of conversion and color stability of the light curing resin with new photoinitiator systems,”Dental Materials, vol. 25, no. 8, pp. 1030–1038, 2009.
[21] K. D. Jandt and R. W. Mills, “A brief history of LED photopoly- merization,”Dental Materials, vol. 29, no. 6, pp. 605–617, 2013.
[22] W. J. Dunn and A. C. Bush, “A comparison of polymerization by light-emitting diode and halogen-based light-curing units,”
The Journal of the American Dental Association, vol. 133, no. 3, pp. 335–341, 2002.
[23] M. A. Gauthier, I. Stangel, T. H. Ellis, and X. X. Zhu, “Oxygen inhibition in dental resins,”Journal of Dental Research, vol. 84, no. 8, pp. 725–729, 2005.
[24] E. Asmussen and A. Peutzfeldt, “Influence of UEDMA, BisGMA and TEGDMA on selected mechanical properties of experi- mental resin composites,”Dental Materials, vol. 14, no. 1, pp. 51–
56, 1998.
[25] D. Sabol, M. R. Gleeson, S. Liu, and J. T. Sheridan, “Photoini- tiation study of Irgacure 784 in an epoxy resin photopolymer,”
Journal of Applied Physics, vol. 107, no. 5, Article ID 053113, 2010.
[26] A. Maffezzoli and R. Terzi, “Effect of irradiation intensity on the isothermal photopolymerization kinetics of acrylic resins for stereolithography,”Thermochimica Acta, vol. 321, no. 1-2, pp.
111–121, 1998.
[27] M. A. Gauthier, I. Stangel, T. H. Ellis, and X. X. Zhu, “A new method for quantifying the intensity of the C=C band of dimethacrylate dental monomers in their FTIR and Raman spectra,”Biomaterials, vol. 26, no. 33, pp. 6440–6448, 2005.
[28] Z. Okulus, T. Buchwald, M. Szybowicz, and A. Voelkel, “Study of a new resin-based composites containing hydroxyapatite filler using Raman and infrared spectroscopy,”Materials Chemistry and Physics, vol. 145, no. 3, pp. 304–312, 2014.
[29] M. Par, O. Gamulin, D. Marovic, E. Klaric, and Z. Tarle, “Effect of temperature on post-cure polymerization of bulk-fill com- posites,”Journal of Dentistry, vol. 42, no. 10, pp. 1255–1260, 2014.
[30] T. Guimar˜aes, L. F. Schneider, R. R. Braga, and C. S. Pfei- fer, “Mapping camphorquinone consumption, conversion and mechanical properties in methacrylates with systematically varied CQ/amine compositions,”Dental Materials, vol. 30, no.
11, pp. 1274–1279, 2014.
[31] Y. M. Chang, S. C. Yoon, and M. Han, “Photopolymerization of aromatic acrylate containing phosphine oxide backbone and its application to holographic recording,”Optical Materials, vol.
30, no. 4, pp. 662–668, 2007.
[32] S. M. Chung, A. U. J. Yap, S. P. Chandra, and C. T. Lim, “Flexural strength of dental composite restoratives: Comparison of biaxial and three-point bending test,”Journal of Biomedical Materials Research Part B: Applied Biomaterials, vol. 71, no. 2, pp. 278–283, 2004.
[33] S. Dos Santos, M. R. Moys´es, C. E. P. Alcˆantara, J. C. R. Ribeiro, and J. G. R. Ribeiro, “Flexural strength of a composite resin light cured with different exposure modes and immersed in ethanol or distilled water media,”Journal of Conservative Dentistry, vol.
15, no. 4, pp. 333–336, 2012.
[34] M. Szaloki, J. Gall, K. Bukovinszki, J. Borbely, and C. Hege- dus, “Synthesis and characterization of cross-linked polymeric nanoparticles and their composites for reinforcement of pho- tocurable dental resin,”Reactive and Functional Polymers, vol.
73, no. 3, pp. 465–473, 2013.
[35] H. Zhang and B. W. Darvell, “Mechanical properties of hydrox- yapatite whisker-reinforced bis-GMA-based resin composites,”
Dental Materials, vol. 28, no. 8, pp. 824–830, 2012.
[36] M. R. Galv˜ao, S. G. F. R. Caldas, S. Calabrez-Filho et al., “Com- pressive strength of dental composites photo-activated with dif- ferent light tips,”Laser Physics, vol. 23, no. 4, Article ID 045604, 2013.
[37] E. ASMUSSEN and K. D. JORGENSEN, “Fatigue strength of some resinous materials,”European Journal of Oral Sciences, vol.
90, no. 1, pp. 76–79, 1982.
[38] R. W. Penn, R. G. Craig, and J. A. Tesk, “Diametral tensile strength and dental composites,”Dental Materials, vol. 3, no. 1, pp. 46–48, 1987.
Hindawi
www.hindawi.com Volume 2018
Active and Passive Electronic Components
Hindawi
www.hindawi.com Volume 2018
Shock and Vibration
Hindawi
www.hindawi.com Volume 2018
High Energy PhysicsAdvances in
Hindawi Publishing Corporation
http://www.hindawi.com Volume 2013
Hindawi www.hindawi.com
World Journal
Volume 2018
Acoustics and VibrationAdvances in
Hindawi
www.hindawi.com Volume 2018
Hindawi
www.hindawi.com Volume 2018
Advances in
Condensed Matter Physics
Optics
International Journal of
Hindawi
www.hindawi.com Volume 2018
Hindawi
www.hindawi.com Volume 2018
Astronomy
Advances inAntennas and Propagation
International Journal of
Hindawi
www.hindawi.com Volume 2018
Hindawi
www.hindawi.com Volume 2018
Geophysics
Advances in Optical Technologies
Hindawi
www.hindawi.com Volume 2018
and Biomechanics
Hindawi
www.hindawi.com Volume 2018
Advances in OptoElectronics
Hindawi
www.hindawi.com Volume 2018
Hindawi
www.hindawi.com Volume 2018
Mathematical PhysicsAdvances in
Hindawi
www.hindawi.com Volume 2018
Chemistry
Hindawi
www.hindawi.com Volume 2018
Journal of
Chemistry
Hindawi
www.hindawi.com Volume 2018
Advances in
Physical Chemistry
International Journal of
Rotating Machinery
Hindawi
www.hindawi.com Volume 2018
Hindawi www.hindawi.com
Engineering
Volume 2018
Submit your manuscripts at www.hindawi.com
View publication stats View publication stats