DOI: 10.1556/066.2018.47.1.3
VALIDATION OF A GAS CHROMATOGRAPHY-FLAME IONIZATION METHOD FOR QUALITY CONTROL AND SPOILAGE DETECTION
IN WINE AND CIDER
J.J. MANGAS*, R. RODRÍGUEZ and B. SUÁREZ
Servicio Regional de Investigación y Desarrollo Agroalimentario (SERIDA), Apdo. 13, 33300 Villaviciosa-Asturias. Spain
(Received: 16 February 2017; accepted: 13 June 2017)
A GC-FID method for major volatile analysis in cider and wine was validated under the requirements of the ISO/
IEC 17025 regulation using a split mode injection. This method presented a good linearity (R2>0.999, Cm>99%), a wide range of calibration, the maximum random errors for repeatability and intermediate precision were 5% and 8%, respectively, and the maximum limit of quantifi cation and limit of detection were 14.1 mg l–1 and 4.6 mg l–1, respectively. Trueness, expressed as recovery (%), was successfully validated by means of two different methods, standard addition (92–110%) and comparison against reference materials (93–115%). Expanded uncertainty estimated at 95% confi dence level ranged between 11% for methanol and 7% for allyl alcohol. The validated method was successfully applied for the analysis of major volatiles in ciders and wines, and to detect yeast and lactic acid bacteria spoilage.
Keywords: validation, GC, volatile, cider, wine
Major volatile fraction in fermented beverages such as wine and cider is constituted by alcohols (methanol, 2-butanol, 1-propanol, iso-butanol, allyl alcohol, 1-butanol, iso- pentanols, 2-phenylethanol), carbonyl compounds (acetaldehyde and acetoin), and ethyl acetate (PICINELLI et al., 2000; ANTÓN et al., 2014). Analysis of major volatile compounds in fermented beverages is necessary to control the bioprocesses transforming grape and apple juice into wine and cider, respectively. Likewise, as these molecules infl uence aroma quality, their adequate control allows us to obtain quality fermented products. The most important ones are ethyl acetate (glue, solvent or nail polish remover smell), 2-phenylethanol (rose smell) (BUDIĆ-LETO et al., 2010), acetoin (butter/cream aroma notes) (BARTOWSKY &
PRETORIUS, 2009), and higher alcohols or fusel alcohols (strong and pungent smell and taste) (LAMBRECHTS & PRETORIUS, 2000).
Major volatiles are commonly analysed in our laboratory by direct GC-FID with splitless injection mode. Nevertheless, this method presents some drawbacks, such as fronting of the acetoin’s peak and loss of resolution (<1.5) of the couple ethyl acetate/methanol. In order to overcome it, a change in the injection mode by using split injection mode could be considered.
The aim of this work was to validate a GC-FID analytical method for the analysis of major volatile compounds in cider and wine matrices under the requirements of ISO/IEC 17025 regulation (AENOR, 2005), by using a direct injection of the sample in the split mode.
This method was then applied to perform the quality control of ciders and wines, and to detect the action of spoilage microorganisms.
* To whom correspondence should be addressed.
E-mail: jjmangas@serida.org
18
1. Materials and methods
1.1. Raw and reference materials
Two kinds of samples were employed in the validation procedure, one cider and one red wine. In order to obtain the appropriate matrices for trueness study by the standard addition method, samples were dearomatised under vacuum at 35 ºC. Subsequently, the initial alcoholic strength was recovered by ethanol addition. Both dearomatised matrices were employed to make the corresponding stock solution containing major volatiles, and the subsequent dilutions (1:100, 1:20, and 1:10) to reach the whole calibration range.
Six reference materials (RM) were employed, namely: RM1 (red wine with reference:
39-0117); RM2 (red wine with reference: wines–1/2014); RM3 (white wine with reference:
44-0217); RM4 (white wine with reference: 46-0217); RM5 (red wine with reference:
38-0117); and RM6 (red wine with reference: 34-0117). RM1, RM3, RM4, RM5, and RM6 were supplied by Bipea (International Bureau for Analytical Studies), an international non- profi t association of testing laboratories, and RM2 was supplied by the Ministry of Agriculture, Food and Environment (Spain).
1.2. Chemicals
Major volatile standards (ethyl acetate, methanol, 2-butanol, 1-propanol, i-butanol, allyl alcohol, 1-butanol, 3-methyl-1-butanol, acetoin, and 2-phenylethanol) were supplied by Sigma-Aldrich (Madrid, Spain). Absolute ethanol was supplied by Merck (Darmstadt, Germany). All chemicals were of chromatographic quality.
1.3. Chromatographic conditions and equipment
Major volatiles were analysed using a GC 6890N Agilent Technologies system provided with a wide bore capillary FFAP (nitroterephthalic acid modifi ed polyethylene glycol) column (TR-FFAP 30 m × 0.53 mm i.d.; phase thickness, 1 μm) joined with a polar precolumn (Tracsil Polar 1 m × 0.53 mm i.d.; phase thickness, 3 μm) supplied by Tecknokroma (Barcelona, Spain). Chromatographic conditions have been described in PICINELLI and co- workers (2000). The microfi ltered samples were directly injected (1 μl) into the chromatograph in split (split ratio 1/5) mode.
1.4. Preparation of solutions
In order to construct calibration curves, a stock solution was prepared by dissolving appropriate weights of major volatiles (between 0.0900–0.4000 g) in 100 ml of 5% (v/v) ethanol solution. Seven calibration standards were prepared by properly diluting with 5%
ethanol solution (v/v) from the aforementioned stock solution [fi rst two calibration points (1:10; 1:20)] or from the standard dilution (1:20) to reach the next fi ve calibration points (1:2;
1:4; 1:10; 1:20; 1:50).
1.5. Validation procedure
The newly developed method was validated in terms of linearity and range, precision, trueness, accuracy, and quantifi cation and detection limits, in accordance with the guide for the validation and quality control of OIV (2005) and the EUROPEAN CO-OPERATION FOR
ACCREDITATION (2013). Specifi city was not evaluated in accordance to regulatory recommendations such FDA (2003).
The trueness was determined by two methods: a) standard addition and b) reference materials.
a) For each analyte and matrix (red wine and cider) three addition levels covering the whole calibration range were prepared. Blank (Cb) and spiked sample (CS) were analysed by duplicate by two analysts on 10 different days (fi ve days each analyst). Average (A), standard deviation of reproducibility of the average (SA), and recovery (
CsCb
/AC; AC=added concentration) were computed.b) Trueness [assigned value of reference material (AV)-laboratory value (LV)] and standard uncertainties of the laboratory value (uL) and the reference material (uRM) were computed. Total standard uncertainty (uT) was computed as the square root of the sum of squares of both uncertainties (uT uL2uRM2). That could be done, because the laboratory values were not used either in the RM standard uncertainty estimation or the calculation of the assigned value of the RM (ISO, 2005; THOMPSON, 2016). Subsequently, the tolerance interval was computed from the expanded total uncertainty (UT= ±2uT) at 95% confi dence level. Absolute value of trueness was validated when it was lower than the semi-interval (2uT). Trueness was also computed as percentage of recovery [
LV AV
].The precision of the proposed method was determined in repeatability and intermediate precision (we will use reproducibility term instead of intermediate precision to facilitate formula explanation) conditions. Repeatability of the method was computed from the duplicates analysed daily, and for reproducibility, ten new samples, fi ve for each matrix (cider and red wine), were analysed by two analysts on fi ve different days (three days/analyst 1; two days/analyst 2). Relative standard deviation of reproducibility (RSDR) for each sample and the average relative standard deviation of reproducibility (ARSDR) of ten samples were computed.
In order to estimate accuracy, two uncertainty types were considered. Type A uncertainty was used when several independent observations were available. On the contrary, we computed type B uncertainty when independent observations were not available, and probability distribution of the variable was known.
Combined standard uncertainty (uC) for each addition level was computed as root of the sum of the squares of the following standard uncertainties:
a) Type A uncertainty of the average (uA) (uASA N ) and reproducibility (uR) (
R R
R S
u N ; SR= standard deviation of reproducibility; NR=number of samples that are analysed daily in reproducibility conditions; in our laboratory NR=1). Standard deviation of reproducibility corresponding to addition level i (SRi) was estimated from the ARSDR and the average (Ai) of addition level i [SRi
ARSDR100
i].b) Type B uncertainty (uB C 3) (rectangular distribution), where correction (C) was estimated from BIAS [AC
Cs C
b
]. This uncertainty takes part in the combined
standard uncertainty estimation if the compatibility index (CI) is lower than or equal to 2,
where CI = [AC – (Cs – Cb)] uAC2SA2N ; N= number of trials.
c) Uncertainty of added concentration (uAC).
Then, we computed the tolerance interval (UC ) at 95% (α=0.05) confiuC dence level in agreement with GUM (2008).
Relative expanded uncertainty of addition level i (Ui, %) was computed as percentage from the semi-interval (UCi) and the average (Ai) of addition level i. Ui
% UCiAi
100.20
2. Results and discussion
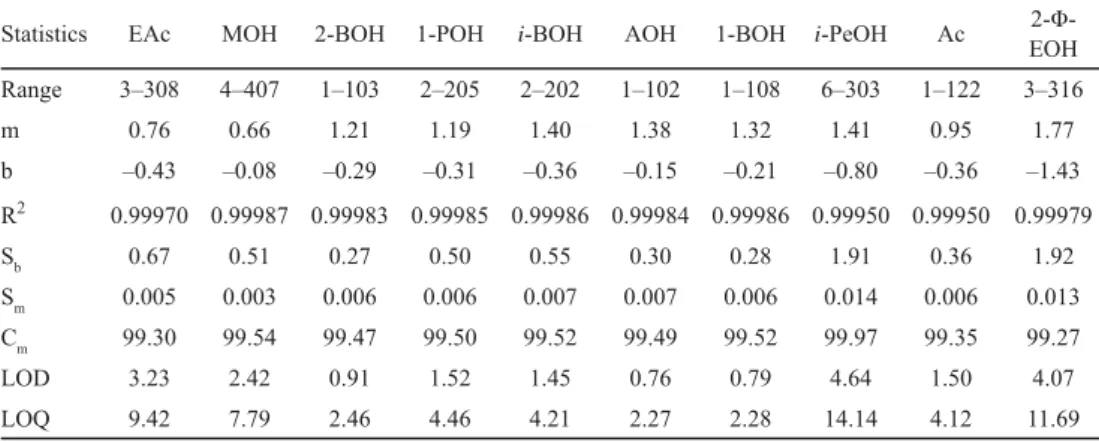
2.1. Linearity, calibration range, and detection and quantifi cation limits
Three calibrations were done in reproducibility conditions (two analysts, two columns [NF26931 and NF26809 batch numbers), and three different times (t1, t2 and t3)]. Statistics [R2, range, standard deviation of intercept (Sb), and standard deviation of slope (Sm)] and calibration parameters [slope (m), intercept (b), linearity coeffi cient ( 1 100
m
Cm Sm ), limit of quantifi cation (LOQ) and limit of detection (LOD)] of the calibration employed for validation studies are shown in Table 1.
Determinatio n coeffi cient (R2) and linearity (Cm) computed for all analytes in each calibration were higher than 0.999 and 99%, respectively, and the relative standard deviation of slope (RSDm) was lower than 9%.
LOD was evaluated from the intercept variance (S2b), the slope (m), and a non-centrality parameter (δ(α, β, n-2)) obtained from the non-central t-distribution taking into account errors type I (α) and II (β) (CLAYTON et al., 1987; LAVAGNINI & MAGNO, 2007). The intercept variance was computed from dispersion characteristics (residual variance) of the calibration line and the leverage. LOD and LOQ were computed as 3-fold (δ(0.1, 0.1, 5)) and 10-fold standard deviation of intercept, respectively. Taking into account calibration errors, LOD ranged between 0.8 and 4.6 mg l–1 and LOQ between 2.3 and 14.1 mg l–1 (Table 1).
Table 1. Calibration model used for validation (analyst 2; batch number of column: NF26809; calibration time: t2)
Statistics EAc MOH 2-BOH 1-POH i-BOH AOH 1-BOH i-PeOH Ac 2-Φ-
EOH
Range 3–308 4–407 1–103 2–205 2–202 1–102 1–108 6–303 1–122 3–316
m 0.76 0.66 1.21 1.19 1.40 1.38 1.32 1.41 0.95 1.77
b –0.43 –0.08 –0.29 –0.31 –0.36 –0.15 –0.21 –0.80 –0.36 –1.43
R2 0.99970 0.99987 0.99983 0.99985 0.99986 0.99984 0.99986 0.99950 0.99950 0.99979
Sb 0.67 0.51 0.27 0.50 0.55 0.30 0.28 1.91 0.36 1.92
Sm 0.005 0.003 0.006 0.006 0.007 0.007 0.006 0.014 0.006 0.013
Cm 99.30 99.54 99.47 99.50 99.52 99.49 99.52 99.97 99.35 99.27
LOD 3.23 2.42 0.91 1.52 1.45 0.76 0.79 4.64 1.50 4.07
LOQ 9.42 7.79 2.46 4.46 4.21 2.27 2.28 14.14 4.12 11.69
EAc: ethyl acetate; MOH: methanol; 2-BOH: 2-butanol; 1-POH: 1-propanol; i-BOH: i-butanol; AOH: allyl alcohol;
1-BOH: 1-butanol; i-PeOH: i-pentanol; Ac: Acetoin; 2-Φ-EOH: 2-phenylethanol; range (mg l–1); m: slope; b:
intercept; R2: determination coeffi cient; Sb: standard deviation of intercept; Sm: standard deviation of slope; Cm: linearity coeffi cient; LOD: limit of detection (mg l–1); LOQ: limit of quantifi cation (mg l–1).
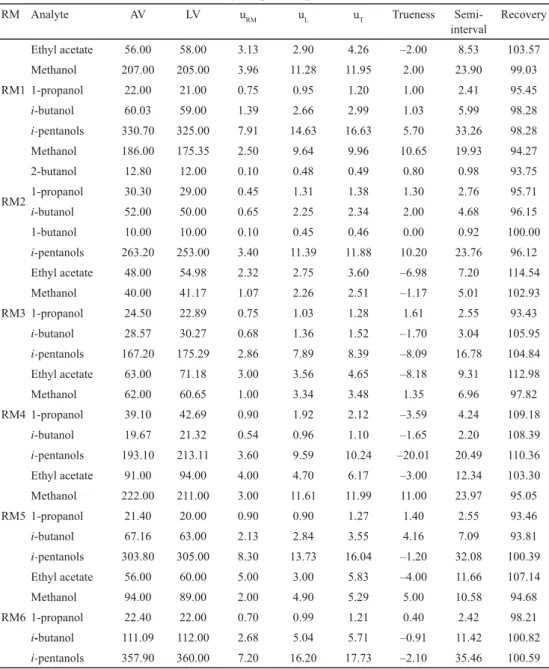
2.2. Trueness
When the standard addition method was employed, recoveries were included in the 92–110%
range.
Table 2 shows the results of the trueness validation for those analytes where RM was available. BIAS (trueness in absolute value) computed was lower than the semi-interval at a
confi dence level of 95%. Recoveries [
LV AV
100] ranged between 93 and 115%(Table 2).
Taking into account the recoveries obtained by means of standard addition and RM methods, we can consider that the split GC method presents an adequate trueness for analytical purposes.
Table 2. Trueness validation by comparison against Reference Materials (RM)
RM Analyte AV LV uRM uL uT Trueness Semi-
interval
Recovery
RM1
Ethyl acetate 56.00 58.00 3.13 2.90 4.26 –2.00 8.53 103.57
Methanol 207.00 205.00 3.96 11.28 11.95 2.00 23.90 99.03
1-propanol 22.00 21.00 0.75 0.95 1.20 1.00 2.41 95.45
i-butanol 60.03 59.00 1.39 2.66 2.99 1.03 5.99 98.28
i-pentanols 330.70 325.00 7.91 14.63 16.63 5.70 33.26 98.28
RM2
Methanol 186.00 175.35 2.50 9.64 9.96 10.65 19.93 94.27
2-butanol 12.80 12.00 0.10 0.48 0.49 0.80 0.98 93.75
1-propanol 30.30 29.00 0.45 1.31 1.38 1.30 2.76 95.71
i-butanol 52.00 50.00 0.65 2.25 2.34 2.00 4.68 96.15
1-butanol 10.00 10.00 0.10 0.45 0.46 0.00 0.92 100.00
i-pentanols 263.20 253.00 3.40 11.39 11.88 10.20 23.76 96.12
RM3
Ethyl acetate 48.00 54.98 2.32 2.75 3.60 –6.98 7.20 114.54
Methanol 40.00 41.17 1.07 2.26 2.51 –1.17 5.01 102.93
1-propanol 24.50 22.89 0.75 1.03 1.28 1.61 2.55 93.43
i-butanol 28.57 30.27 0.68 1.36 1.52 –1.70 3.04 105.95
i-pentanols 167.20 175.29 2.86 7.89 8.39 –8.09 16.78 104.84
RM4
Ethyl acetate 63.00 71.18 3.00 3.56 4.65 –8.18 9.31 112.98
Methanol 62.00 60.65 1.00 3.34 3.48 1.35 6.96 97.82
1-propanol 39.10 42.69 0.90 1.92 2.12 –3.59 4.24 109.18
i-butanol 19.67 21.32 0.54 0.96 1.10 –1.65 2.20 108.39
i-pentanols 193.10 213.11 3.60 9.59 10.24 –20.01 20.49 110.36
RM5
Ethyl acetate 91.00 94.00 4.00 4.70 6.17 –3.00 12.34 103.30
Methanol 222.00 211.00 3.00 11.61 11.99 11.00 23.97 95.05
1-propanol 21.40 20.00 0.90 0.90 1.27 1.40 2.55 93.46
i-butanol 67.16 63.00 2.13 2.84 3.55 4.16 7.09 93.81
i-pentanols 303.80 305.00 8.30 13.73 16.04 –1.20 32.08 100.39
RM6
Ethyl acetate 56.00 60.00 5.00 3.00 5.83 –4.00 11.66 107.14
Methanol 94.00 89.00 2.00 4.90 5.29 5.00 10.58 94.68
1-propanol 22.40 22.00 0.70 0.99 1.21 0.40 2.42 98.21
i-butanol 111.09 112.00 2.68 5.04 5.71 –0.91 11.42 100.82
i-pentanols 357.90 360.00 7.20 16.20 17.73 –2.10 35.46 100.59
AV: assigned value of RM (mg l–1); LV: laboratory value (mg l–1); uRM (mg l–1): standard uncertainty of RM; uL (mg l–1): standard uncertainty of laboratory; uT (mg l–1): total standard uncertainty; Trueness and semi-interval (mg l–1); recovery (%).
22
2.3. Precision. Repeatability (r) and reproducibility (R)
Maximum relative standard deviation (RSDr) in repeatability conditions was 5%, and maximum relative standard deviation for reproducibility (RSDR) was 8%.
HORWITZ equation for predicted RSDR (PRSDR) allows us to compute random error in reproducibility conditions from analyte concentration (HORWITZ & ALBERT, 2006). Empirical acceptable range for RSDr/PRSDR value would be 0.25–1.33. HorRat values computed were included in the range 0.7–1.0, thus, we can conclude that the random error of reproducibility computed is adequate for analytical purposes.
2.4. Accuracy
Average (computed from the three addition levels of both matrices) of the relative expanded uncertainty (U, %) ranged between 7 and 11%. Allyl alcohol presented the lowest and methanol the highest average total error. Maximum total error for the GC method was 13%.
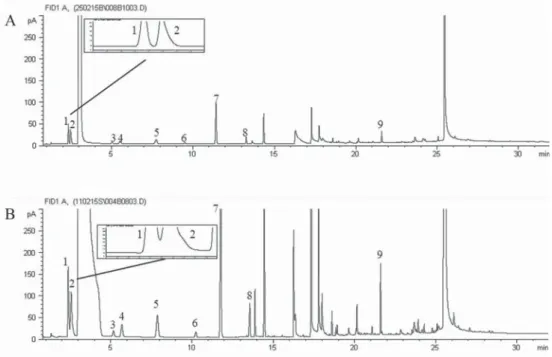
2.5. Application of the analytical procedure to cider and wine samples
Figure 1 shows two chromatograms of a red wine obtained by split (A) or splitless injection (B). We can see that resolution of the couple ethyl acetate/methanol is better in the split injection (Rs= 1.78) than for the splitless mode (RS=0.74). Likewise, asymmetry (A) of acetoin was improved by the split injection (A=0.96) in comparison with the splitless mode (A=1.69), which could be related to column overloading when the splitless injection mode is used.
Fig. 1. Major volatile chromatogram of a red wine in split (A) and splitless injection mode (B). 1: ethyl acetate;
2: methanol; 3: 2-butanol; 4: 1-propanol; 5: i-butanol; 6: 1-butanol; 7: i-pentanols; 8: acetoin; 9: 2-phenylethanol.
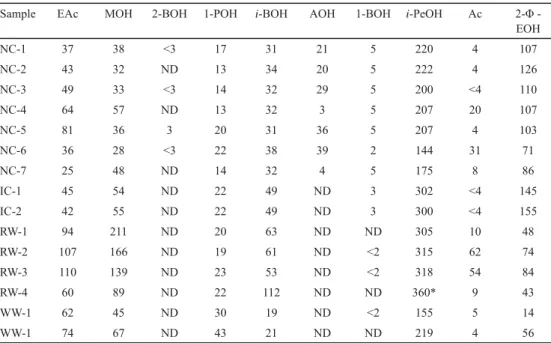
Table 3. Major volatiles (mg l–1) in ciders and wines (split GC)
Sample EAc MOH 2-BOH 1-POH i-BOH AOH 1-BOH i-PeOH Ac 2-Φ -
EOH
NC-1 37 38 <3 17 31 21 5 220 4 107
NC-2 43 32 ND 13 34 20 5 222 4 126
NC-3 49 33 <3 14 32 29 5 200 <4 110
NC-4 64 57 ND 13 32 3 5 207 20 107
NC-5 81 36 3 20 31 36 5 207 4 103
NC-6 36 28 <3 22 38 39 2 144 31 71
NC-7 25 48 ND 14 32 4 5 175 8 86
IC-1 45 54 ND 22 49 ND 3 302 <4 145
IC-2 42 55 ND 22 49 ND 3 300 <4 155
RW-1 94 211 ND 20 63 ND ND 305 10 48
RW-2 107 166 ND 19 61 ND <2 315 62 74
RW-3 110 139 ND 23 53 ND <2 318 54 84
RW-4 60 89 ND 22 112 ND ND 360* 9 43
WW-1 62 45 ND 30 19 ND <2 155 5 14
WW-1 74 67 ND 43 21 ND ND 219 4 56
EAc: ethyl acetate; MOH: methanol; 2-BOH: 2-butanol; 1-POH: 1-propanol; i-BOH: i-butanol; AOH: allyl alcohol;
1-BOH: 1-butanol; i-PeOH: i-pentanols; Ac: acetoin; 2-Φ-EOH: 2-phenylethanol; ND: not detected; NC: natural cider; IC: ice cider; RW: red wine; WW: white wine; *: out of calibration range
The validated split GC method was applied to analyse several cider and wine samples, namely seven natural ciders, two ice ciders, four red wines, and two white wines. Results obtained are shown in Table 3. As can be seen, the composition of major volatiles is very different depending on the kind of sample considered. Allyl alcohol and 2-butanol were only detected in natural ciders. In this cider type, dehydration of alcohols (glycerol and meso-2,3- butanediol) and their subsequent reduction usually occurs as a consequence of lactic acid bacteria metabolism. 1-Butanol is a varietal aroma in apple, so it was mainly detected in ciders. This alcohol has been occasionally reported in minor amounts in wines, since it can be synthesised by yeasts from amino acids (SI et al., 2014); in fact, a minor amount was detected in some wine samples. On the other hand, the high 2-phenylethanol concentration found in ciders compared to wines is noticeable. High levels of this aromatic alcohol may not derive from de novo synthesis by yeasts according to the Ehrlich pathway, but from their glycosidic conjugates, which are liberated and cleaved during fermentation (SCHWAB &
SCHREIER, 1990). The high sugar concentration of ice ciders could justify their higher concentrations of iso-pentanols and 2-phenylethanol compared to natural ciders. Red wines and ice ciders presented iso-pentanols levels higher than their threshold values unlike iso- butanol and propanol. Red wine presented the highest methanol concentration, which is related to extraction and maceration processes carried out in the making of this wine type.
Two red wines presented the highest concentration of acetoin, though lower than its threshold value, and ethyl acetate. These results could be explained if we take into account the action of weakly fermenting yeasts, since they produce high quantities of acetoin and acetate esters (JOLLY et al., 2006; AUNG et al., 2015; LIU et al., 2016). Moreover, malolactic fermentation is
24
normally developed in red wines. L-malate stimulates the growth and biomass production of O. oeni, typical lactic acid bacteria that lead malolactic fermentation. During this process citrate is catabolized and diacetyl and acetoin are synthetized (BAUER & DICKS, 2004).
3. Conclusions
A GC method for major volatile analysis in cider and wine was validated under the requirements of the ISO/IEC 17025 (AENOR, 2005) regulation. Resolution of the ethyl acetate/methanol couple and asymmetry of acetoin were improved in relation to GC method with splitless injection.
Validation parameters obtained showed that this method is appropriate for analytical purposes, as it presented a good linearity (R2>0.999), low LOQ (≤14.1 mg l–1) and LOD (≤4.6 mg l–1), good precision (≤8%), and average total error (≤11%).
The validated method can be successfully used in quality control of bioprocesses of cider and wine making.
References
AENOR (2005): General requirements for the competence of testing and calibration laboratories. EN ISO/IEC 17025.
ANTÓN, M.J., SUÁREZ VALLES, B., GARCÍA HEVIA, A. & PICINELLI LOBO, A. (2014): Aromatic profi le of ciders by chemical quantitative, gas chromatography-olfactometry, and sensory analysis. J. Food Sci., 79, 92–99.
AUNG, M.T., LEE, P.-R., YU, B. & LIU, S.-Q. (2015): Cider fermentation with three Williopsis saturnus yeast strains and volatile changes. Ann. Microbiol., 65, 921–928.
BARTOWSKY, E.J. & PRETORIUS, I.S. (2009): Microbial formation and modifi cation of fl avor and off-fl avor compounds in wine. -in: KÖNIG, H., UNDEN, G. & FRÖHLICH, J. (Eds), Biology of microorganisms on grapes, in must and in wine. Springer-Verlag Berlin Heidelberg, p. 216.
BAUER, R. & DICKS, L.M.T. (2004): Control of malolactic fermentation in wine. A review. S. Afr. J. Enol. Vitic., 25, 74–88.
BUDIĆ-LETO, I., ZDUNIĆ, G., BANOVIĆ, M., KOVAČEVIĆ-GANIĆ, K., TOMIĆ-POTREBUJEŠ, I. & LOVRIĆ, T. (2010):
Fermentative aroma compounds and sensory descriptors of traditional Croatian dessert wine prośek from Plavac mali cv. Food Technol. Biotechnol., 48, 530–537.
CLAYTON, C.A., HINES, J.W. & ELKINS, P.D. (1987): Detection limits with specifi ed assurance probabilities. Anal.
Chem., 59, 2506–2514.
EUROPEAN CO-OPERATIONFOR ACCREDITATION (2013): Evaluation of the uncertainty of measurement in calibration. EA- 4/02 M: 2013.
FDA (2003): Guidance for industry. Mass spectrometry for confi rmation of the identity of animal drug residues.
CVM-118.
GUM (2008): Evaluation of measurement data – guide to the expression of uncertainty in measurement.
JCGM100:2008.
HORWITZ, W. & ALBERT, R. (2006): The Horwitz ratio (HorRat): a useful index of method performance with respect to precision. J. AOAC Int., 89, 1095–1109.
ISO (2005): Statistical methods for use in profi ciency testing by interlaboratory comparisons. ISO 13528:2005 (E).
JOLLY, N.P., AUGUSTYN, O.P.H. & PRETORIUS, I.S. (2006): The role and use of non-Saccharomyces yeasts in wine production. S. Afr. J. Enol. Vitic., 27, 15–39.
LAMBRECHTS, M.G. & PRETORIUS, I.S. (2000): Yeast and its importance to wine aroma. – A review. S. Afr. J. Enol.
Vitic., 21, 97–129.
LAVAGNINI, I. & MAGNO, F. (2007): A statistical overview on univariate calibration, inverse regression, and detection limits: application to gas chromatography/mass spectrometry technique. Mass Spectrom. Rev., 26, 1–18.
LIU, S.-Q., AUNG, M.T., LEE, P.-R. & YU, B. (2016): Yeast and volatile evolution in cider co-fermentation with Saccharomyces cerevisiae and Williopsis saturnus. Ann. Microbiol., 66, 307–315.
OIV (2005): Practical guide for the validation, quality control, and uncertainty assessment of an alternative oenological analysis method. OIV-MA-AS1–12: R2005.
PICINELLI, A., SUÁREZ, B., MORENO, J., RODRÍGUEZ, R., CASO-GARCÍA, L. & MANGAS, J.J. (2000): Chemical characterization of asturian cider. J. Agr. Food Chem., 48, 3997–4002.
SCHWAB, W. & SCHREIER, P. (1990): Glycosidic conjugates of aliphatic alcohols from apple fruit (Malus sylvestris Mill cult. Jonathan). J. Agr. Food Chem., 38, 757–763.
SI, T., LUO, Y., XIAO, H. & ZHAO, H. (2014): Utilizing an endogenous pathway for 1-butanol production in Saccharomyces cerevisiae. Metab. Eng., 22, 60–68.
THOMPSON, M. (2016): z-Scores and other scores in chemical profi ciency testing – their meanings, and some common misconceptions. Anal. Methods, 8, 5553–5555.