Contents
S. Baran, K. Sikolya,Parameter estimation in linear regression driven by a Wiener sheet . . . 3 V. E. Bening, N. K. Galieva, R. A. Korolev, On rate of convergence
in distribution of asymptotically normal statistics based on samples of random size . . . 17 E. Csáki, M. Csörgő, A. Földes, P. Révész,Random walk on half-plane
half-comb structure . . . 29 I. Fazekas, Zs. Karácsony, R. Vas, Joint asymptotic normality of the
kernel type density estimator for spatial observations . . . 45 I. Fazekas, B. Porvázsnyik,A generalized allocation scheme . . . 57 I. Fazekas, T. Tómács,On weighted averages of double sequences . . . 71 J. Fritz, Compensated compactness and relaxation at the microscopic level . 83 R. Giuliano, C. Macci, Large deviations for some normalized sums of
exponentially distributed random variables . . . 109 A. Gut,Strong limit theorems for random fields . . . 125 M. Khaziakhmetov, T. Zakharova, The using of wavelet analysis in
climatic challenges . . . 159 S. V. Nagaev,Renewal theorems in the case of attraction to the stable law
with characteristic exponent smaller than unity . . . 173 Cs. Noszály, Experiments on the distance of two-dimensional samples . . . 193 V. A. Reisen, F. F. Molinares, Robust estimation in time series with
long and short memory properties . . . 207 R. Shevchuk,Pasting of two one-dimensional diffusion processes . . . 225 I. Shevtsova, Moment-type estimates with asymptotically optimal struc-
ture for the accuracy of the normal approximation . . . 241 B. Székely, A. Kőrösi, P. Vámos, J. Bíró, Discriminatory processor
sharing with access rate limitations . . . 309 A. S. Tylyshchak, Simulation of vibrations of a rectangular membrane
with random initial conditions . . . 325
ANNALESMATHEMATICAEETINFORMATICAE39.(2012)
TOMUS 39. (2012)
COMMISSIO REDACTORIUM
Sándor Bácsó (Debrecen), Sonja Gorjanc (Zagreb), Tibor Gyimóthy (Szeged), Miklós Hoffmann (Eger), József Holovács (Eger), László Kozma (Budapest), Kálmán Liptai (Eger), Florian Luca (Mexico), Giuseppe Mastroianni (Potenza), Ferenc Mátyás (Eger), Ákos Pintér (Debrecen), Miklós Rontó (Miskolc, Eger), László Szalay (Sopron), János Sztrik (Debrecen, Eger), Gary Walsh (Ottawa)
ANNALES MATHEMATICAE ET INFORMATICAE International journal for mathematics and computer science
Referred by
Zentralblatt für Mathematik and
Mathematical Reviews
The journal of the Institute of Mathematics and Informatics of Eszterházy Károly College is open for scientific publications in mathematics and computer science, where the field of number theory, group theory, constructive and computer aided geometry as well as theoretical and practical aspects of programming languages receive particular emphasis. Methodological papers are also welcome. Papers sub- mitted to the journal should be written in English. Only new and unpublished material can be accepted.
Authors are kindly asked to write the final form of their manuscript in LATEX. If you have any problems or questions, please write an e-mail to the managing editor Miklós Hoffmann: hofi@ektf.hu
The volumes are available athttp://ami.ektf.hu
Printed by Debrecen University Press Technical editor: Tibor Tómács
ANNALES
MATHEMATICAE ET INFORMATICAE
VOLUME 39. (2012)
EDITORIAL BOARD
Sándor Bácsó (Debrecen), Sonja Gorjanc (Zagreb), Tibor Gyimóthy (Szeged), Miklós Hoffmann (Eger), József Holovács (Eger), László Kozma (Budapest), Kálmán Liptai (Eger), Florian Luca (Mexico), Giuseppe Mastroianni (Potenza), Ferenc Mátyás (Eger), Ákos Pintér (Debrecen), Miklós Rontó (Miskolc, Eger), László Szalay (Sopron), János Sztrik (Debrecen, Eger), Gary Walsh (Ottawa)
INSTITUTE OF MATHEMATICS AND INFORMATICS ESZTERHÁZY KÁROLY COLLEGE
HUNGARY, EGER
Conference on Stochastic Models and their Applications
Faculty of Informatics, University of Debrecen Debrecen, Hungary, August 22–24, 2011
Edited by
István Fazekas György Terdik
HU ISSN 1787-5021 (Print) HU ISSN 1787-6117 (Online)
Parameter estimation in linear regression driven by a Wiener sheet ∗
Sándor Baran, Kinga Sikolya
Faculty of Informatics, University of Debrecen Kassai út 26, H-4028 Debrecen, Hungary
baran.sandor@inf.unideb.hu,sikolya.kinga@inf.unideb.hu Dedicated to Mátyás Arató on his eightieth birthday
Abstract
The problem of estimating the parameters of linear regression Z(s, t) = m1g1(s, t) +· · ·+mpgp(s, t) +W(s, t)based on observations ofZ on a spatial domainGof special shape is considered, where the driving process W is a standard Wiener sheet andg1, . . . , gp are known functions. We provide an expression for the maximum likelihood estimator of the unknown parameters based on the observation of the processZ on the set G. Simulation results are also presented, where the driving random sheets are simulated with the help of their Karhunen-Loève expansions.
Keywords: Wiener sheet, maximum likelihood estimation, Radon-Nikodym derivative.
MSC:60G60; 62M10; 62M30.
1. Introduction
The Wiener sheet is one of the most important examples of Gaussian random fields. It has various applications in statistical modelling. Wiener sheet appears as limiting process of some random fields defined on the interface of the Ising model [12], it is used to model random polymers [9], to describe the dynamics of Heath–Jarrow–Morton type forward interest rate models [10] or to model random mortality surfaces [6]. Further, [7] considers the problem of estimation of the mean
∗Research has been supported by the Hungarian Scientific Research Fund under Grant No. OTKA T079128/2009 and partially supported by TÁMOP 4.2.1./B-09/1/KONV-2010- 0007/IK/IT project. The project is implemented through the New Hungary Development Plan co-financed by the European Social Fund, and the European Regional Development Fund.
39(2012) pp. 3–15
Proceedings of the Conference on Stochastic Models and their Applications Faculty of Informatics, University of Debrecen, Debrecen, Hungary, August 22–24, 2011
3
in a nonparametric regression on a two-dimensional regular grid of design points and constructs a Wiener sheet process on the unit square with a drift that is almost the mean function in the nonparametric regression.
In this paper we consider a linear regression driven by a Wiener sheet, that is random field
Z(s, t) :=m1g1(s, t) +· · ·+mpgp(s, t) +W(s, t) (1.1) observed on a domainG, whereg1, . . . , gpare known functions andW is a standard Wiener sheet, and we determine the maximum likelihood estimator (MLE) of the unknown parameters m1, . . . , mp.
In principle, the Radon-Nikodym derivative of Gaussian measures might be derived from the general Feldman-Hajek theorem [11], but in most of the cases explicit calculations cannot be carried out. For example, if p = 1 and g1 ≡ 1 (shifted Wiener sheet), the MLE of the unknown parameter is given in [13] and the estimator is expressed as a function of a usually unknown random variable satisfying some characterizing equation. In several cases the exact form of this random variable can be derived by a method proposed in [14] based on linear stochastic partial differential equations.
Special case 1: Baran et al. [3] studied the case, whenp= 1and the random fieldZis observed on a rectangular domainG:= [a1, a2]×[b1, b2],[a1, a2],[b1, b2]⊂ (0,∞). Assuming that g1 is absolutely continuous with respect to the Lebesgue measure and∂1∂2g1∈L2(G), they proved that the MLE of the shift parameterm1
has the formmb1=A−1ζ, where
A= g12(a1, b1) a1b1
+
a2
Z
a1
[∂1g1(u, b1)]2 b1
du+
b2
Z
b1
[∂2g1(a1, v)]2 a1
dv (1.2)
+ ZZ
G
[∂1∂2g1(u, v)]2dudv,
ζ= g1(a1, b1)Z(a1, b1) a1b1
+
a2
Z
a1
∂1g1(u, b1) b1
Z(du, b1) +
b2
Z
b1
∂2g1(a1, v) a1
Z(a1,dv) (1.3)
+ ZZ
G
∂1∂2g1(u, v)Z(du,dv),
and it has normal distribution with mean m1 and variance 1/A. For g1 ≡ 1 we have mb1=Z(a1, b1).
Special case 2: Arató N.M. [2] considered the casep= 1andg1≡1and using Rozanov’s method found the MLE of the shift parameterm1 when the process is observed on a special domain
G⊂Ge:={(s, t)∈R2 : a≤s≤b, t≥γ(s)or s > b, t≥γ(b)}
containing anε–strip ofΓ :={(s, γ(s)) :s∈(a, b)}, i.e. for someε >0
{(s, t)∈R2: s∈[a, a+ε], t∈[γ(s), γ(a)]or s∈[a+ε, b], t∈[γ(s), γ(s) +ε]} ⊂G, whereγ: [a, b]⊂(0,∞)→Ris continuous and strictly decreasing withγ(b)>0.
Baran et al. [4] considered the same model and under much weaker conditions γ ∈ C2(a, b), γ0(a) := lims↓aγ0(s) ∈ [−∞,0] and γ0(b) := lims↑bγ0(s) ∈ [−∞,0]
exist, and
Zb a
|γ0(s)γ00(s)|
(1 +γ0(s)2)2ds <∞,
they proved the result of [2, Theorem 2]. They showed that the MLE of the shift parameterm1 has the formmc1=A−1ζ, where
A= 1
bγ(b)+ Zb a
ds
s2γ(s), ζ=c1Z(a, γ(a)) +c2Z(b, γ(b)) + Z
Γ
y1Z+ Z
Γ
y2∂nZ, (1.4) c1, c2are constants depending onγ and γ0 ata and b, y1 andy2 are functions of γ, γ0, γ00, and∂nZ denotes the normal derivative ofZ [4, Definition 4.1].
Ifγ0(a) =−∞we have
ζ= Z(b, γ(b)) bγ(b) +
Zb a
Z(s, γ(s)) s2γ(s) ds−
Zb a
1
sγ(s)Z(ds, γ(s)).
In the present paper we consider the same type of domainGas in [5] and give a natural extension of their result for the general model (1.1). We also present some simulation results to illustrate the theoretical ones where the Wiener sheet is simulated with the help of its Karhunen-Loève expansion (see e.g. [8]).
2. Model and estimator
Consider the model (1.1) with some given functionsg1, . . . , gp:R2+→Rand with unknown regression parameters m1, . . . , mp ∈R. Let [a, c]⊂(0,∞)and b1, b2 ∈ (a, c), letγ1,2 : [a, b1] →Rand γ0 : [b2, c]→R be continuous, strictly decreasing functions and let γ1 : [b1, c] → R and γ2 : [a, b2] → R be continuous, strictly increasing functions with γ1,2(b1) = γ1(b1) >0, γ2(b2) = γ0(b2), γ1,2(a) = γ2(a) andγ1(c) =γ0(c). Consider the curveΓ := Γ1,2∪Γ1∪Γ2∪Γ0, where
Γ1,2:=n
s, γ1,2(s)
:s∈[a, b1]o
, Γ1:=n
s, γ1(s)
:s∈[b1, c]o , Γ2:=n
s, γ2(s)
:s∈[a, b2]o
, Γ0:=n
s, γ0(s)
:s∈[b2, c]o ,
and for a given ε >0 letΓε1,2,Γε1, Γε2 andΓε0 denote the innerε-strip ofΓ1,2,Γ1, Γ2andΓ0, respectively, that is e.g.
Γε1,2:=
(s, t)∈R2:s∈[a, a+ε], t∈[γ1,2(s), γ1,2(a)]or s∈[a+ε, b1], t∈[γ1,2(s), γ1,2(s) +ε] . Suppose that there exists an ε >0such that
Γε1∩Γε2=∅ and Γε1,2∩Γε0=∅, (2.1) and consider the setG:=G1∪G2∪G3, where
G1:=
(s, t)∈R2:s∈[a, b1∧b2], t∈[γ1,2(s), γ2(s)] , G2:=
((s, t)∈R2:s∈[b1, b2], t∈[γ1(s), γ2(s)] , if b1≤b2, (s, t)∈R2:s∈[b2, b1], t∈[γ1,2(s), γ0(s)] , if b1> b2, G3:=
(s, t)∈R2:s∈[b1∨b2, c], t∈[γ1(s), γ0(s)] . An example of such a set of observations can be seen of Figure 1.
b1 b2
γ1,2
γ2
γ1 γ0
Γ2
Γ0
Γ1 Γ1,2
a c
t
s
G
Figure 1: An example of a set of observationsG
The following theorem is an extension of Theorem 2.1 of [5] and can be proved in a similar way. The proof is based on the discrete approximation method described in [3, 4, 5], which relies on the results of [1, Section 2.3.2].
Theorem 2.1. If g1, . . . , gp are twice continuously differentiable insideGand the partial derivatives∂1gi, ∂2gi and∂1∂2gi, i= 1, . . . , p, can be continuously extended toGthen the probability measures PZ andPW, generated onC(G)by the sheetsZ and W, respectively, are equivalent and the Radon-Nikodym derivative of PZ with respect to PW equals
dPZ
dPW
(Z) = exp
−1
2 m>Am−2ζ>m ,
whereA:= Ak,`p
k,`=1,m:= (m1, . . . , mp)> andζ:= ζ1, . . . , ζp> with Ak,`:= gk b1, γ1,2(b1)
g` b1, γ1,2(b1)
b1γ1,2(b1) (2.2)
+
b1
Z
a
gk s, γ1,2(s)
−s∂1gk s, γ1,2(s)
g` s, γ1,2(s)
−s∂1g` s, γ1,2(s)
s2γ1,2(s) ds
+ Zc b1
∂1gk s, γ1(s)
∂1g` s, γ1(s)
γ1(s) ds+
γZ2(b2) γ2(a)
∂2gk γ2−1(t), t
∂2g` γ−21(t), t γ2−1(t) dt
+
γ1,2Z(a) γ1,2(b1)
∂2gk γ1,2−1(t), t
∂2g` γ1,2−1(t), t γ1,2−1(t) dt+
ZZ
G
∂1∂2gk(s, t)∂1∂2g`(s, t)dsdt,
and
ζk:= gk b1, γ1,2(b1)
Z b1, γ1,2(b1) b1γ1,2(b1) +
Zc b1
∂1gk s, γ1(s)
γ1(s) Z ds, γ1(s) (2.3)
+
b1
Z
a
gk s, γ1,2(s)
−s∂1gk s, γ1,2(s) s2γ1,2(s)
hZ s, γ1,2(s)
ds−sZ ds, γ1,2(s)i
+
γZ2(b2) γ2(a)
∂2gk γ2−1(t), t
γ2−1(t) Z γ2−1(t),dt +
γ1,2Z(a) γ1,2(b1)
∂2gk γ−11,2(t), t
γ1,2−1(t) Z γ−11,2(t),dt +
ZZ
G
∂1∂2gk(s, t)Z(ds,dt).
If det(A)6= 0 then the maximum likelihood estimator of the parameter vector m based on the observations {Z(s, t) : (s, t)∈G} has the formmb =A−1ζ and has a p-dimensional normal distribution with meanm and covariance matrix A−1. Remark 2.2. Observe that all six terms of matrixAare non-negative definite ma- trices, soAis non-negative definite, too. Hence, to ensuredet(A)6= 0it suffices to have at least one positive definite among the terms, which fulfils e.g. ifg1, . . . , gp
are linearly independent.
Remark 2.3. We remark that the weightedL2-Riemann integrals of partial deriva- tives of the Wiener sheet (and of otherL2-processes) along a curve are defined in the sense of [5, Definition 4.1]. This means that ifZ is anL2-process given along an ε-neighborhood of a curveΓ :=
(s, γ(s)) : s∈ [a, b] , where γ : [a, b] →R is
strictly monotone and y: [a, b]→Ris a function, then Zb
a
y(s)Z(ds, γ(s)) :=l.i.m.
h→0
1 h
Zb a
y(s)
Z(s+h, γ(s))−Z(s, γ(s)) ds,
γ(b)Z
γ(a)
y(γ−1(t))Z(γ−1(t),dt) :=l.i.m.
h→0
1 h
Zγ(b) γ(a)
y(γ−1(t))
Z(γ−1(t), t+h)−Z(γ−1(t), t) dt,
if the right hand sides exist.
Example 2.4. Consider the model
Z(s, t) =m1(s2+t2) +m2(s+t) +m3(s·t) +W(s, t), (s, t)∈G, whereW(s, t), (s, t)∈[u−r, u+r]×[v−r, v+r]is a standard Wiener sheet and Gis a circle with center at(u, v)and radiusr. Thus
γ1,2(s) =v−p
r2−(s−u)2, s∈[u−r, u], γ1(s) =v−p
r2−(s−u)2, s∈[u, u+r], γ2(s) =v+p
r2−(s−u)2, s∈[u−r, u], γ0(s) =v+p
r2−(s−u)2, s∈[u, u+r], γ1,2−1(t) =u−p
r2−(t−v)2, t∈[v−r, v], γ2−1(t) =u−p
r2−(t−v)2, t∈[v, v+r].
In this case the distinct elements of the symmetric matrix A defined by (2.2) are the following
A1,1=(u2+ (v−r)2)2 u(v−r) +
Zu u−r
(γ1,22 (s)−s2)2 s2γ1,2(s) ds+ 4
u+rZ
u
s2 γ1(s)ds
+ 4 Zv v−r
t2
γ1,2−1(t)dt+ 4
v+rZ
v
t2 γ2−1(t)dt, A1,2=(u2+(v−r)2)(u+v−r)
u(v−r) +
Zu u−r
γ1,22 (s)−s2 s2 ds
+ 2
u+rZ
u
s
γ1(s)ds+ 2 Zv v−r
t
γ1,2−1(t)dt+ 2
v+rZ
v
t γ2−1(t)dt,
A2,2=(u+v−r)2 u(v−r) +
Zu u−r
γ1,2(s) s2 ds+
u+rZ
u
1 γ1(s)ds
+ Zv v−r
1 γ1,2−1(t)dt+
v+rZ
v
1
γ2−1(t)dt, (2.4)
A1,3=u2+(v−r)2+2r(u+2v)+r2, A2,3=u+v+2r,
A3,3=u(v−r) +r(v+2u)−3πr2 4 ,
while the components ofζ= ζ1, ζ2, ζ3)> defined by (2.3) are
ζ1= u2+ (v−r)2
Z b1, γ1,2(b1)
u(v−r) +
u+rZ
u
2s
γ1(s)Z ds, γ1(s) +
Zv v−r
2t
γ2−1(t)Z γ2−1(t),dt +
Zu u−r
(γ21,2(s)−s2) s2γ1,2(s)
hZ s, γ1,2(s)
ds−sZ ds, γ1,2(s)i
+
v+rZ
v
2t
γ1,2−1(t)Z γ1,2−1(t),dt ,
ζ2= u+v−r
Z b1, γ1,2(b1)
u(v−r) +
u+rZ
u
1
γ1(s)Z ds, γ1(s) +
Zv v−r
1
γ2−1(t)Z γ2−1(t),dt
(2.5)
+ Zu u−r
1 s2
hZ s, γ1,2(s)
ds−sZ ds, γ1,2(s)i +
v+rZ
v
1
γ1,2−1(t)Z γ1,2−1(t),dt ,
ζ3=Z b1, γ1,2(b1) +
u+rZ
u
Z ds, γ1(s) +
Zv v−r
Z γ2−1(t),dt
+
v+rZ
v
Z γ1,2−1(t),dt +
ZZ
G
Z(ds,dt).
3. Simulation results
To illustrate the theoretical results of [2, 3, 4, 5] and of Theorem 2.1 we performed computer simulations using Matlab 2010a. In order to simulate a Wiener sheet W(s, t), 0≤s≤S, 0≤t≤T, we considered its Karhunen-Loève expansion, that is
W(s, t)≈ Xn j,k=1
ωj,k 8√
ST
(π2)(2k−1)(2j−1)sin
π(2j−1)t 2T
sin
π(2k−1)s 2S
, (3.1) where {ωj,k : 1 ≤ j, k ≤ n} are independent standard normal random variables [8]. Figure 2 shows an approximation of the Wiener sheet with n = 150. Obvi- ously, there are other methods of simulating a Wiener sheet e.g. with the help of discretization and using the independence of increments (see e.g. [15]). However, in order to calculate our estimators we need a method which provides us whole realizations of the sheet.
0 0.2 0.4 0.6 0.8 1
0 0.5
1
−0.2
−0.15
−0.1
−0.05 0 0.05 0.1 0.15 0.2 0.25
Figure 2: Simulation of Wiener sheet,n= 150
In each of the following examples 1000 independent samples of the driving Wiener sheet were simulated withnvarying between25and100and the means of the estimates of the parameters and the empirical variances or covariance matrices ofζ defined by (1.3), (1.4) and (2.3), respectively, were calculated.
Example 3.1. Consider the model
Z(s, t) =W(s, t) +m(s2+t2),
where W(s, t), (s, t) ∈ G = [1,3]2 is a standard Wiener sheet (see Special case 1). Components of Aand of the approximation of ζ can be given in the following closed form:
A= 4b32−b31 3a1
+4a32−a31 3b1
+ 2a1b1,
ζ−mA≈ Xn j,k=1
ωj,k
8√ ST (π2)(2k−1)(2j−1)
(a21+b21 a1b1
sin
π(2k−1)a1
2S
sin
π(2j−1)b1
2T
+ 2 b1
sin
π(2j−1)b1
2T
"
2S
π(2k−1) cos
π(2k−1)a2
2S
−cos
π(2k−1)a1
2S
!
+a2sin
π(2k−1)a2
2S
−a1sin
π(2k−1)a1
2S
# + 2
a1
sin
π(2k−1)a1
2S
×
"
2T
π(2j−1) cos
π(2j−1)b2
2T
−cos
π(2j−1)b1
2T
!
+b2sin
π(2j−1)b2
2T
−b1sin
π(2j−1)b1
2T
#) , where
ζ= a21+b21
Z a1, b1 a1b1
+
a2
Z
a1
2u b1
Z du, b1 +
b2
Z
b1
2v a1
Z a1,dv .
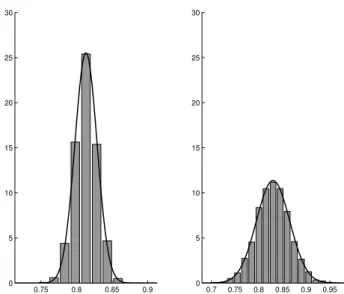
The theoretical parameter value is m = 5, while A = 33.3333. On Figure 3 the means of the estimates of the parameter and the estimated variances of ζ are plotted versus the level nof the approximation (3.1). In case of n= 100we have
b
m= 5.0007andAb= 33.7233.
Example 3.2. Consider the model
Z(s, t) =W(s, t) +m,
where W(s, t),(s, t) ∈ G, is a standard Wiener sheet and G is a set satisfying conditions of Special case 2 and Γ is a part of a circle with center at the origin, that isγ(s) =√
r2−s2 with somer >0and with [a, b]⊂(0, r)[4, Example 1.2] . Then
A= 1 r2
√r2−a2
a + b
√r2−b2
, c1=
√r2−a2
r2a , c2= b r2√
r2−b2, y1(s,p
r2−s2)≡0, y2(s,p
r2−s2)≡ − 1 r2
30 40 50 60 70 80 90 100 5
5.001 5.002
n
bm
30 40 50 60 70 80 90 100
32.8 33.3 33.8
n bA
Figure 3: Means of the estimates ofmand estimated variances of ζ in Example 3.1 for25≤n≤100
30 40 50 60 70 80 90 100
4.91 4.93 4.95
n
bm
30 40 50 60 70 80 90 100
0.216 0.22 0.224
n bA
Figure 4: Means of the estimates ofmand estimated variances of ζ in Example 3.2 for25≤n≤100
and
ζ−mA≈ Xn j,k=1
ωj,k
8√ ST π2r2(2k−1)(2j−1)
× (√
r2−a2
a sin
π(2k−1)a 2S
sin π(2j−1)√ r2−a2 2T
!
+ b
√r2−b2sin
π(2k−1)b 2S
sin π(2j−1)√ r2−b2 2T
!
− Zb a
π(2k−1)s 2S√
r2−s2cos
π(2k−1)s 2S
sin π(2j−1)√ r2−s2 2T
!
+π(2j−1) 2T sin
π(2k−1)s 2S
cos π(2j−1)√ r2−s2 2T
! ds
) , whereζ is defined by (1.4).
Let parameter value be m = 5 and choose a = 1, b = 3 and r = 5 yielding A = 0.2205. On Figure 4 the means of the estimates of the parameter and the estimated variances ofζ are plotted versus the levelnof the approximation (3.1).
In case of n= 100we havemb = 4.9357andAb= 0.2213.
30 40 50 60 70 80 90 100
4.99 5 5.01
n bm1
30 40 50 60 70 80 90 100
8.01 8.03 8.05
n bm2
30 40 50 60 70 80 90 100
2.96 2.98 3
n bm3
Figure 5: Means of the estimates of the components ofm in Ex- ample 3.3 for25≤n≤100
Example 3.3. Consider the same model
Z(s, t) =m1(s2+t2) +m2(s+t) +m3(s·t) +W(s, t), (s, t)∈G, as in Example 2.4, where W(s, t), (s, t)∈[0,8]2, is a standard Wiener sheet and G is a circle with center at (6,6) and radius r = 2. In this case the entries
of the matrix A defined by (2.4) and the approximation of the components of ζ = ζ1, ζ2, ζ3)> defined by (2.5) can be calculated using numerical integration, where Matlab functionquadis applied (recursive adaptive Simpson quadrature).
40 60 80 100
330 335 340
n bA1,1
40 60 80 100
38 39 40
n bA1,2
40 60 80 100
5.8 5.9 6
n bA2,2
40 60 80 100
124 127 130
n bA1,3
40 60 80 100
49 50 51
n bA3,3
40 60 80 100
15.5 16 16.5
n bA2,3
Figure 6: Estimated covariances ofζ in Example 3.3 for 25≤n≤100
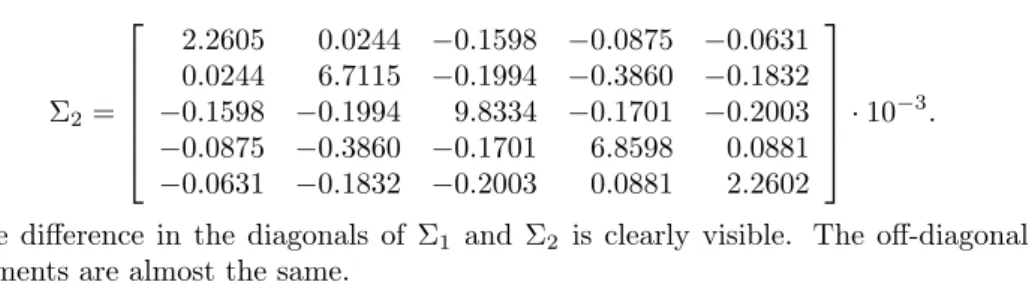
The theoretical parameter values arem1 = 5, m2 = 8 andm3 = 3, while the theoretical covariance matrix ofζ equals
A=
339.0895 38.6688 128.0000 38.6688 5.9115 16.0000 128.0000 16.0000 50.5752
.
On Figure 5 the means of the estimates of the three parameters, while on Figure 6 the estimated covariances ofζ are plotted versus the levelnof the approximation (3.1). In case ofn= 100 we have(5.0050,8.0442,2.9723)for the mean and
Ab=
339.4824 38.9639 127.1914 38.9639 5.8811 15.9680 127.1914 15.9680 49.9207
for the covariance matrix.
References
[1] Arató, M. (1982)Linear Stochastic Systems with Constant Coefficients. A Statistical Approach.Springer-Verlag, Berlin; in Russian: Nauka, Moscow, 1989.
[2] Arató, N. M. (1997) Mean estimation of Brownian sheet.Comput. Math. Appl.33, no. 8, 13–25.
[3] Baran, S., Pap, G. and Zuijlen, M. v. (2003) Estimation of the mean of stationary and nonstationary Ornstein-Uhlenbeck processes and sheets. Comput. Math. Appl.
45, no. 4-5, 563–579.
[4] Baran, S., Pap, G. and Zuijlen, M. v. (2004) Estimation of the mean of a Wiener sheet.Stat. Inference Stoch. Process.7, no. 3, 279–304.
[5] Baran, S., Pap, G., Zuijlen M. v. (2011) Parameter estimation of a shifted Wiener sheet.Statistics45, no. 4, 319–335.
[6] Biffis, E. and Millossovich, P. (2006) A bidimensional approach to mortality risk.
Decisions Econ. Finan.29, no. 2, 71–94.
[7] Carter, A. V. (2006) A continuous Gaussian approximation to a nonparametric re- gression in two dimensions.Bernoulli 12, no. 1, 143–156.
[8] Deheuvels, P., Peccati, G. and Yor, M. (2006) On quadratic functionals of the Brow- nian sheet and related processes.Stochastic Process. Appl.116, no. 3, 493–538.
[9] Douglas, J. F. (1996) Swelling and growth of polymers, membranes, and sponges.
Phys. Rev. E 54, no. 3, 2677–2689.
[10] Goldstein, R. (2000) The term structure of interest rates as a random field. Rev.
Financ. Stud.13, no. 2, 365–384.
[11] Kuo, H. H. (1975)Gaussian Measures in Banach Spaces.Springer-Verlag, Berlin.
[12] Kuroda, K. and Manaka, H. (1987) The interface of the Ising model and the Brownian sheet.J. Stat. Phys.47, no. 5-6, 979–984.
[13] Rozanov, Yu. A. (1968) Gaussian Infinite-dimensional Distributions. (in Russian).
Tr. Mat. Inst. Akad. Nauk SSSR, Nauka, Moscow.
[14] Rozanov, Yu. A. (1990) Some boundary problems for generalized random fields.
Theor. Probab. Appl.35, no. 4, 707–724.
[15] Toth, D. (2004) Adding interior points to an existing Brownian sheet lattice.Statist.
Probab. Lett.66, no. 3, 221–227.
On rate of convergence in distribution of asymptotically normal statistics based on
samples of random size
V. E. Bening
a, N. K. Galieva
b, R. A. Korolev
caLomonosov Moscow State University
Faculty of Computational Mathematics and Cybernetics
Institute of Informatics Problems of the Russian Academy of Sciences (IPI RAN) bening@yandex.ru
bKazakhstan Branch of Lomonosov Moscow State University
cPeoples’ Friendship University of Russia
Dedicated to Mátyás Arató on his eightieth birthday
Abstract
In the present paper we prove a general theorem which gives the rates of convergence in distribution of asymptotically normal statistics based on sam- ples of random size. The proof of the theorem uses the rates of convergences in distribution for the random size and for the statistics based on samples of nonrandom size.
Keywords: sample of random size; asymptotically normal statistic; transfer theorem; rate of convergence; mixture of distributions; Laplace distribution;
Student’s distribution
1. Introduction
Asymptotic properties of distributions of sums of random number of random vari- ables are subject of many papers (see e.g. Gnedenko&Fahim, 1969; Gnedenko, 1989; Kruglov&Korolev, 1990; Gnedenko&Korolev, 1996; Bening&Korolev, 2002;
von Chossy&Rappl, 1983). This kind of sums are widely used in insurance, eco- nomics, biology, etc. (see Gnedenko, 1989; Gnedenko, 1998; Bening&Korolev, 2002). However, in mathematical statistics and its applications, there are common 39(2012) pp. 17–28
Proceedings of the Conference on Stochastic Models and their Applications Faculty of Informatics, University of Debrecen, Debrecen, Hungary, August 22–24, 2011
17
statistics that are not sums of observations. Examples are the rank statistics, U- statistics, linear combinations of order statistics, etc. In this case the statistics are often situations when the sample size is not predetermined and can be regarded as random. For example, in reliability testing the number of failed devices at a particular time is a random variable.
Generally, in most cases related to the analysis and processing of experimental data, we can assume that the number of random factors, influencing the observed values, is itself random and varies from observation to observation. Therefore, instead of different variants of the central limit theorem, proving the normality of the limiting distribution of classical statistics, in such situations we should rely on their analogues for samples of random size. This makes it natural to study the asymptotic behavior of distributions of statistics of general form, based on samples of random size. For example, Gnedenko (1989) examines the asymptotic properties of the distributions of sample quantiles constructed from samples of random size.
In this paper we estimate the rate of convergence of distribution functions of asymptotically normal statistics based on samples of random size. The estima- tions depend on the rates of convergences of distributions of the random size of sample and the statistic based on sample of nonrandom size. Such statements are usually called transfer theorems. In the present paper we prove transfer theorems concerning estimates of convergence rate.
In this paper we use the following notation and symbols: R as real numbers, N as positive integers, Φ(x), ϕ(x) as standard normal distribution function and density.
In Section 2 we give a sketch of the proof of a general transfer theorem, Sections 3, 4 and 5 contain the main theorems, their proofs and examples.
Consider random variables N1, N2, . . . and X1, X2, . . . defined on a common measurable space(Ω,A,P). The random variables X1, X2, . . . Xn denote observa- tions,nis a nonrandom size of sample, the random variableNn denotes a random size of sample and depends on a natural parameter n ∈ N. Suppose that the random variables Nn take on positive integers for any n ≥ 1, that is Nn ∈ N, and do not depend on X1, X2, . . .. Suppose thatX1, X2, . . .are independent and identically distributed observations having a distribution functionF(x).
LetTn=Tn(X1, . . . , Xn)be some statistic, that is a real measurable function on observationsX1, . . . , Xn. The statisticTn is called asymptotically normal with parameters (µ,1/σ2),µ∈R, σ >0, if
P(σ√
n(Tn−µ)< x)−→Φ(x), n→ ∞, x∈R, (1.1) whereΦ(x)is the standard normal distribution function.
The asymptotically normal statistics are abundant. Recall some examples of asymptotically normal statistics: the sample mean (assuming nonzero variances), the maximum likelihood estimators (under weak regularity conditions), the central order statistics and many others.
For anyn≥1define the random variableTNn by
TNn(ω)≡TNn(ω)(X1(ω), . . . , XNn(ω)(ω)), ω∈Ω. (1.2)
Therefore,TNn is a statistic constructed from the statisticTn and from the sample of random sizeNn.
In Gnedenko&Fahim (1969) and Gnedenko (1989), the first and second transfer theorems are proved for the case of sums of independent random variables and sample quantiles.
Theorem 1.1 (Gnedenko, 1989). Let X1, X2, . . . be independent and identically distributed random variables and Nn ∈N denotes a sequence of random variables which are independent of X1, X2, . . .. If there exist real numbers bn >0, an ∈R such that
1. P1
bn
Xn i=1
(Xi−an)< x
−→Ψ(x), n→ ∞
and
2. PNn
n < x
−→H(x), H(0+) = 0, n→ ∞, whereΨ(x) andH(x)are distribution functions, then, asn→ ∞,
P 1 bn
Nn
X
i=1
(Xi−an)< x
−→G(x), n→ ∞,
where the distribution functionG(x) is defined by its characteristic function
g(t) = Z∞
0
(ψ(t))zdH(z)
andψ(t)is the characteristic function ofΨ(x).
The proof of the theorem can be read in Gnedenko (1998).
Theorem 1.2 (Gnedenko, 1989). Let X1, X2, . . . be independent and identically distributed random variables and Nn∈Nis a sequence of random variables which are independent of X1, X2, . . ., and let Xγ:n be the sample quantile of order γ ∈ (0,1) constructed from sample X1, . . . , Xn. If there exist real numbers bn > 0, an∈Rsuch that
1. P1
bn
(Xγ:n−an)< x
−→Φ(x), n→ ∞ and
2. PNn
n < x
−→H(x), H(0+) = 0, n→ ∞,
whereH(x) is a distribution function, then, asn→ ∞, P1
bn
(Xγ:Nn−an)< x
−→G(x), n→ ∞
where the distribution function G(x) is a mixture of normal distribution with the mixing distributionH
G(x) = Z∞ 0
Φ(x√y)dH(y).
In Bening&Korolev (2005), the following general transfer theorem is proved for asymptotically normal statistics (1.1).
Theorem 1.3. Let {dn} be an increasing and unbounded sequence of positive in- tegers. Suppose that Nn→ ∞ in probability asn→ ∞. LetTn(X1, . . . , Xn)be an asymptotically normal statistics, that is
P(σ√
n(Tn−µ)< x)−→Φ(x), n→ ∞.
Then a necessary and sufficient condition for a distribution functionG(x)to satisfy P(σp
dn(TNn−µ)< x)−→G(x), n→ ∞,
is that there exists a distribution function H(x)with H(0+) = 0 satisfying P(Nn< dnx)−→H(x), n→ ∞, x >0,
andG(x) has a form
G(x) = Z∞
0
Φ(x√y)dH(y), x∈R,
that is the distributionG(x)is a mixture of the normal law with the mixing distri- butionH.
Now, we give a brief sketch of proof of Theorem 1.3 to make references later.
2. Sketch of proof of Theorem 1.3
The proof of Theorem 1.3 is closely related to the proof of Theorems 6.6.1 and 6.7.3 for random sums in Kruglov&Korolev (1990).
By the formula of total probability, we have P
σp
dn(TNn−µ)< x
−G(x)
= X∞ k=1
P(Nn=k)P σ√
k(Tk−µ)<p k/dnx
−G(x)
= X∞ k=1
P(Nn=k) Φ p
k/dnx
−G(x)
+ X∞ k=1
P(Nn=k) P
σ√
k(Tk−µ)<p k/dnx
−Φ p
k/dnx
≡J1n+J2n. (2.1)
From definition ofG(x)the expression forJ1n can be written in the form J1n=
Z∞ 0
Φ(x√y) dP(Nn< dny)− Z∞ 0
Φ(x√y) dH(y)
= Z∞ 0
Φ(x√y) d P(Nn< dny)−H(y) .
Using the formula of integration by parts for Lebesgue integral (see e.g. Theorem 2.6.11 in Shiryaev, 1995) yields
J1n=− Z∞ 0
P(Nn< dny)−H(y)
dΦ(x√y). (2.2)
By the condition of the present theorem,
P(Nn< dny)−H(y)−→0, n→ ∞
for any fixed y ∈ R, therefore, by the dominated convergence theorem (see e.g.
Theorem 2.6.3 in Shiryaev, 1995), we have
J1n−→0, n→ ∞.
Consider J2n. For simplicity, instead of the condition for the statistic Tn to be asymptotically normal (see (1.1)), we suggest a stronger condition which describes the rate of convergence of distributions ofTn to the normal law. Suppose that the following condition is satisfied.
Condition 1. There exist real numbersα >0 andC1>0 such that sup
x
P
σ√
n(Tn−µ)< x
−Φ(x)≤ C1
nα, n∈N. From the condition we obtain estimates forJ2n. We have
|J2n|= X∞ k=1
P(Nn=k) P
σ√
k(Tk−µ)<p k/dnx
−Φ p
k/dnx
≤C1
X∞ k=1
P(Nn=k) 1
kα =C1E(Nn)−α= C1
dαnE(Nn/dn)−α. (2.3) Since, by the condition of theorem, the random variablesNn/dnhave a weak limit, then the expectation E(Nn/dn)−α is typically bounded. Because dn → ∞, from the last inequality it follows that
J2n−→0, n→ ∞.
3. The main results
Suppose that the limiting behavior of distribution functions of the normalized ran- dom size is described by the following condition.
Condition 2. There exist real numbers β > 0, C2 >0 and a distribution H(x) with H(0+) = 0 such that
sup
x≥0
PNn
n < x
−H(x)≤ C2
nβ, n∈N.
Theorem 3.1. If for the statisticTn(X1, . . . , Xn)condition 1 is satisfied, for the random sample sizeNn condition 2 is satisfied, then the following inequality holds
sup
x
P
σ√
n(TNn−µ)< x
−G(x)≤C1ENn−α+ C2
2nβ, where the distributionG(x)has the form
G(x) = Z∞ 0
Φ(x√y) dH(y), x∈R.
Corollary 3.2. The statement of the theorem remains valid if the normal law is replaced by any limiting distribution.
Corollary 3.3. If the moments E(Nn/n)−α are bounded uniformly inn, that is ENn
n −α
≤C3, C3>0, n∈N,
then the right side of the inequality in the statement of the theorem has the form C1C3
nα + C2
2nβ =O n−min(α,β) .
Corollary 3.4. By Hölder’s inequality for0< α≤1, the following estimate holds ENn−α≤
E 1 Nn
α
,
which is useful from practical viewpoint. In this case, the right side of the inequality has the form
C1
E 1 Nn
α
+ C2
2nβ.
Corollary 3.5. Note that, condition 2 means that the random variables Nn/n converge weakly to V which has the distributionH(x). From the definition of weak convergence with function x−α, x≥1, for Nn≥n, n∈N, it follows that
ENn
n −α
−→E 1
Vα, n→ ∞,
that is the momentsE(Nn/n)−αare bounded innand, therefore, the estimate from Corollary 3.3 holds.
The case Nn ≥ n appears when the random variable Nn takes on values n,2n, . . . , kn with equal probabilities 1/k for any fixed k ∈ N. In this case, the random variables Nn/ndo not depend onnand, therefore, converge weakly to V which takes values1,2, . . . , k with equal probability1/k.
Corollary 3.6. From the proof of the theorem it follows that skipping of conditions 1 and 2 yields the following statement
sup
x
P
σ√
n(TNn−µ)< x
−G(x)
≤ X∞ k=1
P Nn =k sup
x
P
σ√
k(Tk−µ)< x
−Φ(x) +1
2sup
x≥0
PNn
n < x
−H(x).
Following the proof of Theorem 3.1 (see Section 2 and 4), we can formulate more general result.
Theorem 3.7. Let a random element Xn in some measurable space and random variable Nn be defined on a common measurable space and independent for any n∈N. Suppose that a real-valued statistic Tn =Tn(Xn) and the random variable Nn satisfy the following conditions.
1. There exist real numbers α > 0, σ > 0, µ ∈ R, C1 > 0 and a sequence 0< dn ↑+∞, n→ ∞, such that
sup
x
P
σp
dn(Tn−µ)< x
−Φ(x)≤C1
nα, n∈N.
2. There exist a number C2 > 0, a sequence 0 < δn ↓ 0, n → ∞ and a distribution functionH(x)with H(0+) = 0such that
sup
x≥0
PNn
dn
< x
−H(x)≤C2δn, n∈N. Then the following inequality holds
sup
x
P
σp
dn(TNn−µ)< x
−G(x)≤C1ENn−α+C2
2 δn, where the distribution functionG(x) has the form
G(x) = Z∞ 0
Φ(x√y) dH(y), x∈R.
4. Proof of Theorem 3.1
Supposex≥0. Using formulas (2.1)–(2.3) withdn =nyields sup
x≥0
P
σ√n(TNn−µ)< x
−G(x)≤I1n+I2n, (4.1) where
I1n= sup
x≥0
Z∞ 0
P(Nn < ny)−H(y)dΦ(x√y), (4.2)
I2n= X∞ k=1
P(Nn=k) sup
x≥0
P
σ√
k(Tk−µ)<p k/nx
−Φ p k/nx
. (4.3) To estimate the variableI1n we use equality (4.2) and condition 2,
I1n ≤C2
nβ sup
x≥0
Z∞ 0
dΦ(x√y) = C2
2nβ. (4.4)
The series in I2n (see (4.3)) is estimated by using condition 1.
I2n≤C1
X∞ k=1
1
kαP(Nn=k) =C1ENn−α. (4.5) Note that the estimate (4.5) is valid for x <0. For I1n and negative x, we have (see (2.1) and (2.2))
I1n= sup
x<0
Z∞ 0
P(Nn< ny)−H(y)
dΦ(x√y)
= sup
x<0
Z∞ 0
P(Nn< ny)−H(y)
dΦ(|x|√y)
≤sup
x≥0
Z∞ 0
P(Nn < ny)−H(y)dΦ(x√y),
and we can use (4.4) again. The statement of the theorem follows from (4.1), (4.4) and (4.5). The theorem is proved.
5. Examples
We consider two examples of use of Theorem 3.1 when the limiting distribution functionG(x)is known.
5.1. Student’s distribution
Bening&Korolev (2005) shows that if the random sample sizeNn has the negative binomial distribution with parameters p= 1/n and r > 0, that is (in particular, forr= 1, it is the geometric distribution)
P(Nn =k) =(k+r−2)· · ·r (k−1)!
1 nr
1−1 n
k−1
, k∈N,
then, for an asymptotically normal statisticTn the following limiting relationship holds (see Corollary 2.1 in Bening&Korolev, 2005)
P(σ√
n(TNn−µ)< x)−→G2r(x√
r), n→ ∞, (5.1)
whereG2r(x)is Student’s distribution with parameterγ= 2r, having density pγ(x) =Γ((γ+ 1)/2)
√πγΓ(γ/2)
1 + x2 γ
−(γ+1)/2
, x∈R,
whereΓ(·)is the gamma function, andγ >0is a shape parameter (if the parameter γ is a positive integer, then it is called the number of degrees of freedom). In our situation the parameter may be arbitrary small, and we have typical heavy-tailed distribution. If γ= 2, that is r= 1, then the distribution function G2(x)can be found explicitly
G2(x) = 1 2
1 + x
√2 +x2
, x∈R. Forr= 1/2, we obtain the Cauchy distribution.
Bening et al. (2004) gives an estimate of rate of convergence for random sample size, for 0< r <1,
sup
x≥0
P Nn
ENn
< x
−Hr(x)≤ Cr
nr/(r+1), Cr>0, n∈N, (5.2)
where
Hr(x) = rr Γ(r)
Zx 0
e−ryyr−1dy, x≥0,
forr= 1, the right side of the inequality can be replaced by1/(n−1). So,Hr(x) is a distribution with parameterr∈(0,1], and
ENn=r(n−1) + 1. (5.3)
From
(1 +x)γ = X∞ k=0
γ(γ−1)· · ·(γ−k+ 1)
k! xk, |x|<1, γ∈R, we have
ENn−1= 1 (n−1)(1−r)
1 nr−1 −1
=O(n−r), 0< r <1, n∈N. (5.4) If the Berry-Esseen estimate is valid for the rate of convergence of distribution of Tn, that is
sup
x
P
σ√
n(Tn−µ)< x
−Φ(x)=O 1
√n
, n∈N, (5.5)
then from Theorem 3.1 withα= 1/2,β=r/(r+ 1), from relations (5.1)–(5.4) and Corollary 3.4, we have the following estimate
sup
x
P
σ√n(TNn−µ)< x
−G2r(x√r)
=O 1 nr/2
+O 1 nr/(r+1)
=O 1 nr/2
, r∈(0,1), n∈N. (5.6)
5.2. Laplace distribution
Consider Laplace distribution with distribution function Λγ(x)and density λγ(x) = 1
γ√ 2expn
−
√2|x| γ
o, γ >0, x∈R.
Bening&Korolev (2008) gives a sequence of random variablesNn(m)which depends on the parameterm∈N. LetY1, Y2, . . .be independent and identically distributed random variables with some continuous distribution function. Letmbe a positive integer and
N(m) = min{i≥1 : max
1≤j≤mYj< max
m+1≤k≤m+iYk}.
It is well-known that such random variables have the discrete Pareto distribution P(N(m)≥k) = m
m+k−1, k≥1. (5.7)
Now, let N(1)(m), N(2)(m), . . . be independent random variables with the same distribution (5.7). Define the random variable
Nn(m) = max
1≤j≤nN(j)(m), then Bening&Korolev (2008) shows that
nlim→∞PNn(m) n < x
=e−m/x, x >0, (5.8) and, for an asymptotically normal statisticTn, the following relationship holds
P(σ√
n(TNn(m)−µ)< x)−→Λ1/m(x), n→ ∞,
whereΛ1/m(x)is the Laplace distribution function with parameterγ= 1/m.
Lyamin (2010) gives the estimate for the rate of convergence for (5.8), sup
x≥0
PNn(m) n < x
−e−m/x≤ Cm
n , Cm>0, n∈N. (5.9) If the Berry-Esseen estimate is valid for the rate of convergence of distribution for the statistic (see (5.5)), then from Corollary 3.4 for α = 1/2, β = 1 and from inequality (5.9), we have
sup
x
P
σ√n(TNn(m)−µ)< x
−Λ1/m(x)=O
(ENn−1(m))1/2
+O n−1 . (5.10) Consider the variable ENn−1(m). From definition ofNn(m)and inequality (5.7), we have
P(Nn(m) =k) = k m+k
n
− k−1 m+k−1
n
=mn Zk k−1
xn−1 (m+x)n+1dx, therefore,
ENn−1(m) = X∞ k=1
1
kP(Nn(m) =k) =mn X∞ k=1
1 k
Zk k−1
xn−1 (m+x)n+1dx
≤mn X∞ k=1
Zk k−1
xn−2
(m+x)n+1dxmn Z∞ 0
xn−2 (m+x)n+1dx.
To calculate the last integral we use the following formula (see formula 856.12 in Dwight, 1961)
Z∞ 0
xm−1
(a+bx)m+ndx= Γ(m)Γ(n)
anbmΓ(m+n) a, b, m, n >0.
We have
ENn−1(m)≤mnΓ(n−1)Γ(2)
m2Γ(n+ 1) = 1
m(n−1) =O(n−1).
Now, by this formula and (5.10), we obtain sup
x
P
σ√
n(TNn(m)−µ)< x
−Λ1/m(x)=O 1
√n .
References
[1] Bening, V. E. & Korolev V. Y. (2002).Generalized Poisson Models and Their Applica- tions in Insurance and Finance, VSP Press, Netherlands.
[2] Bening, V. E. & Korolev, V. Y. (2005). On an application of the Student distribution in the theory of probability and mathematical statistics.Theory Probab. Appl.,49(3), 377–391.
[3] Bening, V. E. & Korolev, V. Y. (2008). Some statistical problems related to the Laplace distribution. Informatics and its Applications, IPI RAN, 2(2), 19–34 [in Russian].
[4] Bening, V. E., Korolev, V. Y. & U Da (2004). Estimates of rates of convergences of dis- tributions of some statistics to the Student distribution. J. People’s Friendship Univer. Russia,1(12), 59–74.
[5] Von Chossy, R. & Rappl, G. (1983). Some approximation methods for the distribution of random sums.Insurance: Mathematics and Economics,2, 251–270.
[6] Dwight, H. B. (1961). Tables of Integrals and Other Mathematical Data, 4th edn.
Macmillan, USA.
[7] Gnedenko, B. V. (1989). On estimation of the unknown parameters of distributions from a random number of independent observations. Proceedings of Tbilisi Math.
Inst., AN GSSR,92, 146–150 [in Russian].
[8] Gnedenko, B. V. (1998).Theory of Probability, 6th edn. CRC Press, USA.
[9] Gnedenko, B. V. & Fahim, G. (1969). On a transfer theorem.Soviet Math. Dokl.,10, 769–772.
[10] Gnedenko, B. V. & Korolev V. Y. (1996). Random Summation. Limit Theorems and Applications, CRC Press, USA.
[11] Kruglov, V. M. & Korolev V. Y. (1990). Limit Theorems for Random Sums, Moscow University Press, Moscow [in Russian].
[12] Lyamin, O. O. (2011). On the rate of convergence of the distributions of certain statis- tics to the Laplace and Student distributions. Moscow University Computational Mathematics and Cybernetics,35(1), 37–46.
[13] Shiryaev, A. N. (1995).Probability, 2nd edn. Springer, USA.