Section III
The Relation between Stimulus and Effect*
Introduction . . . . . . . . . . . . 395
III. 1. The All-or-None Response 395 1.1. In a Single Effector Unit 396 1.2. In a Group of Effector Units 397 1.3. From Agonist to Competitive Antagonist . . . . . 3 9 8
III. 2. Threshold Phenomena 401 2.1. Theory 401 2.2. Experiments . . . . . . . . . . 401
III. 3. Receptor Reserve . . . . . . . . . . 408
3.1. Theory 408 3.2. Experiments . . . . . . . . . . 410
3.3. Intrinsic Activity and Affinity in the Case of a Receptor Reserve . 418 III. 4. Mechanical Factors and Reserve in Receptors . . . . . 424
4.1. Theory . 424 4.2. Experiments . . . . . . . . . . 425
4.3. Isoboles 428 4.4. The Influence of the Sequence of Application of Spasmogen and
Spasmolytic . . . . . . . . . . 431 III. 5. The Sequence of Events after Interaction of a Drug with Its Specific
Receptors . . . . . . . . . . . 433
5.1. Theory 433 5.2. Experiments . . . . . . . . . . 435
III. 6. Integral Dose-Response Relations . . . . . . . 437 6.1. Interpretation of Phenomena Observed in in Vivo Experiments . 437 6.2. Experiments in Vitro and in Vivo . . . . . . 446
6.3. Drug Kinetics 458 Concluding Remarks . . . . 4 6 1
References . . . . . . . . . . . . . 462
* By E. J. Ariens, A. M. Simonis, and J. M. van Rossum.
394
Ι,ΙΠ. RELATION BETWEEN STIMULUS AND EFFECT 395
INTRODUCTION
F o r t h e phenomena discussed in Section I I , there is a rather good agreement between theory a n d experimental evidence. I t will be clear t h a t if further details in t h e experimental d a t a are t o be t a k e n into account, further extension of t h e theory m a y be necessary. I n Section I I t h e effect was supposed t o be linearly proportional t o t h e stimulus. The stimulus and, therefore, t h e effect was supposed t o be linearly proportional t o t h e n u m b e r of receptors occupied by t h e drug, so t h a t stimulus was practically synonymous with effect. The proportionality constant, which represents t h e ability of t h e drug to contribute to t h e stimulus a n d so t o t h e effect, is called intrinsic a c t i v i t y ; it varies for various drugs.
I n this section, more complicated types of relations between stimulus a n d effect will be introduced. I n comparison t o t h e drug-receptor interactions a n d their effects discussed in Section I I , only t h e relation between stimulus a n d effect is supposed t o be changed. As a consequence, t h e equations a n d dose- response relations discussed in Section I I . A now only apply for t h e dose- stimulus curve. This implies a substitution in t h e various equations of S...ISm
for E.../Em, e.g., £A B/ £m for EAB/Em) SABW/Sm for EABB,/Em, and SAJSm for EAm/Em. For a drug, A, t h e relation between t h e dose and t h e stimulus evoked can be represented b y :
^ = ? (1) Sm 1 + (KJ[A]) ( '
Compare this equation with E q . 4 in Section I I . A .
111.1. THE ALL-OR-NONE RESPONSE
Instead of a linear proportionality between stimulus a n d effect, as assumed in Section I I , an all-or-none relation can be supposed. This means t h a t an effect is produced by t h e effector unit only if t h e stimulus reaches a critical value.
This value is called t h e response or trigger value, r . If this value is reached or surpassed, a full response is obtained, So, if t h e effector unit responds, it does so in a 100% way every time t h e critical value τ is reached for t h e stimulus (3, 4, J, 6, 83). I n d e p e n d e n t of us, Hewlett et al. (39) postulated an analogous approach in their article on q u a n t a l a n d graded responses. Their hypothesis r e a d s : "An individual organism responds quantally if an underlying quantita
tive change t h a t results from administration of t h e drug, a n d t h a t can be regarded as a graded response, reaches a certain level of intensity characteristic of t h a t individual organism."
All-or-none responses are well-known phenomena in biology. The transmis
sion of impulses in interneuronal synapses a n d a t t h e myoneural junction has an all-or-none character. The evocation of t h e stimulus is supposed t o be corre
lated with a local change in t h e m e m b r a n e potential. If this change reaches a
396 Ε. J. ARIENS, Α. Μ. SIMONIS AND J. Μ. VAN ROSSUM
certain value, t h e critical firing potential (87) or trigger value, a full response is obtained in t h e effector unit, e.g., t h e post-synpatic nerve fiber or t h e muscle cell. This is accompanied by a propagated action potential (18, 46).
I t is useful to differentiate between trigger value a n d threshold value. When t h e trigger value is reached, t h e effector gives t h e full response; when t h e threshold value is reached, t h e effector s t a r t s t o respond in a graded way.
III.1.1. In a Single Effector Unit
An all-or-none response in a single effector unit implies a sharply discon
tinuous dose-response relation. The dose of A for which SA/Sm reaches t h e criti
cal value of τ, causes a full response of t h e effector. This dose m a y be called t h e trigger dose. Lower doses do not give any response, SA/Sm < r . Higher doses result in a constant response, $A/ #m ^ r. The maximal value t h a t can be reached for t h e stimulus is determined by a, t h e intrinsic activity of drug A.
A gradual decrease in t h e intrinsic activity in a series of compounds results in an a b r u p t change from agonistic compounds, α ^ r , t o competitive antag
onistic compounds, α < τ.
The number of receptors t h a t have to be occupied by a drug A t o reach t h e trigger value τ for t h e stimulus, depends on t h e intrinsic activity of t h e drug.
If α > r , t h e maximal stimulus possible with drug A is greater t h a n τ. Then only a fraction of t h e receptors has t o be occupied in order to reach τ and t o get a response. There is a reserve in t h e potential stimulus, or more practically, there is a reserve in receptors. If more receptors are occupied b y A t h a n necessary—
t h u s , if t h e stimulus surpasses t h e value of τ — t h e response obtained is not increased. If any response is obtained in t h e case of an all-or-none response, it is a full response.
If an agonistic compound A, for which α ^ τ, is combined with a competi
tive antagonist B, for which β < τ, t h e dose of A necessary to reach t h e critical value f o r $A B/ $m is increased. An increase in t h e dose of t h e agonist can over
come t h e competitive inhibitive action of Β ; t h e inhibition is surmountable (4, 5). The trigger dose for A is increased by B .
If compound A is combined with a noncompetitive antagonist B , which interacts in such a way t h a t t h e result is a decrease in t h e stimulus, t h e an
tagonism is not surmountable, a t least if high doses of t h e compounds A or Β are used. The antagonism is surmountable t o a certain degree, if low doses of t h e compounds A and Β are applied; then, an increase in t h e dose of A still results in an increase of SAB,/Sm. If this reaches t h e value of τ again, a response is obtained. The trigger dose for A is increased by low doses of B . W i t h high doses of Β t h e effect of A is definitely blocked (2, 4y 5, 85).
If t h e noncompetitive antagonist a t t a c k s t h e effector itself and disables it t o a certain degree, t h e addition of t h e antagonist does not result in a change of t h e trigger dose, b u t in a decrease in t h e effect produced by t h e effector unit.
All relations, equations, a n d curves for drug-receptor interactions given in
Ι,ΙΙΙ. RELATION BETWEEN STIMULUS AND EFFECT 397
Section I I can be introduced in an easy way into t h e model for t h e all-or-none response of a single effector unit. The trigger doses for such an effector unit can easily be calculated from t h e m . The trigger dose is t h a t dose of a drug for which S...ISm reaches t h e response value τ . Drawing a horizontal line a t t h e value S.../Sm or E.../Em, equal t o τ, in t h e figures representing t h e theoretical dose-response curves for various combinations of drugs represented in Sec
tion I I , t h e trigger doses for t h e drug concerned can be read from t h e point of intersection of this line with t h e various curves. F o r t h e case of a competitive a n d noncompetitive inhibition mentioned above, see Figs. 23 a n d 24, Section I I . A . a n d Fig. 4, Section I I . B , respectively.
III.1.2. In a Group of Effector Units
Many biological objects are composed of a great n u m b e r of effector units.
The striated muscle is composed of m a n y muscle cells. Sharply discontinuous dose-response curves can be expected for t h e single cells, b u t not for t h e muscle.
The trigger values for t h e various cells will exhibit a certain variance.* Graded log dose-response curves obtained with tissues do not exclude a n all-or-none response for t h e composing cells.
Suppose there is a biological variance in τ. For t h e action of a particular t y p e of drugs on a certain biological object t h e t y p e of distribution is assumed to be constant. I n t h e case of a symmetrical frequency distribution, 5 0 % of t h e units will have responded if $A/ #m reaches t h e mean value, f. The slope of t h e dose-response curve is determined by t h e biological variance (28, 29).
I t is essential t h a t a certain value for t h e stimulus is assumed t o result always in t h e same effect, independently of t h e way in which t h e stimulus is induced.
When a frequency distribution according t o Gauss occurs, characterized by t h e s t a n d a r d deviation σ, t h e zone represented by (f + cr) t o (f — σ) covers a b o u t 6 8 . 3 % of t h e distribution curve; from (τ + 3σ) t o (f —3σ) it is a b o u t 9 9 . 7 % .
The concentration range for which t h e relationship ( f - 3 a ) < SA/ Sm< ( f + 3a)
holds good, covers an effect from 0.3-99.7% of t h e maximal effect Em. This implies t h a t for drugs with an intrinsic activity α > (τ + 3σ) only a fraction of t h e receptors has t o be occupied in order t o obtain a practically maximal effect.
The maximal value for t h e stimulus to be reached with such a drug is greater t h a n (τ + 3σ), t h e value which is necessary for t h e stimulus t o obtain 9 9 . 7 % of Em. There is a reserve in receptors which is determined b y [α — (τ + 3σ)].
A consequence of t h e biological variation in t h e various effector units in t h e organ is t h a t instead of a trigger value for t h e dose for t h e units, a threshold value for t h e dose comes into t h e picture for t h e organ. W i t h doses of A for which SAj8m < (f — 3cr), no response is obtained. For the threshold dose of A,
* Statistical variation; scattering of the values.
398 Ε. J. ARIENS, Α. Μ. SIMONIS AND J . Μ. VAN ROSSUM
SAISm = (f —3σ). W h e n this dose is surpassed t h e organ reacts with a graded response.
W h e n t h e effect is proportional t o t h e fraction of receptors occupied, t h e slope of dose-response curves for a drug A is determined in t h e first place by t h e t y p e of drug-receptor interaction a n d t h e intrinsic activity (see Section I I ) . W h e n there is an all-or-none response, t h e slope of t h e curves is determined b y t h e biological variance a n d t h e intrinsic activity.
III.1.3. From Agonist to Competitive Antagonist There are t h r e e cases t o consider:
1. Drugs for which t h e intrinsic activity α > (f + 3σ), if added in sufficiently high concentrations, produce a practically maximal effect, Emi even before t h e t o t a l n u m b e r of receptors is occupied; there is a receptor reserve. For doses so low t h a t SA/Sm < (f —3σ), no effect is obtained; t h e r e is a threshold pheno
menon.
2. Drugs for which t h e intrinsic activity α < (f —3σ) are " i n a c t i v e . " E v e n in high concentrations, less t h a n 0.1 % of t h e effector units will respond. These drugs behave as competitive antagonists of those for which t h e intrinsic activity is greater t h a n (f — 3σ).
3. Drugs for which (f — 3σ) < α < (f + 3σ) are effective as such. The maximal effect, EAm, t h a t t h e y produce is smaller t h a n t h e maximal effect, Em, obtain
able with t h e biological object. I n combination with drugs with a higher in
trinsic activity, t h e y act as competitive antagonists. There is a competitive dualism in action.
A gradual decrease in t h e intrinsic activity results in a gradual change from agonistic t o competitively antagonistic compounds via dualistic compounds, which behave as " p a r t i a l a g o n i s t s " (compare with Section II.A.3.4).
Figure 1 represents theoretical dose-response curves for a series of drugs with various intrinsic activities a n d various affinities t o t h e specific receptors acting on a biological object responding in an all-or-none way, with a biological variance for r . The decrease in intrinsic activity results in a gradual change from agonistic t o competitively antagonistic compounds via dualistic ones.
The compounds with a high intrinsic activity, although their intrinsic activities differ, will give t h e same maximal response; this as a result of t h e receptor reserve. For these compounds with a high intrinsic activity, t h e decrease in intrinsic activity results in an almost parallel shift in t h e log dose-response
curves (see Fig. 1).
I n case of t h e all-or-none response t h e characteristics of t h e curves are t h e same as those described for t h e curves in case of a competitive antagonism in Section II.A. Addition of a certain concentration of a competitive antagonist results in a parallel shift of t h e log dose-response curves for t h e agonist (see Fig. 2 and t h e upper p a r t of Fig. 3, a n d compare with Section II.A, Figs. 11 a n d 23) (83).
Ι,ΙΠ. RELATION BETWEEN STIMULUS AND EFFECT 399
FIGS. 1-3. Theoretical log concentration-response curves. Concentrations in M-1. FIG. 1. Compounds with varying values for the affinity ( 1j KA) and the intrinsic activity (a) in the case of an all-or-none response (5, 82). Note the parallel shift in the curves with a variation of KA, the nearly parallel shift in the curves for the compounds with a high intrinsic activity, and a decrease in the maximum height and the slope of the other curves with a decrease in a. (Compare with Fig. 1, Section II.A.) FIG. 2. Agonistic compound A combined with various con
centrations of a competitive antagonist Β (5,82 ). Note the parallel shift in the curves for A. There are no essential differences between this set of curves and those of Fig. 11, Section II. A. FIG. 3. Partial agonist Β combined with various concentrations of an agonist A acting on the same receptor system (5,82 ). Note the dualism in character in the effect of B. (Compare with Fig. 23, Section II. A.)
400 Ε. J. ARIENS, Α. Μ. SIMONIS AND J . Μ. VAN ROSSUM
For t h e cooperation between competitive compounds, new characteristics are found. Suppose two agonistic compounds, A and B , each with a certain value for t h e threshold doses, are combined. Previous addition of compound A in a sub-threshold dose, results in a stimulus not great enough t o produce a response. The consequence is t h a t smaller doses of compound Β are sufficient to bring t h e stimulus t o t h e critical value τ and t o induce an effect. W i t h o u t previous addition of A, higher doses of Β are necessary. There is a facilitation of t h e effect of Β by A. The reverse of it also holds true—a facilitation of t h e effect of A by Β also takes place. Figure 4A and t h e lower p a r t in Fig. 3 repre
sent theoretical dose-response curves for such a cooperation between two drugs.
Compare these figures with Fig. 4B and with Fig. 23, Section I I . A.3, respectively.
FIG. 4. A and B . Theoretical log concentration-response curves for the agonist A com
bined with various concentrations of another agonist B , acting on the same receptor system in the case of an all-or-none response (5, 82). Concentrations in M~x. FIG. 4A. Note the facilitating action of compound Β for compound A . FIG. 4B. Note the absence of a facilitating action.
Figure 4B represents curves for t h e case of a simple additive action, which follows Burgi's law (14,15,16). This law says: " I n combining drugs with t h e same end-effect, t h e resulting activity is additive, when t h e sites of action of t h e compounds are identical." If a fraction ρ of t h e dose of t h e drug A m a y be substituted by a corresponding fraction of an equi-active dose of a drug Β without a change in t h e effect, there is an addition. I n formula this can be represented a s :
= e f f e o t o f ( l - p ) [ A ] + p[B]
q effect of [A] { }
where [A] and [B] are equi-active doses of t h e respective compounds. W h e n there is an addition, t h e value of q equals 1. If t h e effect is linearly proportional
Ι , Ι Π . RELATION BETWEEN STIMULUS AND EFFECT 401
to t h e stimulus, combination of two compounds which induce their effect on common receptors, results always in an addition, independent of t h e intrinsic activity of these compounds (3). I n t h e case of an all-or-none response, t h e same relations are valid for t h e stimulus and, as a certain stimulus always results in t h e same effect, Burgi's law also is valid for t h e effect. There is an interesting complication. If t h e fractions of t h e equi-active doses [A] and [B]
t h a t have t o be combined are inactive when applied singly, because t h e y only induce sub-threshold stimuli, their combination again results in an effect equal t o t h a t of t h e individual whole dose.
The discussion of t h e all-or-none response demonstrates t h a t for this t y p e of action also a gradual decrease in t h e intrinsic activity results in a change from agonistic compounds t o their competitive antagonists. Phenomena, such as competitive inhibition a n d noncompetitive inhibition, auto-inhibition, etc., for t h e main p a r t , have t h e same characteristics as in t h e more simple t y p e of action described in Section I I . Two interesting concepts, viz., t h e threshold phenomenon a n d t h e receptor reserve evolved in a n a t u r a l way from t h e theory.
111.2. T H R E S H O L D P H E N O M E N A 111.2.1. Theory
Threshold phenomena in dose-response curves can be based on all-or-none mechanisms, as discussed before. There are other mechanisms t h a t m a y lead t o this phenomenon.
I n Section I I t h e effect was assumed to be linearly proportional t o t h e stimulus a n d t o s t a r t right away with t h e induction of t h e stimulus. I t is quite possible, however, t h a t as a result of a certain inertia in t h e biological object, an effect is only obtained after t h e stimulus reaches a certain threshold value.
I t m a y be, for instance, t h a t t h e contractile elements in t h e isolated organ have t o contract to a certain degree before t h e organ as a whole is shortened. Then, there is an interference of mechanical factors.
This situation can be t r e a t e d along t h e lines developed by Kirschner a n d Stone (50). I n t h e simplest case, t h e effect is linearly proportional t o t h e stimulus minus a constant s, t h e threshold value for t h e stimulus. Thus, E.../Em = (S.../Sm — s). Then, t h e dose-response curves plotted on a linear dose-scale will n o t pass through t h e origin.
111.2.2. Experiments
W h e n t h e dose-response curves—for ACh or SuChMe3, obtained with t h e isolated rectus abdominis muscle of t h e frog, or for H F M e3* with t h e isolated ileum of t h e r a t , or for ACh on t h e isolated ileum of t h e mouse—are plotted on a linear dose scale, an extrapolation of t h e curves results in a point of inter
section below zero (see Figs. 5, 6, 7, a n d 8). This phenomenon is very regular
* F stands for dioxolane in the formulas for its derivatives (see section II.A.2.2.).
402 Ε. J. ARIENS, Α. Μ. SIMONIS AND J. Μ. VAN ROSSUM
FIGS. 5-8. Cumulative concentration-response curves for some agonistic compounds: acetylcholine (ACh), succinylcholine (SuChMe3), and Dilvasene (HFMe3) in the presence of various concentrations of some competitively antagonistic compounds. Note how the curves intersect with the ordinate at a point below zero, which indicates a threshold in the concentration-effect relation and gives the value for this threshold. [Fig. 5, after Kirschner and Stone (50). Fig. 8, after Takagi and Kimura (95).]
Ι , Ι Π . RELATION BETWEEN STIMULUS AND EFFECT 403 in dose-response curves obtained with isolated organs acting u n d e r isotonic conditions, as in these experiments. Figures 6, 7, a n d 8 represent t h e same families of curves as represented in Section I I . A , Figs. 13,14, and 17. The point of intersection gives t h e value for sy t h e threshold value for t h e stimulus (6, 7).
Plotting of t h e d a t a in t h e way described by Lineweaver a n d B u r k (57) implies t h a t 1/effect is plotted against 1/dose. If t h e dose-response relationship exactly obeys t h e equations based on t h e mass action law (given in Section I I ) , straight lines are expected. From t h e m a differentiation between t h e various types of antagonism, competitive, noncompetitive, uncompetitive, etc., a n d a determination of various constants are possible (see Section I I . B , Fig. 27) (64).
I n t h e case of a competitive antagonism, t h e curves have a common point of intersection with t h e axis on which l/effect is plotted, a t least in theory (57).
Usually, plotting of pharmacological d a t a obtained with isolated organs according t o Lineweaver a n d Burk, does not result in straight lines, especially n o t if sufficiently long dose t r a c t s are studied. Figures 9, 10, 11, a n d 12 give a Lineweaver-and-Burk plot of t h e dose-response curves as represented in Figs. 5, 6, 7, a n d 8. The curves are not straight. The deviation m a y be caused by a lack of linear proportionality between t h e concentration of t h e drug in t h e b a t h fluid a n d t h a t in t h e biophase. I t m a y be t h a t t h e relation between drug and receptor does n o t follow t h e simple equations used, or t h a t t h e rela
tion between t h e stimulus evoked a n d t h e effect obtained is n o t linearly pro
portional. For t h e l a t t e r situation, an example is found in t h e all-or-none response a n d in t h e threshold relation just described. A plot of l/feffect-M]
against 1/dose, where s is expressed as a percentage of (100 + θ ) , will result in straight lines if t h e threshold phenomenon is t h e main cause of t h e deviation.
Figures 13, 14, 15, a n d 16 represent experimental dose-response curves, as given in Figs. 9 , 1 0 , 1 1 , a n d 12, plotted in this way. The curves are straightened by this procedure (50). This favors t h e assumption m a d e for t h e threshold a n d a t t h e same time shows t h a t t h e hypothesis used fits t h e experimental results.
The threshold in t h e dose-response curves is n o t found b y all investigators (19a, 81a). I t m a y be expected t h a t , if t h e lever a n d the isolated organ, respectively, are heavily loaded, t h e muscle fibers are stretched such t h a t a shortening of t h e fibers directly leads t o a shortening of t h e organ.
For drugs a n d biological objects for which threshold phenomena in t h e dose- response curves are found, a facilitation b y sub-threshold doses m a y be ex
pected. This applies t o compounds for which an additive relation exists, and, t h u s , t o agonists interacting with t h e same receptor system. I t m a y apply also t o compounds which induce their effect on different receptor systems, b u t , by means of a common effector system, e.g., a functional synergism (see Section II.B.4.1).
A comparison of t h e experimental dose-response curves represented in Fig. 27, Section II.A.3.4.6, with t h e theoretical dose-response curves of Fig. 3
404 Ε. J. ARIENS, Α. Μ. SIMONIS AND J. Μ. VAN ROSSUM
Ι,ΙΙΙ. RELATION BETWEEN STIMULUS AND EFFECT 405
FIGS. 9-12. Cumulative concentration-response curves as represented in Figs. 5-8, plotted according to Lineweaver and Burk. Note that because of the competitive relation between agonist and antagonist, the curves were expected to be straight. [Fig. 9, modified after Kirschner and Stone (50). Fig. 12, based on data of Takagi and Kimura (95).]
406 Ε. J. ARIENS, Α. Μ. SIMONIS AND J. Μ. VAN ROSSUM
FIGS. 13-16. Cumulative concentration-response curves as represented in Figs. 5-8 and Figs. 9-12, plotted according to Lineweaver and Burk and corrected for the threshold value, as found in Figs. 5-8. Note that after correction for the threshold value s, straight lines are obtained. [Fig. 13, after Kirschner and Stone (50). Fig. 16, based on data of Takagi and Kimura (95).]
Ι , Ι Π . RELATION BETWEEN STIMULUS AND EFFECT 4 0 7
demonstrates t h a t a facilitation b y sub-threshold doses is present in t h e experiments.
The sensitization of t h e rectus muscle of t h e frog for ACh by small inactive doses of butyrylcholine, is another example of a facilitation by sub-threshold doses (23). Butyrylcholine itself in higher concentrations also induces a con
traction of t h e rectus muscle. The effect of ACh and t h a t of butyrylcholine
. % contraction + a
100
°o-°/ocontract ion
mM
FIG. 17. Log concentration-response curves for a number of spasmogens tested on various isolated organs: histamine on the gut of the guinea pig; HFMe3 on the gut of the rat; SuChMe3 and BuNMe3 on the rectus abdominis muscle of the frog, as represented in Fig. 10, Section II.A. Log concentration-response curves: . Curves corrected for the threshold value s: . Theoretical curves: for η == 2, η = 1.5, η = 1.
Note that after correction, the slopes of the experimental curves approach that of the theoretical curve for η = 1.
are antagonized in a competitive way b y acetylcholinolytics, such as, for in
stance, curare. Analogous relations were described for combinations of sub
threshold doses of D e c a M e3 with SuChMe3 a n d SuChMe3 with ACh (62).
As mentioned in Section I I . A . 2 . 3 , there has been much discussion on t h e difference in t h e slope of t h e experimental dose-response curves and t h e curves calculated from t h e theory.
408 Ε. J. ARIENS, Α. Μ. SIMONIS AND J. Μ. VAN ROSSUM
The presence of a threshold phenomenon, as described above, implies t h a t t h e dose t r a c t covered by t h e dose-response curves is shorter t h a n t h a t covered by t h e dose-stimulus curves. This means t h a t t h e slopes of t h e first are steeper t h a n those of t h e latter. As demonstrated in Section I I . A , Fig. 10, t h e experi
mental curves are steeper t h a n t h e theoretical curves. The slope of t h e experi
mental curves after correction for t h e threshold values m a y be expected to approach t h e theoretical one more closely. The experimental dose-response curves given in Section II.A, Fig. 10 are represented again in Fig. 17, b u t now corrected for t h e thresholds. The difference in t h e slopes of theoretical and experimental curves is smaller after this correction.
111.3. RECEPTOR RESERVE III.3.1. Theory
Besides t h e occurrence of spare receptors in case of an all-or-none response as described before, such a reserve m a y also be caused by other mechanisms (6) (see Section I I I . 4 ) .
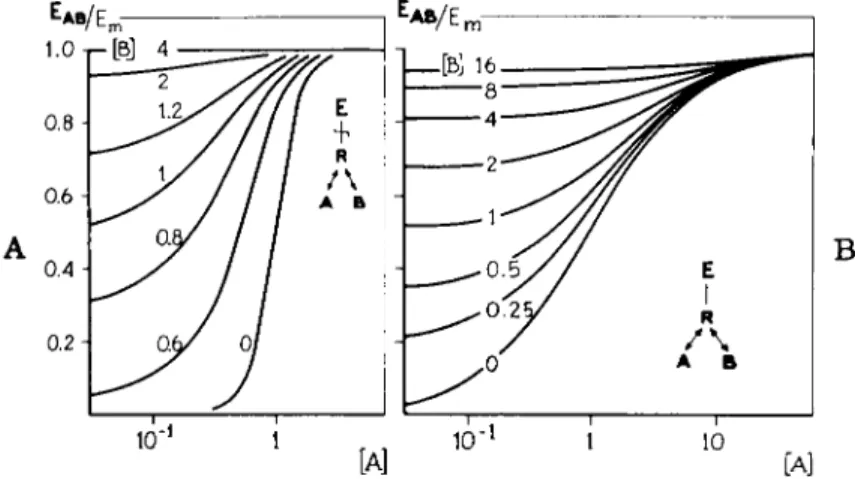
The occurrence of spare receptors for drugs with a high intrinsic activity has interesting consequences (88). The addition of a compound which blocks in an irreversible way t h e specific receptors, will result in a decrease or an annulment of the receptor reserve. Combination of such an irreversibly blocking agent with an agonistic compound with a high intrinsic activity, will result in a more or less parallel shift of t h e dose-action curves, until with higher concentrations of t h e blocking agent t h e receptor reserve is exhausted. Then, a decline in t h e curves becomes manifest. For a compound A with an intrinsic activity so low t h a t its maximum effect, EAm, is smaller t h a n t h e m a x i m u m effect possible with t h e biological object, Em, spare receptors are excluded. Such a drug has t o occupy all receptors available in order t o induce its maximal effect, EAm. For such a compound, addition of an irreversible blocker of t h e specific receptors will not result in a parallel shift of t h e curves, b u t only in a decline. Figures 18 a n d 19 represent theoretical dose-response curves for combinations of various drugs (A) with varying intrinsic activities, and t h e irreversibly blocking agent (B).
There is a clear difference in t h e curves for drugs with a n d drugs without a receptor reserve (5, 6, 82, 83).
If an irreversible blocker Β interacts with receptors different from those for t h e agonist A, t h e picture is different.
W h a t will happen if a compound with a reserve in receptors is combined with a reversible or irreversible noncompetitive antagonist?
1. When t h e antagonist interferes with t h e induction of t h e stimulus, its presence results in a shift of t h e dose-response curves of t h e agonist, followed b y a decline, j u s t as in t h e case of a n irreversible blockade of t h e specific receptors. The noncompetitive antagonist mentioned m a y be expected t o exhibit a certain specificity with respect t o t h e agonist. I t s point of a t t a c k
Ι,ΙΠ. RELATION BETWEEN STIMULUS AND EFFECT 409 m u s t be located close t o t h a t of t h e agonist. I t will bring to light a reserve in receptors for t h e agonist.
2 . When t h e noncompetitive antagonist does n o t interfere with t h e induc
tion of t h e stimulus b u t with t h e response in t h e effector system, it will result in a decline in t h e dose-response curves, without a preceding shift. I t interferes with one of t h e final reactions in t h e sequence of events leading t o t h e effect.
Such a noncompetitive antagonist will not bring t o light a reserve in receptors.
I t m a y be expected t o be rather nonspecific. Such a noncompetitive antagonist will inhibit all spasmogens which make use of t h e effector systems concerned,
I
10 I0
2 I10 I0
2Fig. 18
[ A]Fig. 19
wFIGS. 18 and 19. Theoretical log concentration-response curves for an agonistic com
pound A with a high (Fig. 18) and a low (Fig. 19) intrinsic activity, combined with various concentrations of B, an irreversible blocker of the specific receptors (5, 82). Concentrations in M~x. Note that the shift in the curves before a decrease in the maximum height and in the slope of the curves, takes place in the case of a high intrinsic activity (there is a receptor reserve). Note the absence of the shift in the case of a low intrinsic activity (there is no receptor reserve).
independently of t h e variation in t h e specific receptors used by t h e spasmogens a n d t h e t y p e of stimulus t h e y induce (5, 82). The musculotropic spasmolytics of t h e papaverine t y p e which act as antagonists of a great n u m b e r of spasmogen types (parasympathomimetics, sympathomimetics, histamine, BaCl2, etc.) are probably examples of such noncompetitive antagonists.
Whether, a n d t o w h a t degree, addition of an antagonist will result in a mani
festation of t h e reserve in specific receptors for t h e agonist by a parallel shift in t h e curves, depends on t h e point of a t t a c k of t h e antagonistic compound and on t h e t y p e of reaction, reversible or irreversible. Irreversible antagonistic compounds which occupy t h e receptors for t h e agonist will definitely bring t o light t h e full reserve in receptors.
410 Ε . J . A R I E N S , Α. Μ. SIMONIS AND J . Μ. VAN ROSSUM
111.3.2. Experiments
I I I . 3 . 2 . a . I R R E V E R S I B L Y B L O C K I N G A G E N T S
T h a n k s t o t h e work done b y Nickerson, Furchgott, Graham, a n d others (27, 31, 31a, 73, 74, 75, 76, 77), a n u m b e r of irreversibly blocking antagonists with sympatholytic, parasympatholytic, a n d antihistaminic properties are available. They all belong t o t h e jS-haloalkylamines. These compounds are related t o t h e nitrogen m u s t a r d s . Probably t h e y form chemical bindings of t h e covalent t y p e with reactive groups (SH, OH, etc.) on t h e surface of t h e specific receptor, t h u s blocking it in a n irreversible way (6,11, 31, 31a, 79). These drugs belong t o t h e group of alkylating agents.
The irreversible blockade is preceded b y a short phase of p a r t l y reversible blockade. (This phenomenon was discussed in Section II.A.7.2.a.) The irre
versible blockade is characterized b y t h e long duration of action when a whole animal is used a n d b y t h e antagonism n o t being reversed after repeated wash
ing in t h e case of isolated organs.
The specificity of t h e irreversible blocking action can be studied b y so-called protection experiments. When t h e sympathetic receptors are for t h e greater p a r t occupied in a reversible way b y a n agonist, such as arterenol, adrenaline or isopropylarterenol, or by a reversible competitive antagonist, for instance, a sympatholytic, t h e chemical binding between t h e irreversibly blocking agent and t h e sympathetic receptors will be delayed. They are protected against t h e irreversible blockade b y t h e agonist or b y t h e reversible competitive an
tagonist. F o r dibenamine a n d sympathetic drugs tested on t h e isolated aorta strip of t h e rabbit, F u r c h g o t t (27) proved t h a t a protection could be obtained by arterenol a n d epinephrine a n d b y their competitive antagonists, t h e sympatholytics.
I I I . 3 . 2 .b . R E C E P T O R P R O T E C T I O N E X P E R I M E N T S
The blocking action of dibenamine is n o t restricted t o t h e specific receptors for sympathetic drugs. The receptors for p a r a s y m p a t h e t i c drugs a n d those for histamine are also blocked. However, p a r a s y m p a t h e t i c drugs a n d histamine act on other specific receptors t h a n t h e sympathetic drugs a n d do n o t protect t h e sympathetic receptors against dibenamine. F o r t h e various sympathetic drugs, sympathomimetics a n d sympatholytics, there is a cross protection.
For drugs of various types, such as sympathetic a n d p a r a s y m p a t h e t i c or histaminic drugs, no crossed protection exists (see Tables I a n d I I ) .
Figures 20A, B , a n d C represent some protection experiments. The para
sympatholytic B u2F M e3 protects t h e receptors for t h e parasympathomimetic MeFMe3. The antihistaminic dibutyl pyretamine protects t h e receptors for histamine. The sympatholytic ^-isopropylarterenol protects t h e receptors for arterenol (8). As a rule in t h e usual doses t h e lytics appear t o have a better protecting action t h a n t h e mimetics. The mimetics occupy in t h e case of a
Ι,ΓΠ. RELATION BETWEEN STIMULUS A N D EFFECT 411
T A B L E I
CROSS PROTECTION AMONG SYMPATHOMIMETIC DRUGS AGAINST DIBENAMINE BLOCKADE"
Dibenamine Remaining Drugs tested before cone, during Drugs with sensitivity
and after dibenamine 2 0 min dibenamine during (% of incubation incubation incubation Cone. original)
Adrenaline ίο-6 None 0
ίο-6 -^-isopropylarterenol 3 · 1 0 ~4 1 0 0
ίο-6 None — 0 . 2
ίο-» Arterenol 3 - 1 0 -5 1 0
Arterenol 3 - 1 0 -6 None — 0
3 Ί 0 -6 Adrenaline i o -4 2 0
Ν - isopropylarterenol 1 0 - « None — 0
io-« Adrenaline i o -5 5
ίο-8 None — 0
i o -e Arterenol 3 - 1 0 -5 2 0 a After Furchgott (27).
TABLE II
ABSENCE OF CROSS PROTECTION OF O N E STIMULATING DRUG BY ANOTHER AGAINST DIBENAMINE BLOCKADE"
Drugs with Dibenamine dibenamine
Drugs tested before cone, during during incubation No. of and after dibenamine 2 0 min which failed to give experi
incubation incubation cross protection Cone. ments
Adrenaline 3 - 1 0 -6 Histamine i o -4 3
3 · 1 0 -Β Acetylcholine i o -3 1
Arterenol 3 - 1 0- β Histamine i o -4 1
ίο-5 Acetylcholine IO"3 1
Histamine 3 · 1 0 -Β Adrenaline i o -4 5
3 · 1 0 -Β Acetylcholine i o -5 1
Acetylcholine ίο-5 Adrenaline i o -4 1
ίο-5 Histamine i o -4 1
° After Furchgott (27).
receptor reserve in t h e usual doses only a fraction of t h e receptors a n d , there
fore, give in these doses only fractional protection.
The experiments represented in Fig. 20A, B , a n d C d e m o n s t r a t e t h a t com
petitive antagonists can p r o t e c t t h e specific receptors against irreversible
412 Ε. J. ARIENS, Α. Μ. SIMONIS AND J . Μ. VAN ROSSUM
blockade. I n this respect, it is of interest t o realize t h a t such protection cannot be obtained with noncompetitive antagonists. Figure 21A a n d Β represent dose-response curves analogous t o those of Fig. 20A, B , a n d C, b u t now with t h e noncompetitive antagonist papaverine. W i t h t h i s compound, no protection
°/o contraction; jejunum (rat )~
1 0 0
ileum (guinea pig)"
1 0- 3 1 0 '2 1 0 '5 mM M e F M e ,
Β
m M Histamine
% contraction: vas deferens (rat) - 100-
10"1 1 10
m M di- Arterenol
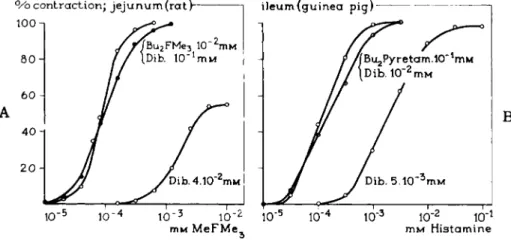
FIG. 2 0 . A , B, and C. Cumulative log concentration-response curves for the agonistic compounds MeFMe3, histamine, and dZ-arterenol after incubation of the organ with vary
ing concentrations of dibenamine for 10 min, and with dibenamine in the presence of the reversibly blocking agents Bu2FMe3, Bu2Pyretamine, and d-isopropylarterenol, respec
tively, where the reversibly blocking agents were added 5 min before dibenamine.
(Before adding the agonist after incubation, the organs were washed for 10 min.) Note that the incubation with the irreversible blocker dibenamine in the presence of the reversibly blocking agents Bu2FMe3, Bu2Pyretamine, and <2-isopropylarterenol is without effect because the receptors are protected. Without this protection, dibenamine, even in con
centrations lower than used before, induces a strong decrease and a shift in the curves for the agonists.
Ι,ΙΠ. RELATION BETWEEN STIMULUS AND EFFECT 413
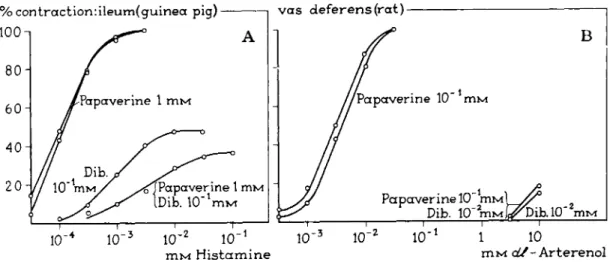
FIG. 21. A and B. Cumulative log concentration-response curves for the spasmogens histamine and arterenol after incubation of the organ with dibenamine for 10 min and with dibenamine in the presence of the reversible noncompetitive antagonist papaverine for 15 min.
Concentrations in mM. Papaverine was added 5 min before dibenamine. (Before adding the agonist after incubation, the organ was washed for 40 min.) Note that, in contrast to the cases represented in Fig. 20, the presence of the noncompetitive antagonist (papaverine) does not result in protection of the organ against the action of dibenamine.
414 Ε . J . A R I E N S , Α. Μ. SIMONIS AND J . Μ. VAN ROSSUM
is obtained (8). These experiments fully agree with t h e models used for t h e competitive and noncompetitive antagonism in Section I I . The protection experiments (Tables l a n d I I and Fig. 20A, B , a n d C) demonstrate t h a t there is still an element of competition in t h e irreversible blockade of specific receptors by compounds such as dibenamine. Nickerson (77) used t h e t e r m " n o n - equilibrium antagonism."
The competitive character of t h e irreversible blockade of specific receptors is especially clear in enzymology (23, 23a, 23b). Simultaneous addition of substrate and irreversible inhibitor results in dose-response curves with a clearly competitive appearance. The same obtains for dose-response curves obtained with certain microorganisms. See for instance Section I.B.5.2., Fig. 19B a n d compare this figure with Section I.B.5.2, Fig. 20B.
I t m a y be concluded t h a t dibenamine a n d t h e related /3-haloalkylamines fulfil t h e requirements for an agent which blocks in a n irreversible way specific receptors. These drugs are suitable t o elucidate a possible receptor reserve.
III.3.2.C. ANTAGONISTS AND I R R E V E R S I B L Y B L O C K I N G A G E N T S
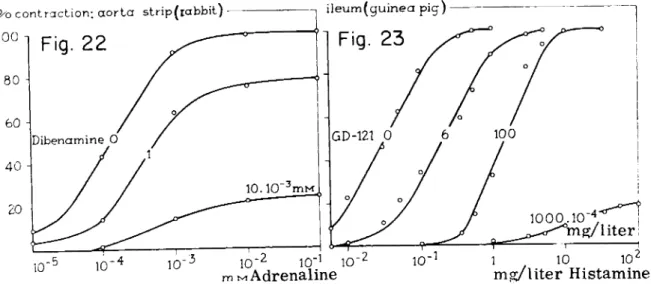
F u r c h g o t t (27) found t h a t t h e antagonistic action of dibenamine, with re
spect t o adrenaline tested on t h e isolated aorta strip of t h e rabbit, resulted in a shift of t h e curves followed b y a decline (Fig. 22). Analogous results were obtained by Nickerson (76) for combinations of β-haloalkylamines a n d hist
amine on t h e isolated gut of t h e guinea pig (Fig. 23). F o r this purpose certain concentrations of t h e blocking agents were left in contact with t h e isolated organ for a certain time, t h e incubation time. The degree of blockade varies with the concentration and t h e time. The shift in t h e curves possibly points t o a certain receptor reserve. Especially in t h e case of histamine on t h e isolated gut of t h e guinea pig, there is a considerable shift in t h e curves (Fig. 23).
If this shift really is t h e result of a reserve in receptors, it would imply t h a t only about 1 % of t h e specific receptors for histamine has t o be occupied by t h e drug in order t o obtain a maximal response from t h e isolated gut—a receptor reserve of 9 9 % (76). Can there be another reason for this shift in t h e curves?
H a r v e y et al. (38) demonstrated t h a t drugs like histamine and arterenol can themselves react with dibenamine a n d other /3-haloalkylamines. This means t h a t , if a p a r t of t h e dibenamine compound stays behind in t h e organ after incubation, it can cause a shift in t h e curves as a result of a chemical antagonism or antagonism by neutralization. F u r c h g o t t (27) found t h a t a repeated washing of t h e organ even for 3 hr, did not lead t o an elimination of t h e antagonistic action of dibenamine. We (6", 8) repeated t h e experiment of Nickerson (Fig. 23) and also found a shift, although somewhat smaller t h a n in his experiments. I n order to exclude an antagonism by neutralization, after t h e incubation of t h e isolated gut of t h e guinea pig with dibenamine, t h e tissue was exposed re
peatedly to high concentrations of t h e spasmogen histamine. This did not result in a change in t h e shift of t h e curves for histamine, so t h a t a chemical
Ι,ΙΠ. RELATION BETWEEN STIMULUS AND EFFECT 415
FIGS 22 and 23. Log concentration-response curves for the spasmogens adrenaline and histamine after incubation of the organs with various concentrations of 0-haloalkylamines which act as irreversible blockers of the specific receptors. (GD-121:JV-l-naphtylmethyl- AT-ethyl-fi-chloroethylamine.) Note that besides a decrease of the maximum height and the slope of the curves, a shift m the curves also takes place. Possibly, this indicates a receptor reserve. [Fig. 22, after Furchgott (27). Fig. 23, after Nickerson (76).]
416 Ε . J . A R I E N S , Α. Μ. SIMONIS AND J . Μ. VAN ROSSUM
antagonistic component in t h e action of dibenamine m a y be excluded. Hence, t h e shift in t h e dose-response curves (Figs. 22 a n d 23) can be ascribed t o a receptor reserve for t h e agonists used (compare with Fig. 18).
Is it possible to p u t this to a further test? As described in Section I I I . 3 . 1 , no receptor reserve exists for t h e compounds with such a low intrinsic activity t h a t t h e m a x i m u m effect obtained with t h e m is smaller t h a n t h e m a x i m u m effect obtained with compounds with a higher intrinsic activity. For such com
pounds, only a decline in t h e curves a n d no shift or a much smaller shift in t h e curves will occur after incubation of t h e tissue with t h e agent irreversibly blocking t h e specific receptors (Fig. 19). For compounds with a high intrinsic activity, t h e m a x i m u m effects obtained m a y be equal, although t h e intrinsic activities differ. If this is t h e case, a difference in t h e degree of shifting in t h e curves by t h e irreversibly blocking agent can be expected. The higher the intrinsic activity, t h e larger t h e shift (6, 52, 83).
Interesting test series in this respect are t h e cholinomimetic compounds where, according t o t h e 5-atom rule, t h e compounds with a 5-atom chain are more active, have higher p D2 values t h a n those with a 4-atom chain, when tested on t h e isolated gut of t h e r a t (see Section II.A, Table X V I ) . Should these differences in t h e pZ>2 values be ascribed to a difference in t h e affinity, t o a difference in t h e intrinsic activity in combination with a receptor reserve, or t o both? Figures 24, 25, 26, and 27 represent experimental dose-response curves obtained with two couples of 5- and 4-atom compounds combined with dibenamine. The shift of t h e curves is practically equal for t h e 5- and 4-atom compounds in each of t h e couples. This means t h a t t h e difference in activity m a y be ascribed t o a difference in t h e affinity a n d not in t h e intrinsic activity.
Consequently, t h e 5-atom rule is based on t h e affinity of t h e drugs t o t h e receptors (see Section II.A).
I I I . 3 . 2 . d . P A R T I A L AGONISTS AND I R R E V E R S I B L Y B L O C K I N G A G E N T S
On t h e basis of earlier studies, it is known t h a t t h e gradual change in t h e chemical structure of parasympathomimetic compounds, of sympathomimetic compounds and of histaminomimetic compounds can lead t o a decrease in t h e intrinsic activity of these compounds. The mimetics change gradually t o t h e corresponding lytics. This change takes place via compounds with a n intermediate intrinsic activity, also called partial agonists (see Tables X V I I I , X I X , and X X I V , a n d Fig. 5, in Section II.A).
To obtain a maximum response with these intermediate drugs, all receptors have to be occupied. This implies t h a t although a reserve in receptors exists, for the original mimetics, e.g., t h e parasympathomimetics H F M e3 a n d P e n t N M e3, no reserve in receptors is expected for t h e various respective inter
mediate compounds, e.g., E t F M e3 and H e x N M e3. The consequence is t h a t while, for t h e original mimetics, an incubation of t h e isolated organ with dibenamine results in a shift of t h e curves followed by a decline, for t h e
Ι,ΙΠ. RELATION BETWEEN STIMULUS AND EFFECT 417
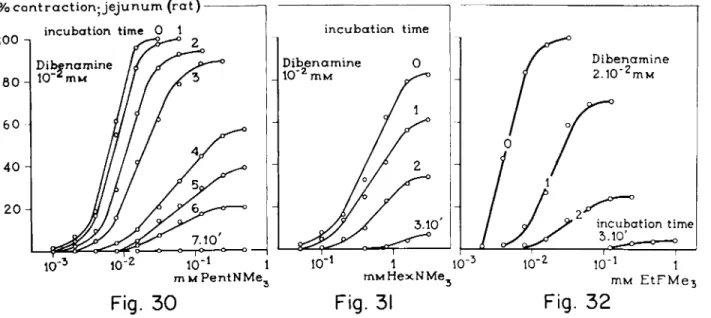
FIGS. 24-27. Cumulative log concentration-response curves for HFMe3and MeFMe3, HFurfMe3 and MeFurfMe3 after incubation of the jejunum of the rat with a constant concentration of dibenamine for various times. Unit incubation time: 10 min. Note the shift which pre
cedes the decline in the curves. Possibly, this indicates a receptor reserve.
418 Ε . J . ARIENS, Α. Μ. SIMONIS AND J . Μ. VAN ROSSUM
compounds with an intermediate intrinsic activity, a decline in t h e curves can be expected without a preceding shift (see Figs. 24, 25, 26, a n d 27),
The experiments demonstrate t h a t with compounds with an intermediate intrinsic activity—the parasympathomimetics, E t F M e3 and H e x N M e3, and t h e histaminomimetic, ethylpyretamine—the decline in t h e curves after dibenamine is not preceded by a clear shift in t h e curves, indicating t h e absence of a receptor reserve (see Figs. 29, 31, and 32 a n d compare with Figs. 28, 30,
% c u n t r a c t i o n ; i l e u m ( g u i n e a pig) incubation time 0 10U -i
vas deferens(rat)———
incubation time
10"* 10_ 1 10"
mvi H i s t a m i n e 10"1 1 m M /-Arterenol
Fig. 2 8 Fig. 2 9
FIGS. 2 8 and 2 9 . Cumulative log concentration-response curves for histamine and arterenol after incubation of the organs with constant concentrations of dibenamine for various times. Unit incubation time = 1 0 min. Note the shift which precedes a decline in the curves for histamine, and the decline in the curves for arterenol without a clear preceding shift. The absence of a shift in the curves indicates the absence of a receptor reserve.
a n d 24). The experimental results are in accordance with t h e theory. If t h e curves for histamine and H F M e3 from Fig. 17 are corrected for t h e receptor reserve, their slopes will approach still closer t h e slope of t h e theoretical curve for t h e value of η = 1. As a m a t t e r of fact for t h e drugs for which a receptor reserve exists, t h e intrinsic activity is not directly proportional t o t h e value of EA jEm, nor is t h e affinity any longer directly proportional to t h e pZ>2 value.
The possibilities of determining t h e intrinsic activities and affinities in t h e case of a receptor reserve will be discussed, in t h e following section.
111.3.3. Intrinsic Activity and Affinity in the Case of a Receptor Reserve
I I I . 3 . 3 . a . T H E O R Y
When t h e effect of a drug is supposed t o be linearly proportional t o t h e stimulus a n d this to t h e q u a n t i t y of drug-receptor complex formed, t h e
Ι,ΙΠ. RELATION BETWEEN STIMULUS AND EFFECT 419
FIGS. 30-32. Cumulative log concentration-response curves for the agonist PentNMe3 and the partial agonists HexNMe3 and EtFMe3 after incubation of the jejunum of the rat with constant concentrations of dibenamine for various times. Unit incubation time =10 min.
Note the shift which precedes a decline in the curves for HFMe3 (see Fig. 24) and for PentNMe3 (pure agonists) and the decline of the curves without a clear preceding shift for HexNMe3 and EtFMe3 (partial agonists). The absence of a shift in the curves possibly indicates the absence of a receptor reserve.
Fig. 30 Fig. 31 Fig. 32
420 Ε. J. ARIENS, Α. Μ. SIMONIS AND J. Μ. VAN ROSSUM
intrinsic activity is directly proportional t o t h e m a x i m u m effect t h a t can be ob
tained with t h e drug. This is no longer t r u e if threshold phenomena occur or if a receptor reserve exists. I n t h e case of an all-or-none response, as described above, t h e relation between t h e effect, EA/Em a n d t h e stimulus, SA/Sm, is of t h e t y p e represented in Fig. 33. The same relation obtains for EAJEm a n d SAJSm. The latter is supposed t o be proportional t o t h e intrinsic activity of t h e drug which means t h a t t h e curves in Fig. 33 also represent t h e relation between EA (Em and t h e intrinsic activity. I t can also be seen from this figure t h a t in t h e case of t h e all-or-none response t h e intrinsic activity is practically
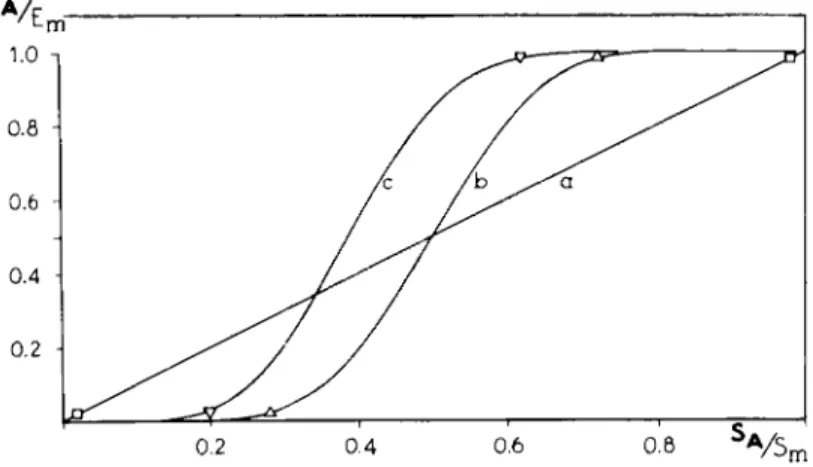
FIG. 33. Theoretical curves for the relation between the effect (E) and the stimulus (S) (a) when there is a direct proportionality and (b and c) when there is an all-or-none response with a biological variation according to a Gaussian distribution (82, 83). Note that, for cases b and c, an effect is obtained only after the stimulus reaches a certain value, which indicates a threshold phenomenon. A practically maximum effect is obtained long before the stimulus reaches its maximum value, which indicates the existence of a receptor reserve.
proportional t o EAJEm for values 0.2-0.8 (6, 83). For this reason it is suitable t o give t h e intrinsic activity a value of 0.5 when EA /Em is 0.5. The consequence is t h a t , as far as partial agonists are concerned, t h e intrinsic activity is reason
ably represented b y EAJEm for t h e case of a direct proportionality between stimulus and effect and for t h e case of t h e all-or-none response discussed here.
The same obtains for t h e pZ>2 values which t h e n give a reasonable measure for t h e affinity of t h e drug t o its specific receptors.
For values of EA jEm close t o u n i t y or close t o zero, t h e intrinsic activity is no longer proportional t o EAJEm because of t h e receptor reserve a n d threshold phenomena. The p D2 values are t h e n no longer a measure for t h e affinity.
How can t h e intrinsic activity be determined for drugs for which a reserve in receptor exists? An easy way t o approach experimentally t h e intrinsic
Ι , Ι Π . RELATION B E T W E E N STIMULUS AND E F F E C T 421 activity and t h e affinity of various drugs, including those with a reserve in receptors, is to block a fraction of t h e receptors such t h a t t h e maximal response obtained with t h e drugs in question is reduced t o a value of EAJEm = 0.5.
This means t h a t t h e stimulus is reduced to a constant value. The stimulus, in its t u r n , is proportional to t h e product of t h e intrinsic activity of t h e drugs and t h e fraction of t h e receptors not blocked. This implies t h a t t h e intrinsic activity is proportional then to t h e fraction of receptors blocked. This fraction, in its t u r n , is determined by t h e concentration of t h e irreversibly blocking agent, B, t h e incubation time, t, and the reaction-velocity constant, kB. For further details and a q u a n t i t a t i v e approach t o t h e estimation of affinity and intrinsic activity of drugs in t h e case of spare receptors, see van Rossum (83).
III.3.3.6. E X P E R I M E N T S
I n Section I I I . 3 . 2 , t h e qualitative aspects of spare receptors have been described. An a t t e m p t is made here t o determine t h e relative intrinsic activities and affinities of some series of homologous parasympathomimetic drugs.
I t has been shown in Section I I . A . 5 , t h a t a gradual increase of t h e length of t h e alkyl chain in alkyltrimethylammonium (RNMe3) and in 2-alkyl-4-(tri- methylammonium) methyl- 1,3-dioxolane (RFMe3) leads t o a gradual change from parasympathomimetics to parasympatholytics via intermediates or dualists (82).
I t might be interesting to measure t h e intrinsic activities for t h e agonistic compounds in these various homologous series of drugs. I n Tables X V I I I , X I X , a n d X X I V of Section I I . A , t h e intrinsic activities for these compounds is given a value proportional t o t h e m a x i m u m effect obtainable with t h e respective compounds. The consequence is t h a t for all pure agonists t h e intrinsic activity is given a value of unity. As was demonstrated in Section III.3.2, spare recep
tors exist for t h e agonistic compounds mentioned (see Figs. 30, 24, a n d 28).
Therefore, more information is necessary as far as their intrinsic activity is concerned.
Stephenson (88) calculated from his experiments on t h e isolated g u t t h e intrinsic activities for t h e pure agonistic compounds of t h e trimethylalkylam- monium (RNMe3) series, and found a m i n i m u m for t h e intrinsic activity of t h e propyl derivative. H e assumed t h a t t h e affinity of t h e various compounds in t h e series regularly increases with t h e number of carbon atoms in R.
The estimation of t h e intrinsic activity, based on t h e gradual elimination of t h e spare receptors by means of agents irreversibly blocking t h e receptors, is a very direct one. No assumptions have t o be made a b o u t t h e affinities of t h e compounds.
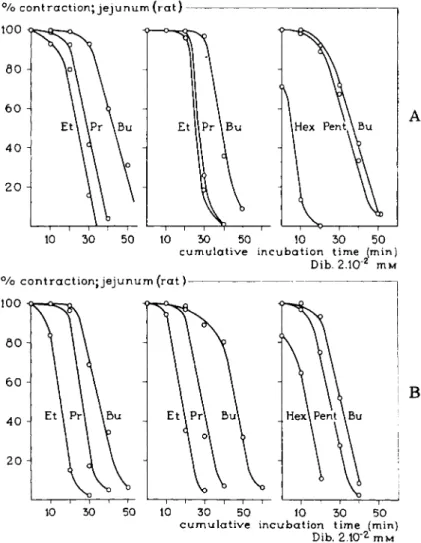
The results of various series of experiments with irreversible blockers are represented in Figs. 34 and 35. Contrary t o t h e findings of Stephenson, no minimum for t h e intrinsic activity is found for t h e propyl derivative in t h e R N M e3 series. The intrinsic activity gradually increases from t h e ethyl- via
422 Ε. J. ARIENS, Α. Μ. SIMONIS AND J. Μ. VAN ROSSUM
% contraction; jejunum (rat) 100
π r
10 50 50 10 30 50cumulative incubation time (min) Dib. 2.10"2 M M
% c o n t r a c t i o n ; jejunum (rat) 100
5 0 Η
Β
30 50 10 30 50 c u m u l a t i v e incubation time (min)
Dib. 2.10"2 m M
FIG. 34. A and B. Time-response curves for the relation between the maximum response obtained with the various compounds of the homologous series of RNMe3 derivatives after cumulative incubation of the isolated jejunum of the rat with the irreversibly blocking agent dibenamine (83). Note that the maximum responses obtained decrease with an increase of the time of incubation and, therefore, with an increase of the fraction of the receptors blocked. For the compounds with a reserve in receptors, such as the pentyl and the butyl derivatives, no decrease in the maximum response takes place after incubations which decrease the maximum response for partial agonists like the hexyl derivative. As far as the reserve in receptors is concerned, this gradually decreases from the butyl via the propyl to the ethyl derivative, which means that the intrinsic activities also gradually decrease. This is contradictory to the findings of Stephenson (88).
Ι,ΙΠ. RELATION BETWEEN STIMULUS AND EFFECT 423 t h e propyl- t o t h e butyl- a n d pentyl-derivative. The l a t t e r two have a b o u t equal intrinsic activities. Via partial agonistic compounds, such as H e x N M e3
(Fig. 34), t h e series ends in competitively antagonistic compounds (see Table X I X , Section II.A). Although some of t h e conclusions drawn by Stephenson (88) from his experiments have t o be rejected (83), he deserves m u c h credit in t h a t he emphasized clearly t h a t t h e relationship between stimulus and effect is n o t necessarily linear.
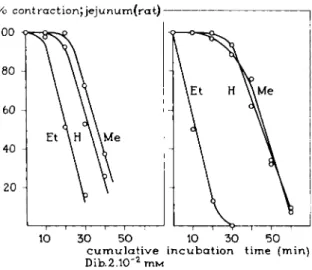
For t h e R F M e3 series, too, t h e relations represented in Figs. 24, 25, a n d 32 are confirmed. The ethyl derivative is a partial agonist (Fig. 35). The conse-
% contract ion Jjejunum(rat)
10 30 50 10 30 50 c u m u l a t i v e incubation time (min) Dib.2.10"2 m M
FIG. 35. Time-response curves for the relations between the maximum response ob
tained with the various compounds of the homologous series of dioxolane derivatives, RFMe3 (see Table X V I I I , Section I I . A ) , after cumulative incubation of the isolated jejunum of the rat with the irreversibly blocking agent dibenamine. Note that a reserve in receptors is absent for the partial agonist EtFMe3 (see Fig. 32), while a reserve in receptors exists for the pure agonists HFMe8 and MeFMe3 (see Figs. 24 and 25).
quence of these results is t h a t t h e decrease in t h e pZ)2 values (as mentioned in Tables X V I I I a n d X I X of Section II.A) is p a r t l y due t o a decrease in t h e a m o u n t of spare receptors and, therefore, t o a decrease in t h e intrinsic activity.
The introduction, in t h e experiments, of agents blocking t h e specific recep
tors in an irreversible way, has contributed essentially t o t h e further evolution of t h e receptor theory. The formation of covalent bonds between these jS-halo- alkylamines and certain functional groups of t h e receptor m a y make it possible in t h e future t o isolate alkylated, peptide degradation-products, which can t h e n provide direct information on t h e chemical properties of t h e receptors.
This technique of " m a p p i n g active s i t e s " has been applied very effectively on various esterases (23a, 42, 43, 44, 52a, 60, 78, 84).

![Fig. 18 [ A ] Fig. 19 w](https://thumb-eu.123doks.com/thumbv2/9dokorg/1157398.83711/16.648.110.546.264.523/fig-a-fig-w.webp)