Formal professional relationships between general practitioners and specialists: possible associations with patient health and pharmacy costs
by Ágnes Lublóy, Judit Lilla Keresztúri, Gábor Benedek
C O R VI N U S E C O N O M IC S W O R K IN G P A PE R S
http://unipub.lib.uni-corvinus.hu/1868
CEWP 4 /201 5
1
Formal professional relationships between general practitioners and specialists: possible associations with patient health and pharmacy costs
Ágnes Lublóy
Department of Finance, Corvinus University of Budapest Email: agnes.lubloy@uni-corvinus.hu,
Judit Lilla Keresztúri
Department of Finance, Corvinus University of Budapest Email: lilla.kereszturi@ uni-corvinus.hu,
Gábor Benedek
Department of Mathematical Economics and Economic Analyses, Corvinus University of Budapest and
Thesys SEA Pte Ltd.
Email: gabor.benedek@thesys.hu March 13, 2015.
Abstract
This article investigates whether the strength of formal professional relationships between general practitioners (GPs) and specialists (SPs) affects either the health status of patients or their pharmacy costs. To this end, it measures the strength of formal professional relationships between GPs and SPs through the number of shared patients and proxies the patient health status by the number of comorbidities diagnosed and treated. In strong GP–SP relationships, the patient health status is expected to be high, due to efficient care coordination, and the pharmacy costs low, due to effective use of resources. To test these hypotheses and compare the characteristics of the strongest GP–SP connections with those of the weakest, this article concentrates on diabetes—a chronic condition where patient care coordination is likely important. Diabetes generates the largest shared patient cohort in Hungary, with the highest traffic of specialist medication prescriptions. This article finds that stronger ties result in lower pharmacy costs, but not in higher patient health statuses.
Key points for decision makers
• The number of shared patients may be used to measure the strength of formal professional relationships between general practitioners and specialists.
• A large number of shared patients indicates a strong, collaborative tie between general practitioners and specialists, whereas a low number indicates a weak, fragmented tie.
• Tie strength does not affect patient health—strong, collaborative ties between general practitioners and specialists do not involve better patient health than weak, fragmented ties.
• Tie strength does affect pharmacy costs—strong, collaborative ties between general practitioners and specialists involve significantly lower pharmacy costs than weak, fragmented ties.
2
• Pharmacy costs may be reduced by lowering patient care fragmentation through channelling a general practitioner’s patients to a small number of specialists and increasing collaboration between general practitioner and specialists.
• Limited patient choice is financially more beneficial than complete freedom of choice, and no more detrimental to patient health.
JEL codes: C12, H51, I19
Keywords: general practitioners, specialists, formal professional relationships, patient sharing, strong vs. weak ties, patient health status, pharmacy costs
1 Introduction
Governments place increasing emphasis on primary and secondary care integration to achieve better and smoother patient care, enhanced collaboration among healthcare professionals, and an effective balance between community and hospital care, coupled with healthcare budget reduction. Shared care of patients with chronic diseases is critical to this integration and assumes formal and informal professional interactions among doctors. General practitioners (GPs) and specialists (SPs) enter in informal professional relationships when they email, call, or curbside one another with specific clinical matters—for example, GPs may seek information or advice from SPs prior to referring patients for care [1]. GPs and SPs enter in formal professional relationships when GPs refer patients to SPs and subsequent requests for information are formalised [2].1
This article investigates the characteristics of formal professional interactions between Hungarian GPs and SPs, materialised in referral and prescribing of specialist medications. It compares the characteristics of the strongest GP–SP connections with those of the weakest, the strength of the relationship being measured by the number of shared patients. In so doing, it examines possible associations between tie strength and patient health status, proxied by the number of comorbidities diagnosed and treated, as well as between tie strength and pharmacy costs. The direction of causality is unknown—higher patient health status and lower pharmacy costs might be prerequisites to higher numbers of shared patients, or might be consequences thereof. In line with intuition and empirical evidence, this article favours the latter—GPs managing information from fewer SPs enables better and smoother care coordination.
This article is a pioneering attempt at documenting the impact of formal professional relationships between GPs and SPs on patient health and pharmacy costs. Given the scarcity of (large-scale quantitative) studies, the a priori knowledge of professional relationships between GPs and SPs in shared care systems is far from complete. To the authors’
knowledge, only a few recent articles examined structural characteristics in the US [for example, 4–7]—and no study ever assessed characteristics elsewhere. Moreover, no study ever assessed the impact on patient health status—and only one study [7] investigated the impact on pharmacy costs.
1 The term general practitioner (GP) is synonymous with family doctor, family medical practitioner, generalist medical practitioner, and primary care doctor—GPs provide continuing and comprehensive medical care to individuals, families, and communities [3]. In contrast, the term specialist (SP) refers to a medical practitioner who focuses on certain disease categories, types of patients, or methods of treatment [3]. The term doctor describes any medical practitioner who holds a professional medical degree.
3
The dataset used in this article strengthens this investigation of unique associations—
professional relationships among doctors are identified through the rigorous evidence of administrative data rather than the survey and mail questionnaire approach of most prior research [for example, 8–10]. This allows measuring the strength of professional relationships in a way that would be almost impossible with survey data, and less prone to missing data—it can capture all doctors who share patients, not just those who respond to surveys, and all ties, not just those that can be extracted from responses to surveys.
This article is structured into five sections. Following this introduction, the second section discusses sample and methodology. The third section presents the results of the empirical analysis. The fourth section discusses the results, elaborates on their policy implications, and suggests unexplored questions. The fifth section summarises the research findings.
2 Sample and methodology
2.1 Healthcare in Hungary
The Hungarian healthcare system is primarily publicly funded, through taxation. Its universal health coverage sets minimum standards and aims to extend access as widely as possible. The National Health Insurance Fund of Hungary (NHIFH)—the central official agency of health insurance—provides benefits in kind and cash to insurees [11]. Patients are free to choose their GPs, who act as gatekeepers for the secondary and tertiary care provided by SPs. A capitation adjusted to patient age is the main source of GP revenue. A fee-for-service payment method finances outpatient services, with a limit on the volume of billable services. Most SPs are public employees, guaranteed minimum salary levels on a pay scale that takes into account qualifications and years of experience.
Due to pressure on hospital expenditure, the care of patients with chronic conditions is shared between GPs and SPs. In shared care, GPs act as first points of contact, for patients, and as gatekeepers, for secondary care, whereas SPs test, diagnose, and treat patients. When SPs initiate therapies with specialist medication, usually of high cost, GPs have to prescribe that medication for a time, usually for one year, significantly decreasing SPs’ workload and increasing their own. To obtain prescribed medication, patients have to visit their GPs monthly, allowing GPs to filter out—and refer back to SPs—cases where the health status had worsened under treatment. GPs channel patients—including those in shared care—to healthcare providers designated by NHIFH as nearest to either patient or GP. However, GPs can refer patients to any outpatient services in Hungary, provided that patients make such requests on referral—and that compliance with such requests does not endanger the treatment of patients in the catchment area of the preferred outpatient services.
2.2 Sample
This article uses the prescription data for 2010–11 available from DoktorInfo Ltd2, a health data collection and information services company based in Hungary. Twenty per cent of the GPs practising in Hungary feed real-time prescription data into this database voluntarily—
2 http://doktorinfo.com.
4
they are representative of the entire Hungarian GP population in both age and location (defined by region and population size). GPs are compensated for providing information such as GP identification number; prescription date; prescribed drug characteristics (brand name, ATC code3, and dosage); prescribed drug subsidy; patient characteristics (age and gender);
and, since January 2009, for patients whose care is shared, identification number of the therapy-initiating SP. The identification numbers of GPs and SPs enable the detection of formal professional relationships between prescribing GPs and therapy-initiating SPs.
This article concentrates on diabetic patients, defined as patients who receive at least one specialist drug from the A104 group—for example, insulin or an oral antidiabetic agent.
Following data cleaning, GPs who treated fewer than 20 diabetic patients were excluded from analysis—they may have been working only part time, fed data into the database only for a few months, or had very small practices. The final sample thus includes 794 GPs and 318 SPs in endocrinology who shared care for 31,070 diabetic patients. During the observation period 2010–11, GPs issued 509,281 specialist medication prescriptions for antidiabetic agents and 3,243,191 specialist medication prescriptions for other agents and initiated 332,635 antidiabetic therapies (for which they did not require prior SP approval)—a typical GP treated 39 diabetic patients and wrote 1,060 prescriptions for antidiabetic agents.
2.3 Identifying formal professional relationships among doctors
Diabetes, the area of interest for this research, is a particularly good choice for the purpose of identifying formal professional relationships among doctors for several reasons. First, the number of diabetic patients is already high and diabetes prevalence is increasing all over the world, due to changing food and lifestyle habits [12]. In Hungary, diabetic patients form the largest patient sharing subnetwork, with the highest traffic (measured by the number of specialist medication prescriptions). Second, diabetes is a clinical condition for which patient care coordination is likely important [7, 13]—complex activities require conscious interactions among parties, including timely transfer of accurate clinical information, effective communication, appropriate follow-up, and shared decision making [4]. Third, SPs treating patients with diabetes form a well-defined subgroup of doctors, with a rather dense patient sharing network.
In this article, similarly to the patient sharing networks constructed recently by Barnett et al.
[2], Pham et al. [4], Landon et al. [6], and Pollack et al. [7], a link between two doctors exists if they care for at least one patient together—an information readily and unambiguously available from prescription data, where the identification numbers of prescribing GPs and therapy-initiating SPs both appear on prescriptions (see subsection 2.2). 6,723 GP–SP connections were thus identified, representing 5.33 per cent of all potential ties between GPs and SPs—on average, a GP coordinated care with 8 SPs.
2.4 Strong versus weak ties between doctors
3 Drugs are classified into groups by the World Health Organization—through the Anatomical Therapeutic Chemical (ATC) Classification System—and, in the US, by the Uniform System of Classification (USC).
Groups reflect the organ or system on which drugs act and/or their therapeutic and chemical characteristics.
4 ATC code for drugs used in diabetes.
5
GP–SP connections vary in weight with the number of shared patients, more shared patients implying stronger professional relationships between doctors. Due to large variability in the number of patients shared, the strength or weakness of a tie needs to be defined by relative rather than absolute thresholds. Threshold levels depend on both total numbers of shared patients and patient distributions across SPs.
Fig. 1
Examples of GP–SP connections: GPs with single preference, with multiple preferences, and without preference
Accordingly, GP–SP connections are strong, if in the uppermost quintile; weak, if in the lowest quintile; or medium, if in between the two extremes. GPs may be strongly tied to more than one SP—in this particular sample, GPs have to refer at least 18 per cent of their patients to an SP to qualify for a strong tie with that SP. Further sensitivity analyses define the strongest connections as ties in the top decile/tertile and the weakest as ties in the bottom decile/tertile. Figure 1 shows three examples of GP–SP connections. In the first example, GP1 is strongly connected to one SP through 30 patients, representing 83 per cent of GP1’s diabetic patients. In the second example, GP2 is strongly connected to three SPs through 18, 8, and respectively 8 patients, representing 49, 22, and respectively 22 per cent of GP2’s diabetic patients. In the third example, GP3 is not connected strongly to any SP—10 patients, representing 17 per cent of GP3’s diabetic patients, is the highest number of patients shared with an SP. Connections in this example are either weak or, at the best, moderate—the collaborative structure is very fragmented.
2.5 Hypotheses
First, this article hypothesises that patients treated in strong GP–SP connections have better health statuses than those treated in weak GP–SP connections. As argued by Barnett et al. [5]
and Pollack et al. [7], sharing patients with a small number of SPs may lead to improvements in health outcomes due to the consolidation of clinical information and the management of patient care. This view is supported by the systematic literature reviews of Lemieux-Charles and McGuire [14] and Bosch et al. [15], who reported that good teamwork among medical professionals improves clinical performance and outcomes.
6
Second, this article hypothesises that patients treated in strong GP–SP connections involve lower pharmacy costs than those treated in weak GP–SP connections—high numbers of shared patients are assumed to promote appropriate, effective use of resources. In the treatment of diabetes, the systematic review of van Walraven et al. [16] found that better care coordination was associated with lower health utilisation, including lower hospitalisation and fewer emergency visits. Empirical evidence suggests that healthcare delivery is more cost- efficient when the numbers of shared patients are higher. The recent studies of Barnett et al.
[5] and Pollack et al. [7] found evidence that patients treated by doctors who share high numbers of patients between them tend to have lower costs of care and healthcare utilisation, most probably due to efficient collaboration. Pharmacy costs constitute a significant proportion of the total cost of care—more than 20 per cent in the case of diabetes [7].
2.6 Outcome measures
Patient health status is proxied by the number of comorbidities diagnosed and treated—
evidently, the higher the number, the poorer the health status. This article uses four comorbidity measures, including the Charlson comorbidity index [17], the Quan-modified Charlson comorbidity index [18], and the Elixhauser measure [19] identified by Sharabiani, Aylin, and Bottle [20] as the most common. The Charlson comorbidity index predicts the ten- year patient mortality for a range of 19 diseases selected and weighted based on the strength of association with mortality. However, since mortality is likely to have changed since the development of the original index in 1984, the Quan-modified Charlson comorbidity index uses updated weights. The Elixhauer measure contains 30 carefully selected comorbid conditions—as suggested by Quan et al. [21], this article employs ICD-105 codes to identify which of those apply to the patients in the sample. To control for potential bias in ICD-10 coding, this article also measures comorbidity by counting the number of third-level ATC codes6 on which the patient received at least one prescription semi-annually. All four comorbidity measures are applied to the specialist medication prescriptions written by GPs in addition to prescriptions for antidiabetic agents.
Pharmacy costs are measured at patient level as the sum total of the retail prices for drugs, including antidiabetic agents, prescribed by GPs in 2010–11—they include the amount paid by patient as well as any drug subsidy. Private and public pharmaceutical expenditure are thus considered jointly to assess the total cost to society.
2.7 Statistical analysis
The two hypotheses are analysed at GP–SP connection level (see Tables 1 and 2). Based on the doctors in charge of their care, patients are assigned to their respective GP–SP connections. If a patient consulted more than one SP during the observation period, SPs’
shares in the patient’s care are weighted proportionally to the number of prescriptions initiated. The means of the outcome measures are then calculated—as well as weighted, for
5 International Statistical Classification of Diseases and Related Health Problems 10th Revision [22].
6 The third level of an ATC code includes the main anatomical group (first level, one letter), the main therapeutic group (second level, two digits), and the therapeutic/pharmacological subgroup (third level, one letter), but excludes the chemical/therapeutic/pharmacological subgroup (fourth level, one letter) and the chemical substance (fifth level, two digits) [23].
7
patients assigned to the same GP–SP connection—and compared. The skewed distributions of tie strengths—as well as the associations with patient health status and pharmacy costs, assumed nonlinear similarly to Pollack et al. [7]—suggest a quintile-based categorisation, with strong ties in the uppermost quintile and weak ties in the lowest quintile (see subsection 2.4). The health and cost implications of strong ties versus weak ties are therefore evaluated using t-tests, considered significant if the p-value is less than 0.05. Sensitivity analyses are also carried out for the alternative definitions of strong and weak ties (see subsection 2.4).
3 Results
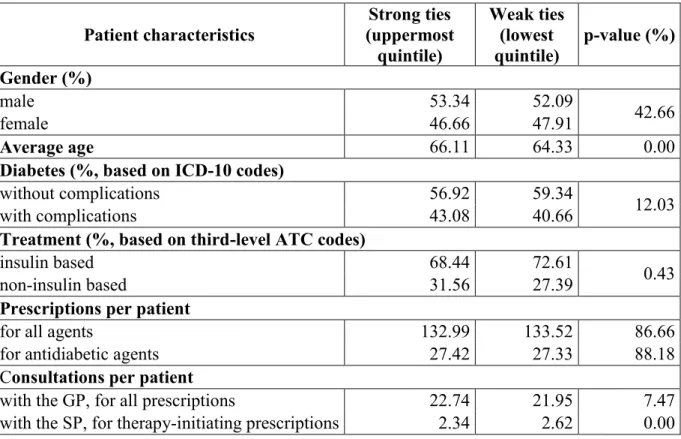
Table 1 compares characteristics of patients treated in strong GP–SP connections with those of patients treated in weak GP–SP connections and shows mean values or proportions, as appropriate. Patients treated in strong ties are slightly (by 1.78 years) older, are less dependent on insulin-based therapies, and consult less frequently with their SPs. The two cohorts do not differ significantly in gender mix, disease severity, number of prescriptions (in total or only for diabetes), or frequency of consultations with GPs.
In Table 2, all four comorbidity measures indicate that tie strength does not affect patient health status—patients treated in strong GP–SP connections have the same number of comorbidities as those treated in weak GP–SP connections, and the first hypothesis is rejected. At the same time, tie strength does affect pharmacy costs, which are 15.14 per cent lower for patients treated in strong GP–SP connections than for those treated in weak GP–SP connections. Since the difference is statistically significant, the second hypothesis is accepted.
Sensitivity analyses for the alternative definitions of strong and weak ties (see subsection 2.4) confirm these findings with p-values very similar to those presented in Table 2.
Table 1
Strong ties versus weak ties between GPs and SPs: patient characteristics Patient characteristics
Strong ties (uppermost
quintile)
Weak ties (lowest quintile)
p-value (%) Gender (%)
male 53.34 52.09
42.66
female 46.66 47.91
Average age 66.11 64.33 0.00
Diabetes (%, based on ICD-10 codes)
without complications 56.92 59.34
12.03
with complications 43.08 40.66
Treatment (%, based on third-level ATC codes)
insulin based 68.44 72.61
0.43
non-insulin based 31.56 27.39
Prescriptions per patient
for all agents 132.99 133.52 86.66
for antidiabetic agents 27.42 27.33 88.18
Consultations per patient
with the GP, for all prescriptions 22.74 21.95 7.47
with the SP, for therapy-initiating prescriptions 2.34 2.62 0.00
8 Table 2
Strong ties versus weak ties between GPs and SPs: outcome measures Outcome measures Strong ties
(uppermost quintile) Weak ties
(lowest quintile) p-value (%) Patient health status (excluding diabetes)
Charlson comorbidity index 0.93 0.91 43.64
Quan-modified Charlson
comorbidity index 0.60 0.60 82.66
Elixhauser measure (based on ICD-
10 codes) 1.98 1.95 42.33
Additional comorbidity measure
(based on third-level ATC codes) 8.01 7.98 83.93
Pharmacy costs (thousand HUF) 612.18 721.41 0.00
4 Discussion
The health status of patients treated in strong GP–SP connections is very similar to that of patients treated in weak GP–SP connections (see Table 2). Tie strength is thus not associated with variation in patient health status—comorbidities are distributed evenly across tie strength. If strong GP–SP connections are characterised by efficient care coordination, then this efficiency does not reflect in enhanced patient health status.
However, pharmacy costs for patients treated in strong GP–SP connections are significantly lower than those for patients treated in weak GP–SP connections (see Table 2)—a major benefit for the society as a whole. Since the number of prescriptions per patient does not vary with tie strength (see Table 1), the explanations behind the significant difference in pharmacy costs must be sought elsewhere. Detailed scrutiny of the data reveals that two conditions need to be met to identify these explanations. First, the drug is important to patients—summing up drugs at a second-level ATC code (see footnote 6) totals at least 3 per cent of all prescribed drugs. Second, the difference in pharmacy costs at a second-level ATC code (see footnote 6) is in the top quintile. The four explanations thus identified are:
• The share of A10 drugs from the total number of drugs patients receive is high irrespective of tie strength, but slightly lower for patients treated in strong GP–SP connections (27.48 per cent) than for those treated in weak GP–SP connections (28.18 per cent). A10 drugs are much more expensive than non-A10 drugs—EUR 24.2 (weighted average of all A10 prescriptions) compared with EUR 6.4 (weighted average of all non-A10 prescriptions)—
slight differences in prescribing shares lead to important differences in pharmacy costs.
• The treatment method varies with tie strength—significantly fewer patients are treated with insulin and significantly more patients are treated with oral antidiabetic agents in strong GP–SP connections than in weak GP–SP connections (see Table 1). Oral antidiabetic agents are generally cheaper than insulin—EUR 11.4 (weighted average of all oral antidiabetic agent prescriptions) compared with EUR 30.1 (weighted average of all insulin prescriptions)—metformin is a very cheap oral antidiabetic agent and has been used for decades as the choice/first-line treatment for type 2 diabetes mellitus.
9
• The prescribing of beta blockers (C07)7, calcium channel blockers (C08)8, analgesics (N02)9, and phycholeptics (N05)10 also varies with tie strength, being significantly higher for patients treated in strong GP–SP connections than for those treated in weak GP–SP connections. At around half the mean price of all the other non-A10 drugs in the sample, these are relatively cheap drugs.
• The prescribing of A0211 drugs also varies with tie strength, being significantly lower for patients treated in strong GP–SP connections than for those treated in weak GP–SP connections. These drugs cost around 8 per cent more than all the other non-A10 drugs in the sample.
These differences in pharmacy costs are in line with Barnett et al. [5], Landon et al. [6], and Pollack et al. [7], who found that doctors who share high numbers of patients between them tend to have lower total costs than others. Whereas Barnett et al. [5] assessed the overall inpatient, outpatient, imaging, and laboratory test costs, Pollack et al. [7] assessed the overall outpatient, inpatient, and pharmacy costs. Counterintuitively, however, when the overall costs were split by components, Pollack et al. [7] found higher pharmacy costs for diabetic patients with higher care density (a patient-based quantifier of patient sharing)—the authors provided no explanation for this association.
This article bears important policy implications with regards to the free choice of healthcare providers advocated in many developed countries, such as the UK and the Netherlands—GPs may struggle to coordinate care, if they have to share patients with more SPs as a result, and the pharmacy costs would be higher. Healthcare strategists need to advocate limited rather than unrestricted choice, coupled with enhanced medical education and technical infrastructure—patients need excellent providers, in small numbers and close geographic proximity. This would benefit patients, by savings on travel times and costs, and the wider society, by savings on pharmacy costs.
This article has a number of limitations worth future further exploration. First, formal professional relationships between GPs and SPs were concluded based on prescription data, a technique validated by Barnett et al. [2]. Sharing patient care is likely to generate enhanced information exchanges and interactive communication—it is therefore plausible that patients treated in stronger GP–SP connections receive better coordinated care than those treated in weak GP–SP connections. However, what particular information and/or behaviours—if any—
pass along the ties defined by shared patient care is unknown. The approach adopted in this article suggested conditions more or less favourable towards coordinated care. Nevertheless, high numbers of shared patients do not necessarily lead to information exchanges between two doctors on every single patient. Second, the significant associations revealed in this article are based on an observational study—results should not necessarily be interpreted as causal and the adequacy of the assumed causal mechanisms should be further explored. Third, the authors developed a proxy for patient health status, but were unable to assess whether patients treated in stronger GP–SP connections perceived better care—or were more satisfied—than others. Fourth, pharmacy costs are just one element of the total patient care costs—additional analyses are necessary to examine other elements, such as outpatient and
7 Cardiovascular system drugs for treating angina, irregular heartbeats, heart attack, heart failure, and high blood pressure.
8 Cardiovascular system drugs for treating angina, irregular heartbeats, and high blood pressure.
9 Nervous system drugs for alleviating pain.
10 Nervous system drugs with calming effects.
11 Alimentary tract and metabolism drugs for acid related disorders.
10
inpatient costs, as main outcome measures. Fifth, identifying doctors’ professional and socio- demographic characteristics was beyond the scope of this article, but would offer further insights into lowering pharmacy costs, not least for healthcare strategists and policy makers.
Sixth, the SPs analysed in this article were all endocrinologists—future research needs to investigate results for validity with other specialties. Seventh, formal professional relationships between GPs and SPs are likely to be in flux—their future analysis should be enhanced by longitudinal data.
5 Summary
In chronic illness care, many patient outcomes may only be achieved if the clinical activities of different health professionals—such as GPs and SPs—are intentionally coordinated.
Improving patient care coordination has become a key focus in healthcare reform and a national priority in numerous countries. However, assessing patient care coordination is as challenging as achieving it. This article took a leap forward in measuring the possible impact of professional relationships between GPs and SPs on patient health and the cost of patient care. In particular, it investigated whether tie strength is associated with the number of comorbidities diagnosed and treated, but found no evidence that a collaborative relationship through many shared patients results in enhanced health statuses. However, the efficiency of care coordination was reflected in cost savings—patients treated in strong GP–SP connections involve significantly lower pharmacy costs than those treated in weak GP–SP connections.
Overall drug expenditure may thus be reduced by lowering patient care fragmentation through channelling a GP’s patients to a small number of SPs. To harvest the financial benefits stemming from efficient patient care coordination, healthcare policy strategists need to advocate limited patient choice rather than complete freedom of choice.
Ethical standards
The prescription data used in this article were collected by a reputable government-endorsed organisation in agreement with the relevant Hungarian and international legislation—they are available to all specialist public by subscription. This article used the prescription data in an aggregate format, in no way detrimental to individual or collective patients and doctors—
patients and doctors can be identified neither individually nor collectively on the basis of this article. The use of prescription data in this article was in accordance with the ethical standards laid down in the 1964 Declaration of Helsinki and its later amendments and as such was approved by the Ethics Committee of Corvinus University of Budapest.
Acknowledgements
The authors are grateful to DoktorInfo Ltd, for waiving the subscription charge in the interest of scientific research; Petra Baji, Edina Berlinger, and László Gulyás, for valuable comments and suggestions on an earlier draft; participants at the 2014 Joint International Health Economics Association (iHEA) and European Conference on Health Economics (ECHE) Congress and participants at the 2014 Annual Meeting of the Decision Sciences Institute (DSI), for helpful discussions; Anamaria M. Cristescu-Martin, for editorial assistance; and AXA Research Fund (http://www.axa-research.org), for awarding Ágnes Lublóy the post- doctoral research grant that enabled this research.
11 Funding and conflicts of interest
DoktorInfo Ltd has played no role in study design; in the analysis and interpretation of data;
in the writing of this article; or in the decision to submit it for publication. AXA Research Fund has played no role in study design; in the collection, analysis, and interpretation of data;
in the writing of this article; or in the decision to submit it for publication.
References
1. Keating NL, Zaslavsky AM, Ayanian JZ. Physicians’ experiences and beliefs regarding informal consultation. JAMA. 1998;280(10):900–4.
2. Barnett ML, Landon BE, O’Malley AJ, Keating NL, Christakis NA. Mapping physician networks with self-reported and administrative data. Health Serv Res. 2011;
doi:10.1111/j.1475-6773.2011.01262.x.
3. WHO. Classifying health workers: mapping occupation to the international standard classification. In: Health workforce—data and statistics. WHO. 2010.
http://www.who.int/hrh/statistics/Health_workers_classification.pdf. Accessed 4 Jul 2013.
4. Pham HH, O’Malley AS, Bach PB, Saiontz-Martinez C., Schrag D. Primary care physicians’ links to other physicians through Medicare patients: the scope of care coordination. Ann Intern Med. 2009; doi:10.7326/0003-4819-150-4-200902170-00004.
5. Barnett ML, Christakis NA, O’Malley AJ, Onnela JP, Keating NL, Landon BE. Physician patient-sharing networks and the cost and intensity of care in US hospitals. Med Care.
2012; doi:10.1097/MLR.0b013e31822dcef7.
6. Landon BE, Keating NL, Barnett ML, Onnela JP, Paul S, O’Malley AJ, Keegan T, Christakis NA. Variation in patient-sharing networks of physicians across the United States. JAMA. 2012; doi:10.1001/jama.2012.7615.
7. Pollack CE, Weissman GE, Lemke KW, Hussey PS, Weiner JP. Patient sharing among physicians and costs of care: a network analytic approach to care coordination using claims data. J Gen Intern Med. 2013; doi:10.1007/s11606-012-2104-7.
8. Lou B, De Civita M, Ehrmann Feldmann D, Bissonauth A, Bernatsky S. Care partnerships between family physicians and rheumatologists. The Journal of Rheumatology. 2011; doi:10.3899/jrheum.101150.
9. Wensing M, van der Eijk M, Koetsenruijter J, Bloem BR, Munneke M, Faber M.
Connectedness of healthcare professionals involved in the treatment of patients with Parkinson’s disease: a social networks study. Implement Sci. 2011; doi:10.1186/1748- 5908-6-67.
12
10. Lublóy Á, Váradi K. General practitioner–specialist relationships in shared care systems:
insights from a review of the literature. Pannon Management Review. 2013;2(3):79–111.
11. NHIFH. Tasks of the National Health Insurance Fund of Hungary. In The National Health Insurance Fund mission, core activities and powers. NHIFH. 2014.
http://www.oep.hu/felso_menu/rolunk/kozerdeku_adatok/tevekenysegre_mukodesre_von atkozo_adatok/a_szerv_feladata_alaptevekenysege_es_hatarkore/en_a_szerv_alapteveke nyege_feladata_es_hatarkore. Accessed 16 Feb 2015.
12. WHO. Global status report on noncommunicable diseases 2010: description of the global burden of NCDs, their risk factors and determinants. In: Publications. WHO. 2011.
http://www.who.int/nmh/publications/ncd_report2010/en. Accessed 15 May 2014.
13. Wagner EH, Austin BT, Von Korff M. Organizing care for patients with chronic illness.
The Milbank Quarterly. 1996;74(4):511–44.
14. Lemieux-Charles L, McGuire WL. What do we know about health care team effectiveness? A review of the literature. Med Care Res Rev. 2006;
doi:10.1177/1077558706287003.
15. Bosch M, Fabe MJ, Cruijsberg J, Voerman GE, Leatherman S, Grol RPTM, Hulscher M, Wensing M. Review article: effectiveness of patient care teams and the role of clinical expertise and coordination: a literature review. Med Care Res Rev. 2009;
doi:10.1177/1077558709343295.
16. van Walraven C, Oake N, Jennings A, Forster AJ. The association between continuity of care and outcomes: a systematic and critical review. J Eval Clin Pract. 2010;
doi:10.1111/j.1365-2753.2009.01235.x.
17. Charlson ME, Pompei P, Ales KL, MacKenzie CR. A new method of classifying prognostic comorbidity in longitudinal studies: development and validation. J Chronic Dis. 1987;40(5):373–83.
18. Quan H, Li B, Couris CM, Fushimi K, Graham P, Hider P, Januel JM, Sundararajan V.
Updating and validating the Charlson comorbidity index and score for risk adjustment in hospital discharge abstracts using data from 6 countries. Am J Epidemiol. 2011;
doi:10.1093/aje/kwq433.
19. Elixhauser A, Steiner C, Harris DR, Coffey RM. Comorbidity measures for use with administrative data. Med Care. 1998;36(1):8–27.
20. Sharabiani MTA, Aylin P, Bottle A. Systematic review of comorbidity indices for administrative data. Med Care. 2012; doi:10.1097/MLR.0b013e31825f64d0.
21. Quan H, Sundararajan V, Halfon P, Fong A, Burnand B, Luthi JC, Saunders LD, Beck CA, Feasby TE, Ghali WA. Coding algorithms for defining comorbidities in ICD-9-CM and ICD-10 administrative data. Med Care. 2005;43(11):1130-9.
13
22. WHO. International statistical classification of diseases and related health problems 10th
revision. In: Classifications. WHO. 2015.
http://apps.who.int/classifications/icd10/browse/2015/en. Accessed 31 Jan 2015.
23. WHO. Introduction to drug utilization research. In: Essential medicines and health products information portal: a World Health Organization resource. WHO. 2003.
http://apps.who.int/medicinedocs/pdf/s4876e/s4876e.pdf. Accessed 9 Feb 2015.
![T Euphorbiapedroi Pedrolane,aPolycyclicDiterpeneSca ff oldContainingaBicyclo[2.2.1]heptaneSystem,from](data:image/gif;base64,R0lGODlhAQABAIAAAP///wAAACH5BAEAAAAALAAAAAABAAEAAAICRAEAOw==)