BRIDGES OVER THE DIGITAL DIVIDE
György LENGYEL–László LÕRINCZ–Viktória SIKLÓS–Dániel FÜLEKI Corvinus University, Department of Sociology and Social Policy Budapest, Fõvám tér 8. H-1093; e-mail: gyorgy.lengyel@uni-corvinus.hu
Corvinus University, Department of Sociology and Social Policy Budapest, Fõvám tér 8. H-1093; e-mail: lorinczl@freemail.hu Corvinus University, Department of Sociology and Social Policy Budapest, Fõvám tér 8. H-1093; e-mail: viktoria_siklos@yahoo.com
Corvinus University, Department of Sociology and Social Policy Budapest, Fõvám tér 8. H-1093; e-mail: daniel.fuleki@uni-corvinus.hu
Abstracts: The study investigates the digital divide concerning computer literacy in Hungary. It examines the differences of computer literacy of people with different social-demographic characteristics (gender, settlement type, education, labor market presence and income). It also investigates the intentions to learn computer skills. In this respect, smaller differences have been found then in the case of actual knowledge, which predicts the narrowing down of digital divide in the future. An attempt has been made to identify the institutional, technical and primordial conditions in everyday life that may influence both computer literacy and inclination to master the computer, and hence may function as “bridges” over the digital divide. Four of these factors have been studied: access to computers at the workplace, public internet access at the settlement, communication via cellular phone and effect of the family members’ ICT knowledge. Statistical analysis and in-depth interviews were used as methods of examination. Based on logistic regression models it was found that the bridging factors exert weak or insignificant influence on the willingness to learn computer skills – if they are controlled – so these factors alone are insufficient to bridge the digital divide.
Keywords:digital divide, Internet, ICT and society, computer literacy, Hungary, empirical analysis
INTRODUCTION
The study investigates how individual and social endowments influence computer literacy and the inclination to acquire it. It starts out from the empirically based assumption that computer literacy has a positive impact on life chances, and computer knowledge is considerably influenced by the individual’s market position, cultural and demographic indicators. There may be systematic and profound differences in
computer literacy between those present on the internal labor market and those who have dropped out of it, between the rich and the poor, the urban and the rural population, between the educated and the uneducated, the young and the older. We are going to investigate these differences and the possible connections between them.
There may as well be institutional, technical and primordial conditions that affect these differences as they are connected to the readiness to acquire computer literacy. We investigate four elements of everyday life which may influence computer literacy and learning intentions: access to computers at the workplace, information centre (telehouse)1 at the settlement, communication via cellular phone and effect of the family members. We would like to test the strength of these endowments in bridging the digital divide, – if it exists at all. Our fieldwork took place in the remote Kaposvár sub-region of south-west Hungary – a place which could be characterized with rich cultural heritage and average social-economic conditions.2
In the following – after browsing the relevant literature and clarifying the key concepts, sample and methods – we set some hypotheses concerning the digital divide and the bridges over it. We test the hypotheses with logistic regression models built on survey material collected during our fieldwork.
The term digital divide is used in researches inquiring about the chances of various social groups to join the information society. A broad approach to it is given by OECD (2001) claiming that the digital divide signifies a variety of differences among and within countries as well.3
Within a society, digital divide means that there are systematic and profound differences among the social groups with regard to their knowledge of and access to information technology. In its extreme form it may mean that some groups identified by certain characteristics (residence, schooling, age, ethnicity, etc.) are excluded from the information society and other groups are included. The digital divide is normally measured by the use of the Internet tied to the information society, but the examination of the use of the computer indispensable for it or the computation of the access indices are also relevant. The quantification of the digital divide is basically an empirical issue; its pioneering study was a series of papers made in the United States by the Department of Commerce and NTIA.4 The authors examining the digital gap also studied empirically the differences among countries in search of the factors determining the use of, or access to information technologies.5
1 The equivalents of which in the USA are the Community Technology Centers or CTCs.
2 Kaposvár city, the centre of the sub-region – some 180 km from Budapest – is the birthplace of the outstanding 20th century painter, József Rippl-Rónai and remembers on it with a nice exhibition. It was famous about its avant-garde theatre during the years of state socialism, and still it is a cultural and university centre. Unemployment rate in the sub-region was 5.6% compared to the national average 5.3%, the rate of economic inactivity is 42%, just as the national average (Source of data: Population Census 2001:www.nepszamlalas.hu).
3 Digital divide is the gap between individuals, households, businesses and geographic areas at different socio-economic levels with regard both to their opportunities to access information and communication technologies and to their use of the Internet. The digital divide reflects various differences among and within countries (OECD 2001).
4 Falling through the Net,http://www.ntia.doc.gov/ntiahome/digitaldivide.
5 See, for example: Kiiski and Pohjola 2002; Hargittai 1999.
What the participants of the debate over the digital divide question is not the differences at a given point of time but the normative principle which claims that equalization with regard to the digital goods is necessary. They ask whether these goods are different from other consumer goods, or not. One opinion says that the fact that someone has something and others don’t does not prove that an important social problem is at issue. Those who stress the existence of the digital divide often fail to test whether the differences in certain social dimensions coalesce into a system or not.
They also fail to ascertain whether there are social mechanisms that can smooth out, or sharpen the initially marked differences, which is the most important question in our opinion. It is important to realize that we are examining a temporal process: the spread of a technology, and its diffusion into various social strata. A brand new technology is usually very costly at first, then - when successful - its cost decreases and it spreads farther and farther. Some analysts thus claim that it all boils down to the fact that after the appearance of an innovation its possession might mean an advantage that the possessors did pay for in the higher price, and when it is cheap enough to spread wide, it no longer means an advantage or an upgraded variant of the technology has appeared again. The NTIA report says that between 1998 and 2000 the (always insignificant) gap had disappeared between men and women in the aspect of Internet use, and rural households had come almost abreast of the national average (NTIA 2000: xv-xvi). All this does not mean that the differences have disappeared. They are often there, but they must be measured by other variables. It is not meaningful to analyze in the above context in which household there was a mobile phone in 2002 and in which there was not. The real difference is shown by the number of cellular phones in a household and what they are used for. In other words, when a technology has spread, the original difference in its use shifts to its varying quantities or qualities, or again, to an improved technology. (As for the Internet, see e.g., Hargittai 2002). By directing now the attention to the phenomena of the process of diffusion in addition to the fact of the digital divide, we do not mean to say that the initial differences are insignificant and will automatically be eliminated. We lay the emphasis on the investigation to see how strong the social mechanisms promoting diffusion are and to what extent they are capable of toning down the differences.
For a study of the temporal spread of a technology, it is highly important how the innovation is defined. It would be simplifying to use the indicator “PC” as such because it is not sure that someone who bought a Commodore at the beginning of the
‘90s had an advantage over someone who bought his first PC in the mid-’90s.
Although various accesses to the Internet only differ in the bandwidth, it may significantly influence the habits of using it. Further arguments for the temporariness of the digital divide may be that the Internet-related inequalities mostly derive from the high costs and the lack of computer literacy. There is, however, a position that claims that the association of the Internet with the computer might disappear soon via a cheap and generally available technical leap (mobile-phone or television-based Internet), and this will create a fundamentally new situation.
At any rate, it is generally maintained that keeping clear of digital culture implies the threat of lasting backwardness. It is to be noted that it may be fruitful to compare Hungary with the advanced countries in terms of Internet diffusion, but at the time of
the study Hungary has considerable arrears not only behind West European but also behind some Central European countries in this regard.6
The analysts of the diffusion theory concerned with the spread of various innovations also predict that different social groups will join in at different points of time (Rogers 1995; Valente 1995; Katz 1999). The bottom-line to the theory is that during the spread of an innovation people do not make isolated decisions but influence one another; hence diffusion is a socially embedded process. Generally one can differentiate an impact depending on others and one independent of that (which is identified by some scholars with the impact of the mass media, e.g. Mahajan et al.
1990). These two effects – the one implied by social connections and the other one that is independent of that – are differentiated in their classic study by Coleman, Katz and Menzel (1966). Examining the use of a new drug they showed that though the great majority of doctors first heard of the new drug from the visit man, they did not begin to use it before hearing about it from two other sources (e.g. other doctors). An examination of the impact of relations revealed that the beginning of application was considerably influenced by factors independent of personal relations, but when the doctors were divided into socially integrated and isolated groups, it turned out that the spread of the drug was a linear process among the isolated doctors while among the integrated the use of the drug spread at an accelerating pace due to the contacts. This pattern - the so-called network effect, which practically means the positive correlation between the number of existing computers and new users - is demonstrated empirically for the US towns by Goolsbee and Klenow (2002).
In the model ofhomophyly(Lazarsfeld and Merton 1964) people tend to establish relationships with people of similar faith and knowledge, as they understand each other more easily. Interaction with other kinds of people might be frustrating, hence rarer.
By the same token, innovations also mainly spread in similar groups (e.g. the computer among higher-ranking managers, Kearns 1992). Applied to information technologies, the theory provides plausible explanation to the emergence of the digital divide:
technologies first spread in higher-status groups and owing to homophyly, they are hindered in their diffusion to other social groups.
The phrase bridging the digital divide refers to efforts aimed to alleviate the inequalities (e.g. Servon 2002; Schön et al. 1999). It may designate a wide spectrum of policies. The OECD (2001) report, for example, names the following: improvement of network infrastructure (development of infrastructure, regulations to enhance network competition), spread of access (in school and in other public institutions), education, training (in schools and vocational training), the promotion of diffusion to business (support for small business and to rural areas), state projects (on-line services), and international cooperation. Several civil organizations are concerned about the digital divide independently of governments: they provide various forms of training and
6 Our computations show that the extent of the digital divide (DIDIX) measured by a 1
–
100 scale, with the lower number indicating the wider gap was 55 points in the EU countries in the first quarter of 2002 and 37 points a year later in Hungary. The average value computed for East-Central Europe including Estonia, Lithuania, Latvia, Poland, the Czech Republic, Slovakia, Hungary, Slovenia, Romania and Bulgaria was 43 points (Lengyel 2003). A similar lag is demonstrable in the spread of information technology, see e.g. the data of the World Internet Project or Eurobarometer.access to poor countries as a frequent example of aid. It may be a logical assumption that the spread of information technology and the appearance of local networks may contribute to the expansion of the social resources and to the strengthening of collective activity. Investigations, however, have suggested that the networks have served to reactivate the earlier strong connections, and conversely, the former strong collective activity contributed considerably to the appearance of local networks (Hampton and Wellman 2002; Kavanaugh and Patterson 2002). These studies do not deal with the question, if the bridges exist or not on the level of society. Effectiveness of e.g. a new technology center is measured at the micro level by the number of people successfully finished a course, and therefore they trivially have some effect. It is not necessarily true for the macro level. To test the existence of the bridging effect in the society, we use the concept of bridging in a wider sense than development policies do:
we search for factors that may be related to the inclination to acquire computer literacy hence they influence the differences, cutting across the dimensions of the digital divide, “creating a bridge”.
One of these factors may be access to computers at work; another is the existence of a telehouse or other public Internet access. Under the diffusion theory, the telehouse exerts a great influence mostly when PCs are not yet included in households, since supplementary information concerning the usefulness of PCs is then more important.
A telehouse may also be more effective when it is run together with other institutions.
According to the ideology of the telehouse movement, the institution performs various communal functions at the same time, acting as a communal meeting place, bringing the information technology closer to the population:
“Since our telehouse was opened, the number of PCs in households of the village has soared, from zero to 72. In 72 families it was more important between 1996 and 2001 to get a computer for the children instead of drinking more. That’s a great thing. That was one aim... If it did not exist at Neszmély today, 72 families would have no computers and the children of Neszmély could not come close to computers in the Hungary of 2001. It means the working off of some arrears.”
“It is its mission to put these systems at the disposal of the children so that they may be the key to the skills of learning. It cannot be realized unless you sit down by them...”(I.N., Neszmély)
The validity of the above argument is of course weakened by the fact that between 1996 and 2001 computers multiplied considerably in villages without telehouses as well. A similar sense of mission was expressed by another interviewee:
“So it is that I want to help the villagers that they should know more things, be more educated, that’s where I try to do my best to improve the people’s minds. It’s very important today, I think today the building of communities is highly important mainly in small settlements, but we are incapable of doing it alone, we need help. But it’s all a bit too late because the world changes so rapidly and I am desperate because we always trail somewhat at the back, and then we are even treaded upon.”(M.F., Cserénfa)
The telehouse can contribute to the spread of computer literacy and use also because it is supported by a proclaimed intention. American examples reveal that one of the clues to successful CTCs and programs (providing training and other programs in addition to access to computers) is the leader with a sense of mission (Servon 2002:
156) who tries to involve the people personally if necessary.
In the following, we first present our hypotheses about the digital divide and the bridges, describe the investigation and the sample, then try to ascertain whether the digital divide exists or not. Then we try to specify our hypotheses more precisely and test their validity.
HYPOTHESES
We propose two hypotheses about the digital divide and four about bridging the gap.
D1. Concerningcomputer literacy,there are systematic and considerable differences by the major social-demographic variables (age, gender, settlement type, school qualifications, labor market presence, and income) and the differences are correlated.
D2. Concerning the inclination to learn the computer, also significant and systematic differences are expected along the social-demographic indicators, and the differences are expected to be of similar extent to those concerning computer literacy.
H1. The first bridge hypothesis assumes that those who have access to the computer at work stand better chances of acquiring computer literacy than the rest.
The possibilities heard of at work, the acquired skills and challenges acquaint many adults with computer culture. Access to the computer at work may provide personal experience and information from the colleagues.
H2. Though there are significant differences between towns and villages in the indicators of information penetration, it is still one of the most promising aspects of information technology that it may bridge the distances in social space. Therefore, according to our second hypothesis,the info-communicational supplies of a settlement are positively correlated with the inclination of the population to learn the computer, even controlled by the differences between towns and villages. It is expected that a telehouse or other public Internet access is positively correlated with the computer literacy of the populace and with their readiness to learn it, and the relative computer provisions of the settlement also positively correlates with the inclination to learn it. It may considerably speed up the diffusion of the information technology in a settlement that no risky family investment is needed for someone to use the computer or access the Internet. First-hand information about computers or the Internet can also be got from those who attend the telehouse. There is substantial difference between information from the media and the experience of people like us concerning the usefulness of the technology. The existence of such an institution promotes familiarity with the phenomenon and may also facilitate interaction in such a special space, and also, there is often someone who can be asked for help.
H3. Although there is a marked difference in the size of investment required by a cellular phone and that needed by a PC, and the degree of complexity of using the two devices is also different, there are, however, a lot of similarities and positive
correlations in both the possession and the required skills between the two. Since the mobile phone is more widely spread, we expectthose who use the SMS to stand above-average chances to learn the computer.This hypothesis is in harmony with the models of innovation theory, in that familiarity with cellular communication decreases the distance to and hesitation about the new technology.
H4. A lot of skills are acquired at random, without an organized form. This is a low-cost, though naturally accidental mode of acquiring knowledge. There are people who prefer this manner of learning because they feel uneasy at organizing training courses. It is not frictionless for an authoritative father to learn the use of the Internet from his child, but such difficulties are not insurmountable within the family. We expect to find that ifthere is someone in a person’s family who has computer literacy, then the person himself is more inclined to learn the computer.
In this case, the family relation is a strong bond and the computer user is the information broker who mediates knowledge about the computer and the network society he has acquired in other media (school, workplace) (Burt 1999). One’s decision about the innovation is largely influenced by personal relations, as demonstrated e.g. by the Coleman–Katz–Menzel study cited above. Those who have such family contacts should, in theory, be more interested in the computer and in learning it.
We are aware that the factors we study do not automatically eliminate the systematic social differences in the possession of information technology. Though in-family learning may lessen the knowledge gap between the elderly and the young, it does not affect the chances of access of the poor and the rich. The possibility to learn at work does not affect the jobless. However, any prospective welfare policy effort aiming to smooth out the differences between settlements and social groups concerning the chances of access to computers may take into account the efficiency, effects and side-effects of the bridges and channels of diffusion.
We wish to test these hypotheses with table statistics and logistic regression models. (In the models in which the dependent variable is the readiness to learn the computer users are omitted from the analysis.)
ABOUT THE SURVEY AND THE SAMPLE
We used for the analysis a database recorded for the sub-region of Kaposvár in the course of a research by the Department of Sociology and Social Politics of BUES in January 2002. The sampling ratio was considerably high in the sub-region: 0.8%
among those above 18 years of age, 1.8% of households was included in the sample.
Corresponding to the real distribution, the sample contains the town Kaposvár with a great weight (55%), the rest of the cases coming from 23 of the 77 smaller settlements in the sub-region.7We also carried out several personal in-depth interviews to track the
7 The empirical survey was conducted by the Mimikri Public Opinion Poll Co., with a two-step random sample. Weighting was done by age and gender (Lengyel 2002).
diffusion process in the smaller villages, and attitudes of people about information society in the sub-region.
Table 1.Internet use and pc at home: data of the Kaposvár sub-region and the national average
Kaposvár Sub-region (01.
2002.)
National average (09. 2001 – World Internet Project) (also computed for the
population over 18)
Internet use 11.7% 14.6%
Access to computer at home 29.0% 25.4%
The studied sub-region of Kaposvár corresponds to the national average in its indicators of information technology, including computer access, being slightly above it within the margin of error.
Along various indices different dimensions of the digital divide can be interpreted (DiMaggio et al. 2001). Now the stress is laid on access, use and competence which are naturally strongly interrelated. In 98% of the families having computers there was at least one person who was competent to use it, and computer literacy raises the chances of buying computers (14% of the non-competent as against 52% of the competent planned to buy PCs). Thus, in an examination of the digital divide it is worth looking at computer literacy as independent variable because, beside that it is itself an indicator of digital divide it also may be an important explanatory factor of access and use. Two main causes are named to explain exclusion from the information society: lack of economic resources and lack of interest. Future differences in computer use – which practically means admission into the information society – are largely dependent on knowledge and readiness to learn. Out of the two factors, material resources will play a smaller role when the technology will be widely available.
DIGITAL GAPS IN THE SUB-REGION Table 2.Computer literacy in different social groups
% Cramer’s V Sig.
Population 37.3
Activity: pensioners 11.5 .54 .000
Schooling: 8 primary grades or less 8.3 .55 .000
Income: lowest quartile 21.6 .29 .000
Settlement: villages 33.1 .08 .02
Age: over 60 8.8 .39 .000
N= 798
Computer literacy is strongly correlated with the labor market presence: over four-fifths of the managers and intellectuals, nearly half the entrepreneurs, while only slightly more than one-tenth of the pensioners can use a computer. Since about the same rate of computer literacy characterizes blue-collar workers and non-pensioner inactive populations – above one-third –, info-communicational knowledge is actually structured by the labor market in two ways. One factor is presence on the labor market; the other factor is whether one pursues blue-collar, white-collar or entrepreneurial work on the labor market. The two effects are similar. 20.3% of the inactive population, 57.5% of the active population has computer literacy. Within the active category, 35.8% of blue-collar workers and 78.1% white-collar workers/entrepreneurs could use the computer.
(Cramer’s V of active status was 0.384, of the color of the collar 0.428.)
Obviously, there is powerful correlation between school qualifications and computer literacy: less than one-tenth of people with primary school, while two-thirds of those who have finished secondary school can use the computer. Computer literacy also shows strong correlation withage.Competence is highest among the youngest – aged 18–29 – at 65% and decreases by about 10% by generations, sinking to 32% in the group of those aged 40–59. There is a drastic difference between that middle-aged group and the generation above 60, a mere 8.8% of who can use the computer.
Computer literacy is also tied toincome,but the connection is weaker. There is also a significant, though smaller, difference in the computer literacy ofurban and rural populations.
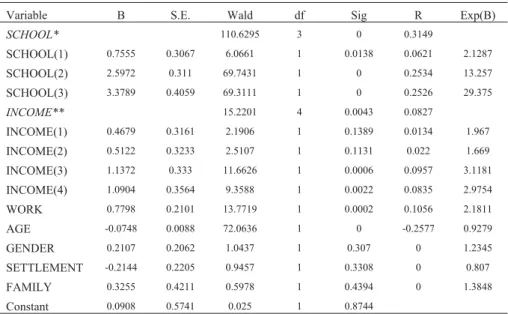
Table 3.Digital divide concerning computer literacy (multivariate analysis)
Variable B S.E. Wald df Sig R Exp(B)
SCHOOL* 110.6295 3 0 0.3149
SCHOOL(1) 0.7555 0.3067 6.0661 1 0.0138 0.0621 2.1287
SCHOOL(2) 2.5972 0.311 69.7431 1 0 0.2534 13.257
SCHOOL(3) 3.3789 0.4059 69.3111 1 0 0.2526 29.375
INCOME** 15.2201 4 0.0043 0.0827
INCOME(1) 0.4679 0.3161 2.1906 1 0.1389 0.0134 1.967
INCOME(2) 0.5122 0.3233 2.5107 1 0.1131 0.022 1.669
INCOME(3) 1.1372 0.333 11.6626 1 0.0006 0.0957 3.1181
INCOME(4) 1.0904 0.3564 9.3588 1 0.0022 0.0835 2.9754
WORK 0.7798 0.2101 13.7719 1 0.0002 0.1056 2.1811
AGE -0.0748 0.0088 72.0636 1 0 -0.2577 0.9279
GENDER 0.2107 0.2062 1.0437 1 0.307 0 1.2345
SETTLEMENT -0.2144 0.2205 0.9457 1 0.3308 0 0.807
FAMILY 0.3255 0.4211 0.5978 1 0.4394 0 1.3848
Constant 0.0908 0.5741 0.025 1 0.8744
Notes:
*: school qualifications: comparison: 8 primary grades or less. 1: skilled worker, 2: GCE; 3: higher education
**: income categories: comparison: lower quartile. 1: 2ndquartile, 2: 3rdquartile, 3: upper quartile, 4: refused to reveal
N=799; Cox&Snell R2: 0.406; Nagelkerke R2: 0.554
The digital divide can be demonstrated with logistic regression models apart from cross-tabulation. The analysis reveals that the R2confirms the existence of the gap in computer literacy. As for the variables, all the above-examined variables proved significance except for Kaposvár vs. villages and family size (one-person family or not). This prompts the conclusion that though the explanatory variables are interrelated, the divide is multidimensional and the background variables also exert their influence individually. In the multivariate model the direction of relation is the same as expected on the basis of the two-variable analysis for the significant variables.
This means that there was no variable in the bivariate analyses, that’s effect was only the consequence of its correlation with other explanatory variables.
Comparing the results of theTablebelow with our hypotheses about the digital divide, one finds that the majority of economic and cultural endowments also exert considerable influence on the inclination to learn to use the computer, but this association is generally weaker than the ones for actual knowledge. In one case, that of the town-village difference, the fairly weak association lost its significance concerning readiness to learn.
All this is sufficient basis to conclude that the digital divide exists but it is not deepening. The differences concerning a readiness to learn are less marked than the differences in actually acquired knowledge. The indicators of the digital divide usually influence computer literacy and the readiness to acquire it at the same direction. A far larger portion of the young knows and would learn it than the older generations – there is a very strong association between age and intention to learn, and the same applies to active people versus inactive people, etc. There is, however, one factor along which knowledge and the readiness to learn run contrary to one another: the dimension of income. The higher the studied quartile of income, the larger the rate of computer literacy, while the highest rate of readiness to learn was found in the lowest income quartile. That, in turn, predicts the narrowing of the gap: the poor strata characterized by worse indicators are most inclined to learn. We anticipate that this state of affairs is not only attributable to the fact that more young people belong to the lower brackets of household income.
Table 4.Rate of those who are ready to take part in a computer course8
% Cramer’s V Sig.
Population 24.3
Activity: pensioners 8.6 .37 .000
Schooling: 8 primary grades or less 16.8 .17 .002
Income: lowest quartile 38.0 .21 .000
Settlement: villages 26.3 .05 n.s.
Age: over 60 3.4 .5 .000
N=501
8 The question was: Q82.f: Would you take part in computer course for a reasonable fee, which were organized in the settlement? (Y, N, DK, NA)
The associations of the explanatory variables reveal that there is a far higher rate of people with less schooling among the population above 60. As for the association of income and school qualifications, the acquisition of the GCE is important (increasing the chances to belong to the upper quartile and significantly decreasing the chances of belonging to the lower two quartiles). A further effect of the same direction is exerted by the diploma of higher education. The comparison of Kaposvár vs. the villages reveals that in the latter there are fewer people with GCE and even fewer with diplomas, hence fewer are in posts of intellectuals/managers, but in Kaposvár the rate of the elderly are higher, while in the villages that of the younger is higher.
In the villages, more people have education of only 8 primary grades or less, and since on the average, there are not more pensioners, probably higher is the rate of the active people with lower qualifications.
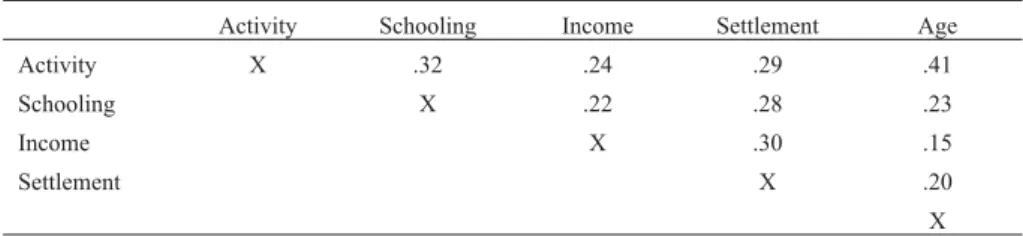
Table 5.Association of the variables of the digital divide (Cramer’s V)
Activity Schooling Income Settlement Age
Activity X .32 .24 .29 .41
Schooling X .22 .28 .23
Income X .30 .15
Settlement X .20
X
The correlation among activity, schooling, age and income is self-evident: the unqualified and low-income people are overrepresented among the aged inactive people. In the studied sub-region differences in computer literacy have been found most of which can be described by the term digital gap. Since most of the variables display systematic correlations, the term digital gaps can rightly be replaced by the term digital divide in this area of research.
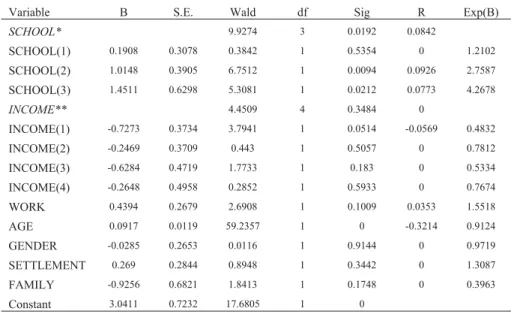
It can be gleaned from a multivariable analysis of the digital divide in learning inclinations that the dimensions of the divide are interrelated again. The analysis of the logistic regression model – examining computer non-users as against schooling, income, workplace activity, age, type of settlement (Kaposvár/villages), family type (single/not single) and gender – has revealed the following: schooling – GCE and higher qualifications – has significantly increased the readiness to learn; there is a strongly negative impact of growing age upon learning readiness; while the type of settlement, type of family, workplace activity and gender exert no significant effect.
As compared to the model constructed for computer literacy, the significance of the variables has decreased substantially. Income was just above the lowest mark of significance, and its sign seems to turn between the first and second quartiles. The coefficient of those in the upper income quartile and those who refused to say their income (presumably being affluent) lost its significance, unlike in the model of computer literacy. Similarly, workplace activity ceased to be significant; its effect was only due to its correlation with the age. R2also decreased significantly. Our second hypothesis about the digital divide – the readiness to learn is supposed to be influenced
just as strongly by social-demographic variables as is literacy – could not be verified.
Though the will to learn is influenced by the majority of the social-demographic variables, the association is far weaker than for existing computer literacy.
Table 6.Digital divide concerning the readiness to learn the computer (multivariate analysis)
Variable B S.E. Wald df Sig R Exp(B)
SCHOOL* 9.9274 3 0.0192 0.0842
SCHOOL(1) 0.1908 0.3078 0.3842 1 0.5354 0 1.2102
SCHOOL(2) 1.0148 0.3905 6.7512 1 0.0094 0.0926 2.7587
SCHOOL(3) 1.4511 0.6298 5.3081 1 0.0212 0.0773 4.2678
INCOME** 4.4509 4 0.3484 0
INCOME(1) -0.7273 0.3734 3.7941 1 0.0514 -0.0569 0.4832
INCOME(2) -0.2469 0.3709 0.443 1 0.5057 0 0.7812
INCOME(3) -0.6284 0.4719 1.7733 1 0.183 0 0.5334
INCOME(4) -0.2648 0.4958 0.2852 1 0.5933 0 0.7674
WORK 0.4394 0.2679 2.6908 1 0.1009 0.0353 1.5518
AGE 0.0917 0.0119 59.2357 1 0 -0.3214 0.9124
GENDER -0.0285 0.2653 0.0116 1 0.9144 0 0.9719
SETTLEMENT 0.269 0.2844 0.8948 1 0.3442 0 1.3087
FAMILY -0.9256 0.6821 1.8413 1 0.1748 0 0.3963
Constant 3.0411 0.7232 17.6805 1 0
Notes:
*: schooling: comparison: 8 primary grades or less. 1: skilled worker, 2: GCE; 3: higher education
**: income categories: comparison: lower quartile. 1: 2nd quartile, 2: 3rd quartile, 3: upper quartile, 4:
refused to reveal
N=552; Cox&Snell R2: 0.273; Nagelkerke R2: 0.407
The difference between the two models in variable significance may derive from the fact that from the model of readiness to learn the computer users were naturally excluded, hence the number of cases was smaller. On the bases of our calculations, it slightly reduced the significance of the variables of income and labor market presence, yet it cannot be blamed for the disappearance of significance on the whole.
On the other hand, our generalizations are limited in one way: the readiness of a respondent to take part in a low-cost computer course accounts for only a little part of learning readiness. The richer are presumably more ready to attend courses without discount (this is supported by the negative correlation between income and readiness to take part in courses) and some even prefer “learning by doing” instead of organized training.
All things considered, the essential point is that there are not so wide and multidimensional differences in the readiness to learn the computer as in computer literacy itself. That may predict the decrease in the differences in computer literacy, hence the shrinking of the digital divide.
BRIDGES OVER THE DIGITAL DIVIDE
The fact that someone uses a mobile phone (SMS) a lot is in a close but not necessarily unidirectional correlation with computer literacy and the readiness to acquire it. The two are presumably the outcome of the same sets of factors (favorable endowments and interest) (young people exchange SMSs more frequently). It is, however, justified to presume that there is a causal connection between other info-communicational knowledge and the readiness to learn the computer, since here the skill correlates with an intention - even though the underlying causes may also be identical.
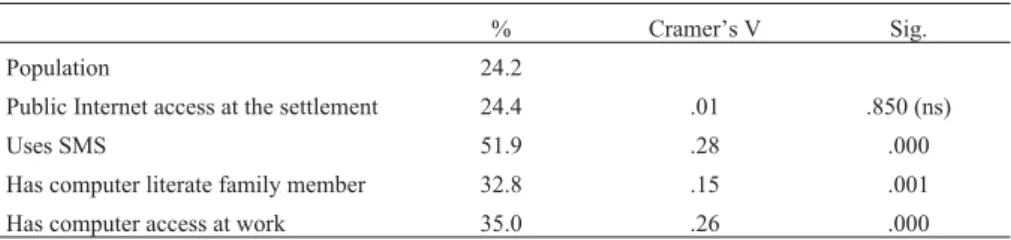
Table 7.Would you take part in a computer course?
(Correlation of the variable with the bridge factors)
% Cramer’s V Sig.
Population 24.2
Public Internet access at the settlement 24.4 .01 .850 (ns)
Uses SMS 51.9 .28 .000
Has computer literate family member 32.8 .15 .001
Has computer access at work 35.0 .26 .000
N = 498
To test how much SMS use explains of the inclination to learn the computer and how much can be attributed to the common causes both (age, qualifications, labor market position), multivariate (logistic regression) models were used. First the impact of using a mobile phone (SMS) was tested alone; then the above factors were also included.
When only the use of SMS and the intention to learn the computer was taken into account, the results we received were similar to the cross-tabulation. When, however, the variables of the digital divide were also incorporated in the model, it turned out that the effect of SMS use to reinforce the intention to learn exclusively derived from the effect of these variables, because its individual impact vanished. All this suggests that in the two-variable analysis the impact of the SMS only came from its correlation with the rest of the explanatory variables. It is therefore not a factor that may exert a positive influence on the readiness to learn independently of the digital divide, thus it does not have the bridging role we hypothesized at the beginning. In other words, its bridging function is tantamount to the mediation of the effects of the demographic-social factors.
When the variables of the digital divide are included in the model added to SMS one by one, it turns out that the indirect effect of age is accountable for the correlation.
Young people namely exchange SMSs far more frequently (and they are also more ready to learn). The elderly, who are reluctant to learn, rarely use SMS even if they have mobile phones. This applies to the whole of the sample and also to the sub-sample of those who cannot use the computer.
There is considerable difference in the rate of SMS users between the ones having computer knowledge and the digitally illiterate, which derive from the fact that SMS use strongly correlates with computer literacy.
Interestingly enough, this association – unlike the association between SMS use and the intention to learn – is independent of the social-demographic background variables of the digital divide. It means that SMS use is in significant and independent association with computer literacy. Since, however, no temporal causal connection can be demonstrated between computer knowledge and SMS use, it cannot be taken for a bridge.
It influences computer knowledge more powerfully than the willingness to learn it whether there is a competent computer userin the familyor not, and whether cellular phones are used. While computer knowledge is more strongly correlated with the computer literacy of other family members, the willingness to learn is more weightily influenced by other info-communicational skills of the family members. This is logically connected to the income status. While the computer is more widespread in the upper income groups, the cellular phone is frequent in lower income categories, and as has been seen, the readiness to learn the computer was highest in the lowest income quartile.
Table 8.Readiness to learn the computer, use of cellular phones (SMS) and the digital divide (multivariate analysis)
Variable B S.E. Wald df Sig Exp(B)
SCHOOL* 9.330 3 .025
SCHOOL(1) .192 .308 .387 1 .534 1.211
SCHOOL(2) .994 .392 6.418 1 .011 2.702
SCHOOL(3) 1.415 .632 5.010 1 .025 4.117
INCOME** 4.620 4 .329
INCOME(1) .738 .374 3.885 1 .049 .478
INCOME(2) .284 .375 .573 1 .449 .753
INCOME(3) .678 .478 2.010 1 .156 .508
INCOME(4) -.292 .497 .346 1 .556 .746
WORK .439 ..269 2.677 1 .102 1.552
AGE .088 .013 47.907 1 .000 .916
GENDER .005 .270 .000 1 .984 1.005
SETTLEMENT .274 .286 .923 1 .337 1.316
FAMILY -.928 .682 1.854 1 .173 .395
SMS .246 .319 .599 1 .439 1.280
Constant 2.791 .790 12.500 1 .000 16.304
Notes:
*: schooling: comparison: 8 primary grades or less. 1: skilled worker, 2: GCE; 3: higher education
**: income categories: comparison: lower quartile. 1: 2nd quartile, 2: 3rd quartile, 3: upper quartile, 4:
refused to reveal
N=552; Cox &Snell R2=0,274; Nagelkerke R2=0,410
Table 9.Use of SMS by age group Age
18–29 30–39 40–49 50–59 60– Total
Those who can not use computer
Don’t use SMS 46.3% 59.7% 85.7% 91.1% 97.2% 84.2%
Use SMS 53.7% 40.3% 14.3% 8.9% 2.8% 15.8%
N 41 67 105 112 176 501
Population
Don’t use SMS 26.3% 47.8% 70.5% 82.0% 96.4% 68.8%
Use SMS 73.7% 52.2% 29.5% 18.0% 3.6% 31.3%
N 118 138 183 167 194 800
A logistical regression model can be constructed for the examination of the computer literacy of family members similarly to SMS use. If the model is written for two variables, the outcome coincides with the outcome of the cross-tabulation: those who have no computer knowledge but have a computer-literate family member are more inclined to take part in a course. When, however, the social-demographic variables of the digital divide are involved as control variables, this correlation disappears.
Table 10.Readiness to learn the computer, computer literacy of family members and the digital divide (multivariate analysis)
Variable B S.E. Wald df Sig Exp(B)
SCHOOL* 9.968 3 .019
SCHOOL(1) .200 .310 .415 1 .519 1.221
SCHOOL(2) 1.032 .396 6.787 1 .009 2.806
SCHOOL(3) 1.463 .631 5.381 1 .020 4.320
INCOME** 4.460 4 .347
INCOME(1) -.728 .374 3.794 1 .051 .483
INCOME(2) -.253 .372 .462 1 .497 .777
INCOME(3) -.633 .472 1.801 1 .180 .531
INCOME(4) -.262 .496 .279 1 .597 .769
WORK .451 .272 2.754 1 .097 1.570
AGE .092 .012 59.414 1 .000 .912
GENDER -.022 .267 .007 1 .933 .978
SETTLEMENT .277 .286 .938 1 .333 1.319
FAMILY -.957 .693 1.909 1 .167 .384
COMP. LIT.
FAMILY MEMBER -.069 .268 .066 1 .797 .933
Constant 3.053 .725 17.759 1 .000 21.189
Notes:
*: schooling: comparison: 8 primary grades or less. 1: skilled worker, 2: GCE; 3: higher education
**: income categories: comparison: lower quartile. 1: 2ndquartile, 2: 3rdquartile, 3: upper quartile, 4: refused to reveal
N=552; Cox &Snell R2=0,273; Nagelkerke R2=0,408
It was also examined that the effect of which variable predominated the bridge in the household. The family bridge lost its significance when the variable included referred to household of one-person / larger families. It turned out that the drive to learn is influenced (negatively) by living alone. As compared to that, no positive effect of a competent family member can be demonstrated on the readiness to learn. The correlation also ceases when age is included because obviously a higher rate of the elderly live alone. When age and living alone are examined in the same model, it turns out that age is the more powerful factor and its inclusion eliminates the effect of being alone.
As can be seen, thepublic access to the Internetat the settlement does not influence the intention to learn the computer. That applies even if schools are not taken for public Internet access points. A technical explanation may be that we failed to clearly define by measurements which places were public accesses to the Internet. Another explanation may be that since the public Internet access is not run with a communal function, it does not generate demand. Only those know about it and attend it who know the computer anyway: who has or had Internet9at home or still have access to it at work.
“I used to attend the library. Now that the telehouse is open I usually come here. And it’s a question of time too, now my work does not let me regularly travel to Kaposvár.”(R.Sz., Cserénfa)
That we failed to demonstrate the impact of the telehouse on the readiness to learn may also be attributed to the fact that the (proclaimed) target groups of telehouses are often (socially handicapped) children who have no computers at home.
American experiences also mainly refer to programs for children and adolescents (Servon 2002, pp.118-125). The regulars of the Cserénfa telehouse were also children.
Not because special programs were worked out for them but because they had learnt the basics of computer use at school and they could play there. For the kids, the telehouse of Cserénfa was indeed a communal venue, as the next conversation also shows:
“A: Hi.
B: Hi there. Do you want me?
A: Is the telehouse open?
B: Yeah, tell me.
A: We are looking for Brigi. Are they here?
B: They are here, to the right. (Brigi!) Here are Viki and the rest, go ahead.
A: Okay. I just wanted to come over, but maybe I’ll check if I have a new e-mail. But I haven’t brought money with me, I didn’t mean to come here."
(Detail from an interview, Cserénfa)
The quantitative method could not measure the impact on children because only the age groups above 18 were included in the sample. The fact that the telehouse is a good communal place for the kids does not necessarily have repercussions for the attitude of
9 We have found that using the Internet is not continuous in a life course, and many people interrupt it for some time and return to it later.
adults. It may even reinforce the view that the computer is a toy for children. This may buttress the attitude we found, that in most households PCs are bought for children lest they should fall behind the rest and have arrears in their studies. The use of the telehouse by children may also scare off the older ones who are reluctant to be there where children are playing even if there is a free computer.
“I think there are 3 or 4 computers. The community, the village does not actually use them for what they should. Those who would use them because they need them cannot get at them. The generation of 6-, 8-, 9-, 10-year-olds have seized them, you can’t send them away because their mothers, fathers would take it amiss. It’s a game. Sometimes we came in and the teenage girls were using them.”(E.B. Cserénfa)
“It’s easier for me to arrange things at work. You can’t do anything here for the kids. It’s for them to be used here.”(N.N. Cserénfa)
It even applies to villages that children and adults are involved in different communal activities and what suits one does not suit the other group.
One’saccess to the computer at workstrongly influences one’s computer literacy but hardly affects the inclinations to learn it. TheTablebelow reveals that the main difference in readiness to learn is between the active and inactive populations, and not between the active people having access to computers and the active people having no access. Those who work and have access show less inclination to attend computer courses than those who work, but do not have access. There were, however, very few people who replied that they had access to computers, hence this difference is most probably accidental (statistically insignificant).
Table 11.Access at work and inclination to learn
Do you have a computer of your own at work or access to one?
Has
computer Has access
Has no computer or access
Doesn’t work, doesn’t have job
N
Would you take part in computer course for a reasonable fee, which were organized in the settlement?
yes 50.0% 35.0% 41.3% 16.6% 121
no 50.0% 65.0% 58.7% 83.4% 377
N 2 20 138 338 498
Cramer’s V=0.264 (p=0.000)
If we do not differentiate within the “no access” group between those who work and those who do not (uniting the two categories), the association will not be significant in the cross table.
Table 12.Access at work and inclination to learn, within the active population Do you have a computer of your own at work or access to one?
Has computer
or access Doesn’t have N
Would you take part in computer course for a reasonable fee, which were organized in the settlement?
yes 36.4% 41.3% 65
no 63.6% 58.7% 95
N 22 138 160
Cramer’s V=0.035 (p=0.661, n.s.)
Concerning the active population, the difference between those who have access at work and those who have not can be demonstrated even less. Accordingly, the logistic regression model also fails to reveal the significant effect of workplace access, as it is included as a control variable whether the person works or not.
Table 13.Readiness to learn the computer, workplace access and the digital divide (multivariable analysis)
Variable B S.E. Wald df Sig Exp(B)
SCHOOL* 9.308 3 .025
SCHOOL(1) .191 .308 .385 1 .535 1.210
SCHOOL(2) 1.019 .391 6.804 1 .009 2.771
SCHOOL(3) 1.372 .672 4.175 1 .041 3.945
INCOME** 4.522 4 .340
INCOME(1) .730 .373 3.819 1 .051 .482
INCOME(2) -.236 .372 .404 1 .525 .790
INCOME(3) -.643 .475 1.835 1 .176 .526
INCOME(4) -.273 .497 .301 1 .583 .761
WORK .420 .274 2.349 1 .125 1.521
AGE .092 .012 59.232 1 .000 .912
GENDER -.028 .265 .011 1 .915 .972
SETTLEMENT .260 .285 .832 1 .362 1.297
FAMILY -.925 .683 1.837 1 .175 .397
HAVE ACC. OR
COMP. AT WORK .200 .566 .125 1 .724 1.221
Constant 3.045 .723 17.721 1 .000 21.015
Notes:
*: schooling: comparison: 8 primary grades or less. 1: skilled worker, 2: GCE; 3: higher education
**: income categories: comparison: lower quartile. 1: 2nd quartile, 2: 3rd quartile, 3: upper quartile, 4:
refused to reveal
N=552; Cox &Snell R2=0.273; Nagelkerke R2=0.409
CONCLUDING REMARKS
Our research has confirmed our assumption that it is justified to speak about the digital divide in the Kaposvár sub-region. There are considerable and systematic differences in computer literacy along the correlated factors of age, activity, schooling and income. These differences, however, are less significant concerning the willingness to learn, and what is more, the readiness to learn the computer is higher in the lower-income groups than in high-income categories. This permits the presumption that if the inclination to learn is realized - under suitable institutional and technological conditions, the digital divide will decrease instead of further widening.
Searching for possible mediating mechanisms, we have examined the role of four bridges - public Internet access, access to computers at work, computer literacy in the household and use of cellular phones. Most of them have strong and significant correlations with the inclination to learn. When, however, the bridges are included individually or collectively in the model controlled by the variables of the digital divide, their effect vanishes, and prove to be effects mediated by other factors.
As compared to the factors of the digital divide, the bridges have proven weak.
Though the readiness to learn implies less inequality than actual computer knowledge, the social mechanisms that the population can mobilize and the technical tools alone are insufficient to bridge the digital divide.
REFERENCES
Burt, R.S. (1999): The Social Capital of Opinion Leaders.The Annals of the American Academy of Political and Social Science,566: 37–54.
Castells, M. (1996):The Rise of the Network Society.Malden, MA: Blackwell Publishers.
Coleman, J.S. and Katz, E. and Menzel, H. (1966):Medical Innovation: A Diffusion Study.
Bobbs Merrill.
DiMaggio, P., Hargittai, E., Neuman, W.R. and Robinson, J.P. (2001): Social Implications of the Internet.Annual Review of Sociology,27: 307–336.
Etzioni, A. and Etzioni, O. (1999): Face-to-Face and Computer-Mediated Communities. A Comparative Analysis.The Information Society,15(4): 241–248.
Goolsbee, A. and Klenow, P. J. (2002): Evidence on Learning and Network Externalities in the Diffusion of Home Computers.Journal of Law and Economics,45(2): 317–344.
Hampton, K.N. and Wellman, B. (2002): The Not So Global Village of Netville. In Haythorntwaite, C. and Wellman, B. (eds.):The Internet in Everyday Life.Malden, MA:
Blackwell Publishers, 345–371.
Hargittai, E. (1999): Weaving the Western Web: Explaining Differences in Internet Connectivity Among OECD Countries.Telecommunications Policy,23: 701–718.
Hargittai, E. (2002): Second-Level Digital Divide: Differences in People’s Online Skills.First Monday,7(4),www.firstmonday.dk
Katz, E. (1999): Theorizing Diffusion: Tarde and Sorokin Revisited. The Annals of the American Academy of Political and Social Science,566: 144–155.
Kavanaugh, A.L. and Patterson, S.J. (2002): The Impact of Community Computer Networks on Social Capital and Community Involvement in Blacksburg. In Haythorntwaite, C. and
Wellman, B. (eds.):The Internet in Everyday Life.Malden, MA: Blackwell Publishers, 325–344.
Kearns, K. P. (1992): Innovations in Local Governments: A Sociocognitive Network Approach.
Knowledge and Policy,5(2): 45–67.
Kiiski, S. and Pohjola, M. (2002): Cross-Country Diffusion of the Internet. Information Economics and Policy,14: 297–310.
Lazarsfeld, P.F. and Merton, R.K. (1964): Friendship as a Social Process: A Substantive and Methodological Analysis. In Berger, M. et al. (eds.):Freedom and Control in Modern Society.New York: Octagon.
Lengyel, Gy. ed. (2002): Információs technológia és szolgáltató közigazgatás. Kutatási beszámolók és dokumentumok. [Information Technology and a Servicing Public Administration. Research Reports and Documents.] Budapest: BKÁE.
Lengyel, Gy. (2003):Digitális szakadék, életminõség, helyi társadalom. Kutatási beszámoló a BKÁE 2003. április 28-i konferenciáján.[Digital Divide, Quality of Life, Local Society.
Research Report at the BUES Conference of April 28, 2003.] Budapest: BKÁE.
Mahajan, V., Muller, E. and Bass, F. (1990): New Product Diffusion Models in Marketing: A Review and Directions for Research.Journal of Marketing,54: 1–26.
Norris, P. (2001):Digital Divide. Civic Engagement, Information Poverty, and the Internet Worldwide.Cambridge: Cambridge U.P.
NTIA–US Dept. of Commerce (2000):Falling Through the Net: Toward Digital Inclusion.
http://www.ntia.doc.gov/ntiahome/digitaldivide
OECD (2001):Understanding the Digital Divide.Paris: OECD.
Rogers, E.M. (1995):Diffusion of Innovations.[Fourth Edition], New York: Free Press.
Schön, D.A., Bish, S.-W. and Mitchell, J. eds. (1999):High Technology and Low-Income Communities. Prospects for the Positive Use of Advanced Information Technology.
Cambridge MA./London: MIT Press.
Servon, L.J. (2002): Bridging the Digital Divide. Malden, MA/Oxford/Berlin/Melbourne:
Blackwell Publishing.
SIBIS (2003):SIBIS Pocket Book 2002/03. Measuring the Information Society in the EU, the EU Accession Countries, Switzerland and the US.Bonn: SIBIS project and E. C.
Valente, T.W. (1995):Network Models of the Diffusion of Innovations.Cresskill, NJ: Hampton Pr. Inc.
Wellman, B. and Haythorntwaite, C. eds. (2002):The Internet in Everyday Life.Malden, MA:
Blackwell Publishers.