ORIGINAL INVESTIGATION
CAPTURE: a multinational, cross-sectional study of cardiovascular disease prevalence in adults with type 2 diabetes across 13 countries
Ofri Mosenzon1* , Abdullah Alguwaihes2, Jose Luis Arenas Leon3, Fahri Bayram4, Patrice Darmon5, Timothy M. E. Davis6, Guillermo Dieuzeide7, Kirsten T. Eriksen8, Tianpei Hong9, Margit S. Kaltoft8,
Csaba Lengyel10, Nicolai A. Rhee11, Giuseppina T. Russo12, Shinichiro Shirabe13, Katerina Urbancova14 and Sergio Vencio15 on behalf of the CAPTURE Study Investigators
Abstract
Background: There is a paucity of global data on cardiovascular disease (CVD) prevalence in people with type 2 diabetes (T2D). The primary objective of the CAPTURE study was to estimate the prevalence of established CVD and its management in adults with T2D across 13 countries from five continents. Additional objectives were to further characterize the study sample regarding demographics, clinical parameters and medication usage, with particular reference to blood glucose-lowering agents (GLAs: glucagon-like peptide-1 receptor agonists and sodium-glucose co-transporter-2 inhibitors) with demonstrated cardiovascular benefit in randomized intervention trials.
Methods: Data were collected from adults with T2D managed in primary or specialist care in Australia, China, Japan, Czech Republic, France, Hungary, Italy, Argentina, Brazil, Mexico, Israel, Kingdom of Saudi Arabia, and Turkey in 2019, using standardized methodology. CVD prevalence, weighted by diabetes prevalence in each country, was estimated for the overall CAPTURE sample and participating countries. Country-specific odds ratios for CVD prevalence were further adjusted for relevant demographic and clinical parameters.
Results: The overall CAPTURE sample included 9823 adults with T2D (n = 4502 from primary care; n = 5321 from specialist care). The overall CAPTURE sample had median (interquartile range) diabetes duration 10.7 years (5.6–
17.9 years) and glycated hemoglobin 7.3% (6.6–8.4%) [56 mmol/mol (49–68 mmol/mol)]. Overall weighted CVD and atherosclerotic CVD prevalence estimates were 34.8% (95% confidence interval [CI] 32.7–36.8) and 31.8% (95% CI 29.7–33.8%), respectively. Age, gender, and clinical parameters accounted for some of the between-country variation in CVD prevalence. GLAs with demonstrated cardiovascular benefit were used by 21.9% of participants, which was similar in participants with and without CVD: 21.5% and 22.2%, respectively.
© The Author(s) 2021. Open Access This article is licensed under a Creative Commons Attribution 4.0 International License, which permits use, sharing, adaptation, distribution and reproduction in any medium or format, as long as you give appropriate credit to the original author(s) and the source, provide a link to the Creative Commons licence, and indicate if changes were made. The images or other third party material in this article are included in the article’s Creative Commons licence, unless indicated otherwise in a credit line to the material. If material is not included in the article’s Creative Commons licence and your intended use is not permitted by statutory regulation or exceeds the permitted use, you will need to obtain permission directly from the copyright holder. To view a copy of this licence, visit http:// creat iveco mmons. org/ licen ses/ by/4. 0/. The Creative Commons Public Domain Dedication waiver (http:// creat iveco mmons. org/ publi cdoma in/ zero/1. 0/) applies to the data made available in this article, unless otherwise stated in a credit line to the data.
Open Access
*Correspondence: ofrim@hadassah.org.il
1 Diabetes Unit, Department of Endocrinology and Metabolism, Hadassah Medical Center, Faculty of Medicine, Hebrew University of Jerusalem, Hadassah Hebrew University Hospital, PO Box 12000, 91120 Jerusalem, Israel
Full list of author information is available at the end of the article
Introduction
Cardiovascular disease (CVD) remains the largest cause of diabetes-related morbidity and mortality [1, 2]. Sys- tematic reviews indicate there is an approximately two- fold higher risk of CVD in people with versus without diabetes after adjustment for conventional risk factors [3, 4]. Given the large clinical burden associated with CVD complicating type 2 diabetes (T2D), international dia- betes and cardiology position statements and guidelines have been updated to encompass the combined manage- ment of T2D and CVD [5–7]. These updates have been informed by cardiovascular (CV) outcome trials dem- onstrating superiority in CV outcomes for some blood glucose-lowering agents (GLAs) versus placebo in people with T2D and established CVD or at high CVD risk [6, 8]. The glucagon-like peptide-1 receptor agonists (GLP-1 RAs) and sodium-glucose co-transporter-2 inhibitors (SGLT2is) with demonstrated CV benefit are now rec- ommended as first [5] or second-line [6, 7] GLAs in this context.
The impact of the updated guidelines on real-world clinical practice should be of interest to clinicians and policy makers, and its evaluation requires robust con- temporary estimates of CVD prevalence and manage- ment in people with T2D that can be monitored over time. However, the current understanding of the global prevalence of, and between-country variation in, diabe- tes-related complications, including CVD, is limited [9].
Available CVD prevalence data in people with T2D are mostly from regional or national studies conducted in the US [10] and some European countries [11–15]. Direct comparisons between countries are complicated by dif- ferences in study methodology, including the population sampled and definition of CVD. Estimates of the CVD burden in some countries have been based on studies that sampled selected patient populations (such as from spe- cialist care) or that utilized model-based estimates rather than real-world data [16]. A review paper estimated CVD to affect 32.2% of individuals with T2D worldwide, based on a systematic review of scientific literature published between 2007 and 2017 [16] that would not reflect recent changes in epidemiology and management of T2D and is now considered outdated.
The primary objective of the present study was to esti- mate the contemporary prevalence of established CVD in adults with T2D across a range of countries and several continents using standardized methodology. Secondary objectives were to estimate the prevalence of high CVD risk in adults with T2D without established CVD (full results to be published elsewhere) and to further charac- terize the study sample regarding demographics, clinical parameters, CV medication and GLA usage, with par- ticular reference to GLAs (GLP-1 RAs and SGLT2is) with demonstrated CV benefit.
Methods Study design
CAPTURE was a non-interventional, cross-sec- tional study conducted at 214 centers across 13 coun- tries (NCT03786406 [Europe] and NCT03811288 [non-Europe]). The countries were from Australasia (Australia), East Asia (China and Japan), Europe (Czech Republic, France, Hungary, and Italy), Latin America (Argentina, Brazil, and Mexico), and the Middle East (Israel, Kingdom of Saudi Arabia and Turkey). The study protocols were approved by the appropriate independ- ent ethics committees and relevant institutional review boards. The study was conducted in accordance with the Declaration of Helsinki [17], International Society for Pharmacoepidemiology Good Pharmacoepidemiology Practices [18], and local regulations. All participants pro- vided written informed consent prior to participation.
Local medical affairs personnel from participating countries, who were employed by the sponsor, provided information on the management of people with T2D, including types of physicians managing T2D in routine clinical practice (primary care practitioners, diabetolo- gists, endocrinologists, cardiologists, and other special- ists) and types of practices (primary care and specialist settings, including different types of hospitals) to a con- tract research organization for consideration of site selec- tion. Final participating sites were chosen by the contract research organization and approved by the sponsor on the basis that they were as representative as possible for each country. Factors considered were geographi- cal spread and the division of patients being treated at Conclusions: In 2019, approximately one in three adults with T2D in CAPTURE had diagnosed CVD. The low use of GLAs with demonstrated cardiovascular benefit even in participants with established CVD suggested that most were not managed according to contemporary diabetes and cardiology guidelines.
Study registration NCT03786406 (registered on December 20, 2018), NCT03811288 (registered on January 18, 2019).
Keywords: Non-interventional study, Type 2 diabetes, Cardiovascular disease, Atherosclerotic cardiovascular disease, Prevalence, Glucagon-like peptide-1 receptor agonists, Sodium-glucose co-transporter-2 inhibitors
private and public centers, as well as the degree of spe- cialization at each site. The ratio of participants from pri- mary to specialist care sites in each country was chosen to approximate the assumed distribution of adults with T2D managed in these settings according to available local data. No primary care sites were included in China, Hungary, or Italy as people with T2D in these coun- tries are primarily, although not exclusively, managed in specialist care. In Italy, local health system organiza- tion rules mean that new prescriptions for GLAs can- not be provided in primary care. In China, patients with T2D consult hospital doctors as their primary contact.
In Hungary, patients with T2D are mainly managed in a specialist care setting with limited influence from pri- mary care on decisions regarding GLAs with CV benefit.
At each participating site, consecutive, eligible adults aged ≥ 18 years (≥ 20 years in Japan) at the time of informed consent who had been diagnosed with T2D ≥ 180 days prior to providing informed consent and who were attending the site as part of their routine visit to their treating physician were invited to participate by the treating physician during a 90-day time window.
Exclusion criteria were a diagnosis of type 1 diabetes, known congenital heart disease or malformation, pre- vious participation in this study (provided informed consent for inclusion at a prior visit during the data col- lection period), and mental incapacity or language bar- riers that precluded an adequate understanding of, or cooperation with, study requirements.
The invitation to participate, provision of informed consent, and data collection took place during a single, routine health visit at each site. In all countries, the treat- ing physician or a trained delegate collected data using a standardized electronic case report form, and data were transferred to a central database via a web-based data capture system. Relevant data were collected from par- ticipants’ medical records. The physician verbally asked participants for any information that was missing from the medical record. The study protocols did not mandate screening for, or adjudication of, the presence of compli- cations .
Definitions of variables studied
Established CVD was defined as a diagnosis of any of the following conditions in participants’ medical records:
cerebrovascular disease, coronary heart disease (CHD), heart failure, cardiac arrhythmia or conduction abnor- malities, aortic disease, peripheral artery disease (PAD), or carotid artery disease (see Additional file 1: Table S1 for the full list and definitions). Similarly, CVD was cat- egorized as atherosclerotic CVD (ASCVD) when there was a diagnosis of any of the following CV conditions:
cerebrovascular disease, CHD, PAD, or carotid artery
disease [7]. For analysis purposes, participants were stratified into two groups based on the presence (CVD group) or absence (non-CVD group) of established CVD.
Available demographic, anthropometric, and clinical parameters were collected, in addition to selected medi- cal history, GLAs, and CV medications (listed in Addi- tional file 1: Methods S1). Only current medications or those discontinued within the previous 3 months were recorded. During analysis, GLAs were further grouped according to demonstrated CV benefit status in line with the 2020 American Diabetes Association guidelines [19]
(and by March 2020, all had a CV indication in their US Food and Drug Administration label [20–25]). GLAs with demonstrated CV benefit included three GLP-1 RAs (dulaglutide, liraglutide, and semaglutide) and three SGLT2is (canagliflozin, dapagliflozin, and empagliflozin).
Statistical analysis Pre‑specified analyses
The prevalence (95% confidence interval [CI]) of CVD, ASCVD, CVD subtypes, and diagnoses were estimated for all countries together (overall) and for each coun- try individually. Overall prevalence estimates were cal- culated as weighted estimates to account for the size of the diabetes population in each country [26], as this was not accounted for in the sampling. Both the overall and country-level prevalence estimates were calculated as weighted estimates to account for any differences between the actual and planned sampling distribution of participants by healthcare setting (primary care:specialist care).
The study sample was characterized by demographics, clinical parameters, CV medication, and GLA usage, with particular reference to GLAs with demonstrated CV ben- efit, presented for the overall study sample and separately for the CVD group and non-CVD group; data were not weighted.
Post hoc analyses
The number of affected vascular areas among those with CVD was calculated and stratified by gender. Three vas- cular areas were analyzed, defined as coronary, cerebro- vascular and peripheral.
To explore whether differences in estimated CVD prevalence between countries could be partially or fully explained by differences in demographic and clinical characteristics between the country samples, logistic regression models were used to calculate prevalence odds ratios (PORs) for CVD in each country using the overall CAPTURE study sample as the reference.
The models were as follows: (1) crude; (2) adjusted for
age and gender; and (3) additionally adjusted for sta- tistically significant clinical parameters identified via backwards selection (age, gender, diabetes duration, body mass index [BMI], glycated hemoglobin [HbA1c], low-density lipoprotein cholesterol, high-density lipo- protein cholesterol, smoking status, hypertension, nephropathy, neuropathy, and retinopathy). Param- eters with a high proportion of missing data (albumi- nuria, estimated glomerular filtration rate [eGFR] and physical activity) were not considered (Additional file 1:
Table S2). Any missing data for the included param- eters were imputed for each country separately using fully conditional specification. Sensitivity analyses were conducted (1) without imputation of missing data for participants with complete covariate information and (2) including eGFR as a clinical parameter (both with and without imputation of missing data). Further details on the logistic regression analyses are available in Additional file 1: Methods S2.
Due to the large T2D population compared to the other study countries, China would have a large influ- ence on the overall weighted CVD prevalence esti- mates. As such, a sensitivity analysis was conducted where the prevalence calculations were repeated for all countries excluding China. These estimates were also calculated as weighted estimates to account for the size of the diabetes population of the 12 remaining coun- tries [26].
In order to place the CAPTURE data in the context of two recent CV outcome trials, exploratory analyses assessed the number of participants with high CVD risk in the non-CVD group who were using a GLA with demonstrated CV benefit. Participants with high CVD risk were identified in the non-CVD group as satisfying relevant criteria from the REWIND [27] or DECLARE- TIMI 58 [28] trials based on available CAPTURE data.
To align as closely as possible with REWIND criteria, participants in the non-CVD group were categorized as being at high CVD risk if they were ≥ 60 years of age; were a current (any self-reported current tobacco use) or previous smoker (any self-reported his- torical tobacco use); and were on anti-hypertensive medication or had elevated systolic blood pressure (≥ 140 mmHg) or had elevated diastolic blood pressure (≥ 95 mmHg) [27]. To align as closely as possible with DECLARE-TIMI 58 criteria, participants in the non- CVD group were categorized as being at high CVD risk if they were ≥ 55 years of age if male or ≥ 60 years of age if female; and were either on anti-hypertensive medication or had both elevated systolic blood pressure (> 140 mmHg) and elevated diastolic blood pressure (> 90 mmHg) [28].
All statistical analyses were carried out using SAS, Version 9.4 (SAS Institute, Cary, NC, USA).
Results Study sample
The overall study sample included 9823 adults with T2D (n = 4502 from primary care; n = 5321 from specialist care) (Additional file 1: Fig. S1 for study flow) who par- ticipated between December 01, 2018 and September 30, 2019. The median (interquartile range [IQR]) number of participants per site was 40 (25–57). The number and geo- graphical distribution of study participants are presented in Additional file 1: Fig. S2. The median (IQR) age of the overall study sample was 64.0 years (56.0–71.0 years) and 45.5% of participants were female (Table 1; additional data in Additional file 1: Table S3). Most (80.4%) participants had a BMI ≥ 25 kg/m2, and 70.1% had diagnosed hyper- tension. The median (IQR) HbA1c was 7.30% (6.60–8.40%) [56 mmol/mol (49–68 mmol/mol)] and diabetes duration was 10.7 years (5.6–17.9 years).
CVD prevalence
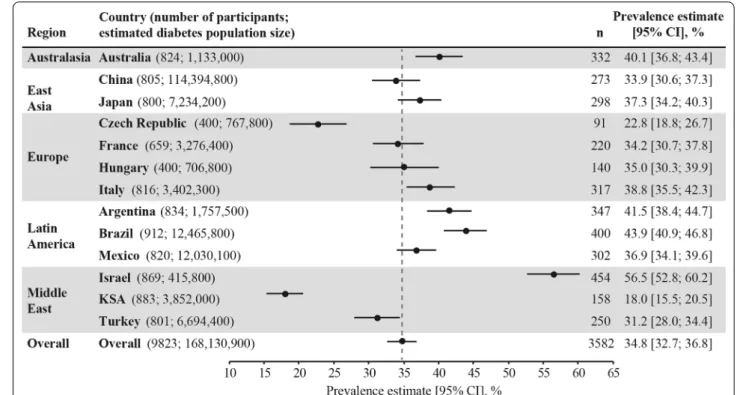
Among the 9823 study participants, over one third (n = 3582; 36.5%) had established CVD, with a weighted CVD prevalence estimated at 34.8% (95% CI 32.7–36.8%) across the 13 countries. CVD prevalence was lowest in the Kingdom of Saudi Arabia (18.0%) and highest in Israel (56.5%) (Fig. 1). Most (85.8%; n = 3074) cases of CVD were atherosclerotic, with the weighted ASCVD preva- lence estimated at 31.8% (95% CI 29.7–33.8%) across the 13 countries. The weighted prevalence of CVD subtypes and diagnoses are presented in Fig. 2 and Additional file 1:
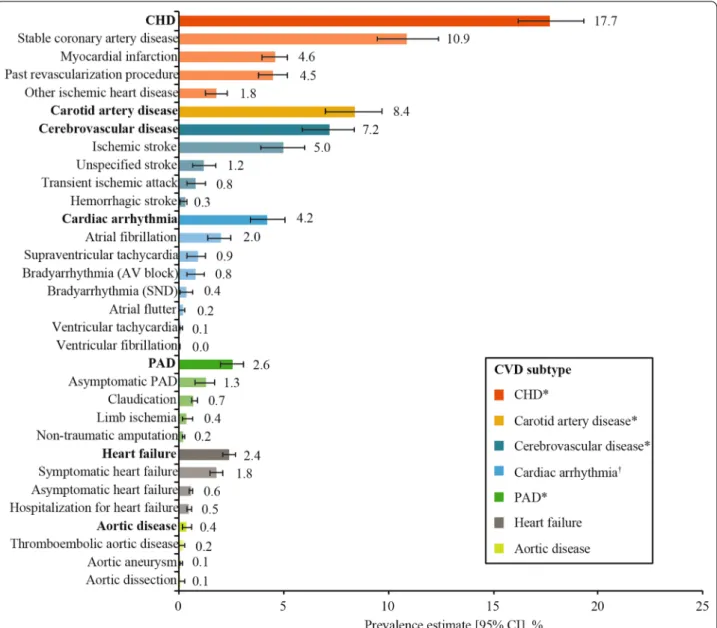
Table S4. The most prevalent weighted CVD subtypes were CHD (17.7%), carotid artery disease (8.4%), and cer- ebrovascular disease (7.2%). The overall weighted preva- lence of heart failure was 2.4% (95% CI 2.1–2.7%), with a wide range from 0.2% in China to 14.5% in Israel (Addi- tional file 1: Fig. S3). Overall, the weighted prevalence of CVD was similar in participants from primary versus spe- cialist care (35.6% vs 34.6%) (not statistically analyzed).
In post hoc analyses that excluded China from the overall prevalence estimates, the weighted CVD preva- lence was 36.6% (95% CI 35.4–37.7%) and heart failure prevalence was 6.9% (95% CI 6.3–7.6%) across the 12 remaining countries.
Characteristics of the study sample by CVD status
In comparison with the non-CVD group, the CVD group was older (median age 68.0 years vs 62.0 years), had a higher proportion of males (61.3% vs 50.7%), and a longer duration of diabetes (median duration 13.0 years
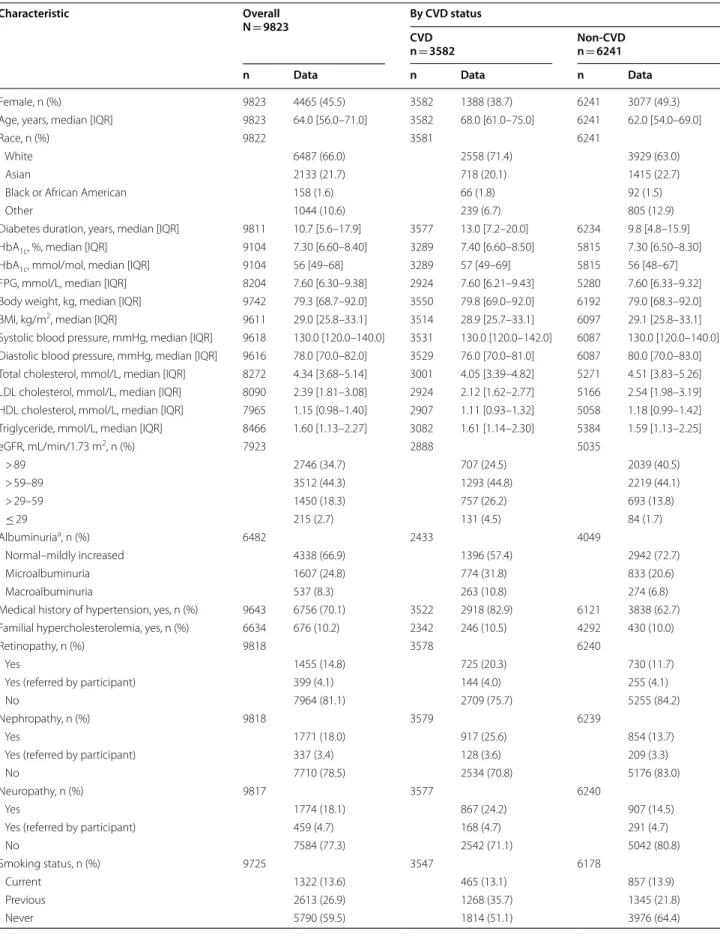
Table 1 Demographic and clinical characteristics of the CAPTURE study sample overall and stratified by CVD status
Characteristic Overall
N = 9823 By CVD status
CVDn = 3582 Non-CVD
n = 6241
n Data n Data n Data
Female, n (%) 9823 4465 (45.5) 3582 1388 (38.7) 6241 3077 (49.3)
Age, years, median [IQR] 9823 64.0 [56.0–71.0] 3582 68.0 [61.0–75.0] 6241 62.0 [54.0–69.0]
Race, n (%) 9822 3581 6241
White 6487 (66.0) 2558 (71.4) 3929 (63.0)
Asian 2133 (21.7) 718 (20.1) 1415 (22.7)
Black or African American 158 (1.6) 66 (1.8) 92 (1.5)
Other 1044 (10.6) 239 (6.7) 805 (12.9)
Diabetes duration, years, median [IQR] 9811 10.7 [5.6–17.9] 3577 13.0 [7.2–20.0] 6234 9.8 [4.8–15.9]
HbA1c, %, median [IQR] 9104 7.30 [6.60–8.40] 3289 7.40 [6.60–8.50] 5815 7.30 [6.50–8.30]
HbA1c, mmol/mol, median [IQR] 9104 56 [49–68] 3289 57 [49–69] 5815 56 [48–67]
FPG, mmol/L, median [IQR] 8204 7.60 [6.30–9.38] 2924 7.60 [6.21–9.43] 5280 7.60 [6.33–9.32]
Body weight, kg, median [IQR] 9742 79.3 [68.7–92.0] 3550 79.8 [69.0–92.0] 6192 79.0 [68.3–92.0]
BMI, kg/m2, median [IQR] 9611 29.0 [25.8–33.1] 3514 28.9 [25.7–33.1] 6097 29.1 [25.8–33.1]
Systolic blood pressure, mmHg, median [IQR] 9618 130.0 [120.0–140.0] 3531 130.0 [120.0–142.0] 6087 130.0 [120.0–140.0]
Diastolic blood pressure, mmHg, median [IQR] 9616 78.0 [70.0–82.0] 3529 76.0 [70.0–81.0] 6087 80.0 [70.0–83.0]
Total cholesterol, mmol/L, median [IQR] 8272 4.34 [3.68–5.14] 3001 4.05 [3.39–4.82] 5271 4.51 [3.83–5.26]
LDL cholesterol, mmol/L, median [IQR] 8090 2.39 [1.81–3.08] 2924 2.12 [1.62–2.77] 5166 2.54 [1.98–3.19]
HDL cholesterol, mmol/L, median [IQR] 7965 1.15 [0.98–1.40] 2907 1.11 [0.93–1.32] 5058 1.18 [0.99–1.42]
Triglyceride, mmol/L, median [IQR] 8466 1.60 [1.13–2.27] 3082 1.61 [1.14–2.30] 5384 1.59 [1.13–2.25]
eGFR, mL/min/1.73 m2, n (%) 7923 2888 5035
> 89 2746 (34.7) 707 (24.5) 2039 (40.5)
> 59–89 3512 (44.3) 1293 (44.8) 2219 (44.1)
> 29–59 1450 (18.3) 757 (26.2) 693 (13.8)
≤ 29 215 (2.7) 131 (4.5) 84 (1.7)
Albuminuriaa, n (%) 6482 2433 4049
Normal–mildly increased 4338 (66.9) 1396 (57.4) 2942 (72.7)
Microalbuminuria 1607 (24.8) 774 (31.8) 833 (20.6)
Macroalbuminuria 537 (8.3) 263 (10.8) 274 (6.8)
Medical history of hypertension, yes, n (%) 9643 6756 (70.1) 3522 2918 (82.9) 6121 3838 (62.7)
Familial hypercholesterolemia, yes, n (%) 6634 676 (10.2) 2342 246 (10.5) 4292 430 (10.0)
Retinopathy, n (%) 9818 3578 6240
Yes 1455 (14.8) 725 (20.3) 730 (11.7)
Yes (referred by participant) 399 (4.1) 144 (4.0) 255 (4.1)
No 7964 (81.1) 2709 (75.7) 5255 (84.2)
Nephropathy, n (%) 9818 3579 6239
Yes 1771 (18.0) 917 (25.6) 854 (13.7)
Yes (referred by participant) 337 (3.4) 128 (3.6) 209 (3.3)
No 7710 (78.5) 2534 (70.8) 5176 (83.0)
Neuropathy, n (%) 9817 3577 6240
Yes 1774 (18.1) 867 (24.2) 907 (14.5)
Yes (referred by participant) 459 (4.7) 168 (4.7) 291 (4.7)
No 7584 (77.3) 2542 (71.1) 5042 (80.8)
Smoking status, n (%) 9725 3547 6178
Current 1322 (13.6) 465 (13.1) 857 (13.9)
Previous 2613 (26.9) 1268 (35.7) 1345 (21.8)
Never 5790 (59.5) 1814 (51.1) 3976 (64.4)
Table 1 (continued)
Characteristic Overall
N = 9823 By CVD status
CVDn = 3582 Non-CVD
n = 6241
n Data n Data n Data
Duration of smokingb, years, median [IQR] 3733 28.0 [15.0–39.0] 1646 30.0 [20.0–40.0] 2087 25.0 [15.0–35.0]
Physical activityc, days per week, n (%) 7492 2763 4729
0–1 3599 (48.0) 1515 (54.8) 2084 (44.1)
2–3 1613 (21.5) 497 (18.0) 1116 (23.6)
4–5 883 (11.8) 264 (9.6) 619 (13.1)
6–7 1397 (18.6) 487 (17.6) 910 (19.2)
To convert the values for glucose to mg/dL, divide by 0.0555. To convert the values for cholesterol to mg/dL, divide by 0.0259. To convert the values for triglycerides to mg/dL, divide by 0.0113. Data that were missing from the medical record but verbally confirmed by a participant were coded as ‘referred by participant’. Data were not weighted
a Defined as: normal–mildly increased, urinary excretion < 30 mg/24 h or UACR < 30 mg/g; microalbuminuria, urinary excretion 30–299 mg/24 h or UACR 30–299 mg/g;
macroalbuminuria, urinary excretion ≥ 300 mg/24 h or UACR ≥ 300 mg/g
b Only applies to participants categorized as current or previous smokers
c Days with ≥ 30 min of moderate activity
BMI body mass index, CVD cardiovascular disease, eGFR estimated glomerular filtration rate, FPG fasting plasma glucose, HbA1c glycated hemoglobin, HDL high- density lipoprotein, IQR interquartile range, LDL low-density lipoprotein, UACR urinary albumin to creatinine ratio
Fig. 1 Weighted CVD prevalence in people with type 2 diabetes across the 13 countries. Data presented overall and by country. Overall prevalence estimate (across the 13 countries) calculated as a weighted estimate to account for the size of the diabetes population of each country [26] and represented by the grey dotted line. Both the overall and country-level prevalence estimates were weighted by the sampling of participants by healthcare setting, if it was different from as planned. n numbers are the crude number of participants with CVD (i.e. they were not weighted). CI confidence interval, CVD cardiovascular disease, KSA Kingdom of Saudi Arabia, n number of participants with CVD
vs 9.8 years) (Table 1; not statistically analyzed). In com- parison with the non-CVD group, a higher proportion of participants in the CVD group had diagnosed hyper- tension (82.9% vs 62.7%), renal dysfunction (microal- buminuria, 31.8% vs 20.6%; macroalbuminuria, 10.8%
vs 6.8%; eGFR ≤ 59 mL/min/1.73 m2, 30.7% vs 15.4%), were current or previous smokers (48.9% vs 35.6%), and reported low physical activity (0–1 day of physical activ- ity per week, 54.8% vs 44.1%) (Table 1; additional data in
Additional file 1: Table S3). In contrast, median serum low-density lipoprotein cholesterol concentrations were lower in the CVD group versus the non-CVD group (2.12 mmol/L vs 2.54 mmol/L). The proportion of par- ticipants with microvascular complications was higher in the CVD group compared with the non-CVD group (retinopathy: 24.3% vs 15.8%; nephropathy: 29.2% vs 17.0%; neuropathy: 29.0% vs 19.2%).
Fig. 2 Overall weighted CVD prevalence in people with type 2 diabetes by CVD subtype and diagnosis. Data are overall prevalence estimates (95% CI), which were calculated as weighted estimates to account for the size of the diabetes population of each country [26] and the sampling of participants by healthcare setting, if it was different from as planned. Along the y-axis, CVD subtypes are in bold font, while the diagnoses contributing to each subtype are in plain font. Diagnoses are not mutually exclusive; one participant may have multiple diagnoses. *Categorized as ASCVD. †Included conduction abnormalities. ASCVD atherosclerotic CVD, AV atrioventricular, CHD coronary heart disease, CI confidence interval, CVD cardiovascular disease, PAD peripheral artery disease, SND sinus node dysfunction
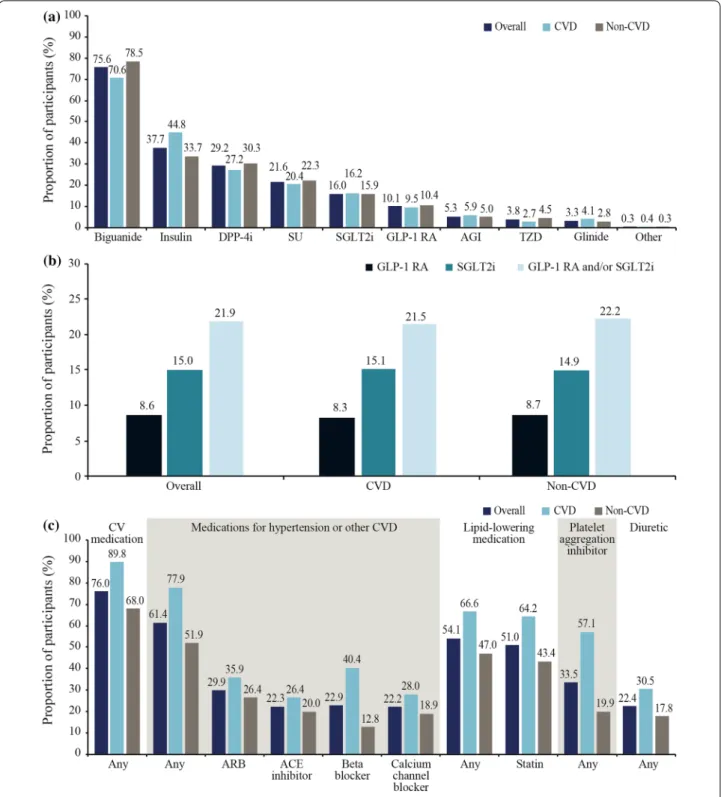
Fig. 3 Use of a GLAs, b GLAs with demonstrated CV benefit and c selected CV medications. Data are % and were not weighted. Data are presented for the CAPTURE study sample overall and stratified by CVD status. In b, GLAs with demonstrated CV benefit were defined per 2020 American Diabetes Association guidelines [19] as GLP-1 RAs: dulaglutide, liraglutide, and semaglutide; and SGLT2is: canagliflozin, dapagliflozin, and empagliflozin. ACE angiotensin-converting enzyme, AGI alpha glucosidase inhibitor, ARB angiotensin II receptor blocker, CV cardiovascular, CVD cardiovascular disease, DPP-4i dipeptidyl peptidase-4 inhibitor, GLA blood glucose-lowering agent, GLP-1 RA glucagon-like peptide-1 receptor agonist, SGLT2i sodium-glucose co-transporter-2 inhibitor, SU sulfonylurea, TZD thiazolidinedione
GLAs by CVD status
In total, 96.6% of the overall study sample were receiv- ing at least one GLA from any class. Biguanides were less frequently prescribed in the CVD group than the non-CVD group (70.6% vs 78.5%), whereas insulin use was more common in the CVD group than in the non- CVD group (44.8% vs 33.7%) (Fig. 3a). In total, 21.9% of participants were prescribed a GLA with demonstrated CV benefit, and this was similar in the CVD and non- CVD groups (21.5% vs 22.2%) (Fig. 3b). SGLT2is were more frequently used than GLP-1 RAs (15.0% vs 8.6%) in the overall study sample, with a similar use of both therapeutic classes across the CVD and non-CVD groups.
In exploratory analyses, 2051 and 2498 participants from the non-CVD group were classified as having high CVD risk using some of the REWIND and DECLARE- TIMI 58 criteria, respectively. In total, 22.2% (n = 456) of participants with high CVD risk according to REWIND criteria and 21.6% (n = 540) of participants with high CVD risk according to DECLARE-TIMI 58 criteria were using a GLA with demonstrated CV benefit.
CV medications by CVD status
Overall, 7461 participants (76.0%) were receiving any CV medication and it was more common in the CVD group than in the non-CVD group (89.8% vs 68.0%), with the same pattern across CV medication classes (Fig. 3c; not statistically analyzed). In the CVD group, statins were the most frequently utilized CV medications (64.2%), followed by beta-blockers (40.4%), acetylsalicylic acid (39.0%), angiotensin II receptor blockers (ARBs; 35.9%), calcium channel blockers (28.0%), and angiotensin- converting enzyme (ACE) inhibitors (26.4%). In the non-CVD group, statin use also predominated (43.4%), followed by ARBs (26.4%), ACE inhibitors (20.0%), acetylsalicylic acid (19.1%), calcium channel block- ers (18.9%), and beta-blockers (12.8%). Among partici- pants at high CVD risk in the non-CVD group, statins were most frequently used (43.4%), followed by ARBs (30.3%), calcium channel blockers (24.3%), ACE inhibi- tors (23.6%), acetylsalicylic acid (23.3%), and beta-block- ers (14.0%).
Vascular areas affected according to gender
When analyzing the number of affected vascular areas in participants with CVD, data were available for 1134 women and 1940 men. The proportion of participants with one vascular area affected was similar among men and women, although men were more likely to have more vascular areas involved than women (Additional file 1:
Fig. S4).
PORs for CVD adjusted for age, gender, and clinical parameters
Differences in age and gender explained some of the vari- ation in CVD prevalence between countries, as PORs in model 1 (age- and gender-adjusted) were closer to 1.00 for some countries (Argentina, Australia, China, Israel, Kingdom of Saudi Arabia, and Turkey) than in the unad- justed model (Additional file 1: Fig. S5). Adjustment for additional clinical parameters (model 2) appeared to explain further variation in CVD prevalence between countries observed in the unadjusted model, with PORs closer to 1.00 for all countries except China, France, and Mexico. However, there were still significant differences in CVD prevalence for some countries in comparison with the overall study sample after further adjustment, specifically lower odds of CVD for Kingdom of Saudi Arabia, Czech Republic, and France, in addition to higher odds of CVD for Israel, Brazil, and China (p < 0.05 for all comparisons; Additional file 1: Fig. S5). Findings from these adjusted analyses were consistent with sensitivity analyses without imputation of missing data (Additional file 1: Fig. S6) and including eGFR (both with and without imputation of missing data) (Additional file 1: Fig. S7).
Discussion
The overall weighted prevalence of CVD ascertained using standardized methodology in the present multi- national study of adults with T2D from primary or spe- cialist care settings was estimated at 34.8%. ASCVD accounted for most (85.8%) of this disease burden, with stable coronary artery disease, carotid artery disease, and stroke the major components.
The 2019 CAPTURE findings are in accordance with those reported by Einarson and colleagues [16] in their systematic literature review of 57 studies from 25 coun- tries involving over 4.5 million adults with T2D con- ducted between 1987 and 2015, which estimated a CVD prevalence of 32.2% [16]. Our weighted prevalence esti- mate for ASCVD was also similar to that in the system- atic review (31.8% vs 29.1%, respectively) [16]. Other available comparative data are from individual countries not included in CAPTURE. Nevertheless, our CVD prev- alence estimate aligns with CVD data linked to hospital admissions for nearly 250,000 Scottish patients with T2D (32.5%) [14]. However, it is higher than that reported in a primary care survey of over 17,000 Danish patients with T2D (21.4%) [11], and our weighted ASCVD prevalence estimate is lower than the 45.2% reported in a cross-sec- tional study of over 1.2 million adults with T2D from a US claims database in 2015 [10]. In addition to potential geographical differences, direct comparisons between
studies are complicated by heterogeneity in factors such as participant selection, study design, timing, and meth- ods of CVD ascertainment. Nevertheless, the CAPTURE data, collected using standardized methodology across 13 countries, make progress in addressing the need for more uniform epidemiological data relating to the global CVD burden [29].
In the present study, post hoc analyses were carried out to identify explanations for the between-country vari- ation in CVD estimates. Differences in age and gender accounted for some of the observed variation between countries, while adjustment for additional clinical param- eters further attenuated individual country differences from the pooled estimate. However, even after additional adjustment for potentially confounding parameters, there were significantly lower odds of CVD in the Kingdom of Saudi Arabia, Czech Republic, and France, contrast- ing with significantly higher odds in Israel, Brazil, and China, as compared with the overall CAPTURE study sample. These between-country differences might reflect variation in the sites selected, genetic and/or lifestyle factors, healthcare accessibility and delivery, CV medi- cation use, medical record characteristics, CVD screen- ing practices, and even competing risk of death from non-diabetes-related causes [30, 31], factors that were not directly addressed in CAPTURE. Our country-level CVD prevalence estimates are similar to those reported by Einarson and colleagues [16] in their systematic litera- ture review, wherein the prevalence in China was 33.9%
in CAPTURE vs 28.4% in the systematic literature review.
However, there was variation among the CVD estimates for the other countries in CAPTURE with outlying odds when compared with available data (Saudi Arabia: 18.0%
vs 30.0%; France: 34.2% vs 53.9%; Brazil: 43.9% vs 27.5%, all for CAPTURE vs the systematic literature review [16], respectively). A detailed exploration of outliers was beyond the scope of the present study. With a large diabe- tes population, China accounted for most of the weight- ing and may have substantially influenced the results.
However, post hoc analyses excluding China found that the overall weighted CVD prevalence was only margin- ally higher (1.8 percentage points) for the remaining 12 countries, despite a more pronounced influence of China on the weighted heart failure prevalence, which was 4.2 percentage points higher for the remaining 12 coun- tries. This large variation in heart failure prevalence may be attributed to underreporting and missed diagnoses, which may vary considerably between countries, depend- ing on their screening and diagnostic capabilities [32].
Motivated by evidence that ASCVD is largely prevent- able, many countries are starting to implement policies and practices that aim to decrease this burden in people at high risk, including those with T2D [29, 33]. Effective
action to reduce the global burden of CVD in people with T2D requires reliable data on prevalence, risk fac- tors, medication use, and the barriers to prevention and treatment [34]. Our findings indicate that fewer than one in four adults with T2D and established CVD use a GLA with demonstrated CV benefit. In 2015, when rela- tively few relevant CV outcome trial data were available, an understandably lower use of GLP-1 RAs (7.9%) and SGLT2is (8.8%) was reported in over 500,000 US adults with T2D and established ASCVD [10].
Additionally, our findings indicate that a relatively low proportion of adults with T2D without established CVD but at high CVD risk in CAPTURE – approximately 20%
– used a GLA with demonstrated CV benefit. This has potential clinical implications as REWIND found a non- significant trend to fewer major adverse CV events with dulaglutide versus placebo in patients with CV risk fac- tors but without CVD (hazard ratio [HR] 0.87, 95% CI 0.74–1.02) [27], and DECLARE-TIMI 58 reported a non- significant trend towards a lower rate of a composite of CV death or hospitalization for heart failure with dapa- gliflozin versus placebo in the same subgroup (HR 0.84, 95% CI 0.67–1.04) [28].
The proportions of patients using GLAs with demon- strated CV benefit may change with the implementation and influence of recent updates to diabetes/cardiology guidelines that now recommend a GLP-1 RA or SGLT2i with demonstrated CV benefit as first- or second-line GLA in people with T2D and established CVD or at high/very high CVD risk [5–7]. The future impact of these updates on real-world clinical practice will be of interest, and our contemporary data provide a bench- mark against which relevant trends can be monitored.
Indeed, regional differences in diabetes and cardiology treatment guidelines, as well as approvals and reimburse- ment of individual medications including GLAs, are also likely to influence the use of GLAs with CV benefit at a country level. For example, in Brazil, physicians have the ability to prescribe any class of GLA and are limited only by financial considerations. In France, SGLT2is where not approved for use at the time of the CAPTURE study, and even today, GPs have the ability to prescribe GLP-1 RAs but are only permitted to renew prescriptions of SGLT2is after they have been initiated by a specialist. In the King- dom of Saudi Arabia, the availability of GLP-1 RAs and SGLT2i GLAs is dependent on the purchasing decisions, policies and prescribing privileges in individual govern- mental hospitals.
A treatment gap exists for other evidence-based thera- pies. For example, a smaller than recommended propor- tion of participants with established CVD in CAPTURE were using statins (64.2%) or acetylsalicylic acid (39.0%) [6, 35]. In patients with known CVD, acetylsalicylic acid
reduces CV events, with the benefits outweighing the risk of major bleeding [36]. Statins have also been found to be effective in reducing CV events in patients with or without established CVD [37]. The CAPTURE data highlight the potential for improved use of non-glycemic CV pharmacotherapy for people with T2D and CV risk factors. Notably, glycemia, as assessed by HbA1c, was relatively well controlled in the overall CAPTURE study sample (median 7.3% [56 mmol/mol]). This is in align- ment with the HbA1c levels reported by similar studies that estimated CVD prevalence in patients with T2D in primary care (mean 6.9% [52 mmol/mol]) [11] and admitted to hospital (median 7.2% [55 mmol/mol]) [14], albeit in other European settings.
The CAPTURE study has several strengths. It was cross-sectional and multinational in design, with con- sistent methodology for data collection across different healthcare systems through use of a standardized elec- tronic case report form. Participants were recruited from both primary and specialist care. Broad inclusion criteria were used to ensure that the study sample was as repre- sentative as possible of the general adult T2D population, with implications for the generalizability of the findings.
As evidenced by key demographic and clinical charac- teristics, the participants spanned a wide spectrum of disease. Our findings provide contemporary prevalence estimates for several non-US countries where up-to- date data were limited or absent [16]. Furthermore, our findings may provide valuable background data for local healthcare payers and policy makers to assist with evalu- ating strategies to reduce CVD risk in adults with T2D.
The application of our findings to the design of CV out- come trials in the study countries could enhance the generalizability of their results by informing trial entry criteria and aiming to increase the representative nature of the trial sample compared with the general T2D population.
The present study has limitations. It is possible that our prevalence data are overestimates, as there may be a tendency for people with complications to consult their healthcare provider more frequently than the general T2D population. This form of ascertainment bias could explain why the CVD prevalence was similar in primary and specialist care. Additionally, very ill people with rela- tively high rates of complications including CVD may have been unable to attend routine healthcare visits. We cannot exclude the possibility of consent bias, a potential limitation of any study requiring participants’ consent for inclusion, in that individuals willing to participate in the study may not have been fully representative of the gen- eral population of patients with T2D. Medication use may have been influenced by country-specific guidelines for management of patients with T2D and between-country
differences in approvals and reimbursement of individual medications and GLA classes. Furthermore, our study was non-interventional and did not mandate screening for, or adjudication of, the presence of complications. Our findings relied on the clinical capabilities and documen- tation specific to each participant’s healthcare setting.
The non-interventional nature of CAPTURE meant that some participants may have had undiagnosed or misdi- agnosed CVD, particularly in clinics or countries where relevant investigations were not recommended, there was a lack of diagnostic capability, or where medical records were fragmented or incomplete. As it was important to identify a study population representative of patients with T2D regularly attending primary and/or second- ary diabetes centers across the different countries and guarantee accuracy in data collection, the choice of par- ticipating sites in primary and specialist care was based on recommendations from personnel with knowledge of the local health system who were employed by the spon- sor rather than real-world country-specific data, with the possibility of selection bias. However, final participating sites were selected by the contract research organization (and approved by personnel employed by the sponsor) to optimize the accuracy of CVD data collection.
Conclusions
CAPTURE found that approximately one in three adults with T2D had established CVD. ASCVD accounted for most of this burden, with stable coronary artery dis- ease, carotid artery disease, and stroke being the major contributors. Most participants with CVD were not managed according to the most recent diabetes and car- diology guidelines, implying potential scope for reducing the excess risk through evidence-based interventions.
Our data provide a benchmark against which trends can be monitored in order to evaluate the implementation of recent international guidelines.
Abbreviations
ACE: Angiotensin-converting enzyme; ARB: Angiotensin II receptor blocker;
ASCVD: Atherosclerotic cardiovascular disease; BMI: Body mass index; CHD:
Coronary heart disease; CI: Confidence interval; CV: Cardiovascular; CVD:
Cardiovascular disease; eGFR: Estimated glomerular filtration rate; GLA: Blood glucose-lowering agent; GLP-1 RA: Glucagon-like peptide-1 receptor agonist;
HbA1c: Glycated hemoglobin; HR: Hazard ratio; IQR: Interquartile range; PAD:
Peripheral artery disease; POR: Prevalence odds ratio; SGLT2i: Sodium-glucose co-transporter-2 inhibitor.
Supplementary Information
The online version contains supplementary material available at https:// doi.
org/ 10. 1186/ s12933- 021- 01344-0.
Additional file 1. Additional methods, data and analyses and full list of CAPTURE study investigators/collaborators.
Acknowledgements
The authors would like to thank the CAPTURE study participants, investigators, and coordinators. The authors are grateful to Anil Dandu, PhD, Novo Nordisk, for review of and input to the manuscript. The authors acknowledge the contributions of Usha K Thamattoor, MA, and Gaurav Chaudhary, MSc, Novo Nordisk, in addition to Ilan Yanuv, MSc, and Aliza Rozenberg, MA, Hadassah Hebrew University Hospital, to the statistical analyses. Medical writing support was provided by Anna Campbell, PhD, and editorial assistance provided by Izabel James, MBBS, both of Ashfield MedComms, an Ashfield Health com- pany, funded by Novo Nordisk.
Previous presentation
Parts of this study have been presented at the 56th Annual meeting of the European Association for the Study of Diabetes (EASD), Vienna, Austria, 21–25 September 2020.
Authors’ contributions
All authors confirm that they meet the International Committee of Medical Journal Editors (ICJME) uniform requirements for authorship and that they have contributed to critical analysis and interpretation of the data, drafting and/or critically reviewing the article, and sharing the final responsibility for the content of the manuscript, as well as the decision to submit it for publica- tion. OM is the guarantor of this work and, as such, had full access to all the data in the study, and takes responsibility for the integrity of the data and the accuracy of the data analysis. Author contributions are as follows: conceptual- ization: NAR; methodology: NAR, OM; formal analysis: KTE and MSK; investiga- tion: OM, AA, JLAL, FB, PD, TMED, GD, TH, CL, GTR, SS, KU, and SV; data curation:
KTE and MSK; writing/original draft preparation: KTE, NAR, MSK, and OM;
writing/review and editing: all authors; visualization: KTE and MSK; supervision:
NAR, KTE, and MSK. All authors read and approved the final manuscript.
Funding
The CAPTURE study was funded by Novo Nordisk A/S. The funding source (Novo Nordisk A/S) participated in the study design, site selection (in collabo- ration with a contract research organization [CRO]), study coordination, data management, data analysis, and study report preparation. The CRO (Parexel in European countries or ICON in others) was responsible for study coordination and data collection. The manuscript was drafted with input from all authors.
All authors had full access to all the data in the study and had final responsibil- ity for the decision to submit for publication.
Availability of data and materials
The datasets used and/or analyzed during the current study are available from the corresponding author on reasonable request.
Declarations
Ethics approval and consent to participate
The study protocols were approved by the appropriate independent eth- ics committees and relevant institutional review boards. The study was conducted in accordance with the Declaration of Helsinki [17], International Society for Pharmacoepidemiology Good Pharmacoepidemiology Practices [18], and local regulations. All participants provided written informed consent prior to participation.
Consent for publication Not applicable.
Competing interests
Ofri Mosenzon reports advisory board membership from Novo Nordisk, Eli Lilly, Sanofi, Merck Sharp & Dohme, Boehringer Ingelheim, Novartis, AstraZen- eca, and BOL Pharma; speaker’s bureau honorarium from AstraZeneca, Novo Nordisk, Eli Lilly, Sanofi, Merck Sharp & Dohme, Boehringer Ingelheim, and Janssen; and research grants from Novo Nordisk and AstraZeneca. Abdullah Alguwaihes reports speaker’s bureau honoraria and advisory board member- ship from AstraZeneca, Boehringer Ingelheim, Eli Lilly, Novo Nordisk, and Sanofi; in addition to research support from AstraZeneca and Novo Nordisk.
Jose Luis Arenas Leon reports advisory board membership from Novo Nordisk, AstraZeneca, Merck Sharp & Dohme, and Novartis; speakers bureau hono- rarium from Novo Nordisk, AstraZeneca, Merck Sharp & Dohme, and Merck;
and research grants from Novo Nordisk, AstraZeneca, Amgen, Merck Sharp &
Dohme, Novartis, Sanofi, Takeda, Janssen, and Bristol Myers Squibb. Fahri Bay- ram reports speaker honoraria and travel sponsorship from Bilim İlaç, Abbott, Novo Nordisk, Sanofi Genzyme, Pfizer, and Eczacıbaşı İlaç; advisory board and consultancy for Novo Nordisk, Sanofi Genzyme, Abbott, Pfizer, and Bilim İlaç;
and participation in clinical trials for Novo Nordisk, Lilly, Sanofi, and Abbott.
Patrice Darmon reports honoraria, consultancy, advisory role, lectures, or travel grants from AstraZeneca, Boehringer Ingelheim, Eli Lilly, Merck Sharp and Dohme, Novartis, Novo Nordisk, Sanofi, Mundipharma, and Abbott. Timothy M.E. Davis reports speaker’s bureau honoraria and advisory board membership from Eli Lilly, Merck Sharp & Dohme, Novo Nordisk, and Sanofi; and speaker’s bureau honorarium from Boehringer Ingelheim and AstraZeneca. Guillermo Dieuzeide reports speaker`s bureau honoraria, advisory board member- ship, and grants from AstraZeneca, Novo Nordisk, Sanofi Aventis, and Roche Diagnosis. Kristen T. Eriksen Margit S. Kaltoft and Nicolai A. Rhee are employees of Novo Nordisk; Margit S. Kaltoft and Nicolai A. Rhee also own stock and/
or shares in Novo Nordisk. Tianpei Hong reports speaker’s bureau honoraria and advisory board membership from AstraZeneca, Boehringer Ingelheim, Eli Lilly, Merck Serono, Merck Sharp & Dohme, Novartis, Novo Nordisk, and Sanofi.
Csaba Lengyel reports honoraria and travel grants from AstraZeneca, Berlin Chemie/A Menarini, Boehringer Ingelheim, EGIS, KRKA, Lilly Hungária Kft., MSD Pharma, Novartis, Novo Nordisk, Pfizer, Richter Gedeon, Sandoz, Sanofi Aventis, Servier, TEVA, and Wörwag Pharma. Giuseppina T. Russo reports speaker’s bureau honoraria and advisory board membership from AstraZeneca, Boehringer Ingelheim, Eli Lilly, Merck Sharp & Dohme, Novartis, Novo Nordisk, and Sanofi. Shinichiro Shirabe reports honoraria from Novo Nordisk Pharma Ltd., Sumitomo Dainippon Pharma, and Merck Sharp & Dohme. Katherine Urbancova has worked on oral presentations, articles, and advisory boards for Novo Nordisk, Sanofi Aventis, Boehringer Ingelheim, Novartis, Eli Lilly, and Merck. Sergio Vencio reports research or educational grants from Novartis, Novo Nordisk, Boehringer Ingelheim, and Biomm.
Author details
1 Diabetes Unit, Department of Endocrinology and Metabolism, Hadassah Medical Center, Faculty of Medicine, Hebrew University of Jerusalem, Hadas- sah Hebrew University Hospital, PO Box 12000, 91120 Jerusalem, Israel. 2 King Saud University, King Saud University Medical City, Riyadh, Kingdom of Saudi Arabia. 3 Centro de Atención E Investigación Cardiovascular del Potosí, San Luis Potosí, Mexico. 4 Department of Endocrinology and Metabolism, Faculty of Medicine, Erciyes University, Kayseri, Turkey. 5 Aix Marseille University, INSERM, INRA, C2VN, Marseille, France. 6 Medical School, University of West- ern Australia, Fremantle Hospital, Fremantle, Australia. 7 Centro de Atención Integral en Diabetes, Endocrinología Y Metabolismo, Chacabuco, Buenos Aires, Argentina. 8 Novo Nordisk A/S, Søborg, Denmark. 9 Department of Endocrinol- ogy and Metabolism, Peking University Third Hospital, Beijing, China. 10 Uni- versity of Szeged, Szeged, Hungary. 11 Novo Nordisk Health Care AG, Zurich, Switzerland. 12 Department of Clinical and Experimental Medicine, Policlinico Universitario, University of Messina, Messina, Italy. 13 H. E. C Science Clinic, Yokohama, Japan. 14 Diabetologická Interní Ambulance S.R.O., Ostrava, Czech Republic. 15 Instituto de Ciencias Farmaceuticas, Goiânia, Goiás, Brazil.
Received: 7 April 2021 Accepted: 12 July 2021
References
1. Gerstein HC. Diabetes: dysglycaemia as a cause of cardiovascular out- comes. Nat Rev Endocrinol. 2015;11:508–10.
2. International Diabetes Federation: IDF Diabetes Atlas, 9th edn. Brussels, Belgium: International Diabetes Federation; 2019.
3. Sarwar N, Gao P, Seshasai SR, Gobin R, Kaptoge S, Di Angelantonio E, et al. Diabetes mellitus, fasting blood glucose concentration, and risk of vascular disease: a collaborative meta-analysis of 102 prospective studies.
Lancet. 2010;375:2215–22.
4. Seshasai S, Kaptoge S, Thompson A, Di Angelantonio E, Gao P, Sarwar N, et al. Diabetes mellitus, fasting glucose, and risk of cause-specific death.
N Engl J Med. 2011;364:829–41.
5. Cosentino F, Grant PJ, Aboyans V, Bailey CJ, Ceriello A, Delgado V, et al. 2019 ESC guidelines on diabetes, pre-diabetes, and
cardiovascular diseases developed in collaboration with the EASD. Eur Heart J. 2020;41:255–323.
6. American Diabetes Association. 10. Cardiovascular Disease and Risk Man- agement: Standards of Medical Care in Diabetes—2021. Diabetes Care.
2021;44:S125-50.
7. Arnett DK, Blumenthal RS, Albert MA, Buroker AB, Goldberger ZD, Hahn EJ, et al. 2019 ACC/AHA guideline on the primary prevention of cardio- vascular disease: executive summary: a report of the American College of Cardiology/American Heart Association Task Force on Clinical Practice Guidelines. Circulation. 2019;140:e563–95.
8. Buse JB, Wexler DJ, Tsapas A, Rossing P, Mingrone G, Mathieu C, et al.
Update to: management of hyperglycemia in type 2 diabetes, 2018. A consensus report by the American Diabetes Association (ADA) and the European Association for the Study of Diabetes (EASD). Diabetes Care.
2018;2020(43):487–93.
9. Harding JL, Pavkov ME, Magliano DJ, Shaw JE, Gregg EW. Global trends in diabetes complications: a review of current evidence. Diabetologia.
2019;62:3–16.
10. Weng W, Tian Y, Kong SX, Ganguly R, Hersloev M, Brett J, et al. The preva- lence of cardiovascular disease and antidiabetes treatment characteristics among a large type 2 diabetes population in the United States. Endo- crinol Diabetes Metab. 2019;2:e00076.
11. Rungby J, Schou M, Warrer P, Ytte L, Andersen GS. Prevalence of cardio- vascular disease and evaluation of standard of care in type 2 diabetes: a nationwide study in primary care. Cardiovasc Endocrinol. 2017;6:145–51.
12. Pugliese G, Solini A, Bonora E, Orsi E, Zerbini G, Fondelli C, et al. Distribu- tion of cardiovascular disease and retinopathy in patients with type 2 diabetes according to different classification systems for chronic kidney disease: a cross-sectional analysis of the renal insufficiency and cardio- vascular events (RIACE) Italian multicenter study. Cardiovasc Diabetol.
2014;13:59.
13. Gjelsvik B, Tran AT, Berg TJ, Bakke A, Mdala I, Nokleby K, et al. Exploring the relationship between coronary heart disease and type 2 diabetes: a cross- sectional study of secondary prevention among diabetes patients. BJGP Open. 2019;3: bjgpopen18X101636.
14. McGurnaghan S, Blackbourn LAK, Mocevic E, Haagen Panton U, McCrim- mon RJ, Sattar N, et al. Cardiovascular disease prevalence and risk factor prevalence in type 2 diabetes: a contemporary analysis. Diabet Med.
2019;36:718–25.
15. Franch-Nadal J, Mata-Cases M, Vinagre I, Patitucci F, Hermosilla E, Casellas A, et al. Differences in the cardiometabolic control in type 2 diabetes according to gender and the presence of cardiovascular disease: results from the eControl study. Int J Endocrinol. 2014;2014:131709.
16. Einarson TR, Acs A, Ludwig C, Panton UH. Prevalence of cardiovascular disease in type 2 diabetes: a systematic literature review of scientific evidence from across the world in 2007–2017. Cardiovasc Diabetol.
2018;17:83.
17. World Medical Association. Declaration of Helsinki: ethical principles for medical research involving human subjects. JAMA. 2013;310:2191–4.
18. Guidelines for Good Pharmacoepidemiology Practices (GPP) https://
www. pharm acoepi. org/ resou rces/ polic ies/ guide lines- 08027/.
19. American Diabetes Association. 10. Cardiovascular Disease and Risk Man- agement: Standards of Medical Care in Diabetes—2020. Diabetes Care.
2020;43:S111-34.
20. Trulicity® Prescribing Information https:// www. acces sdata. fda. gov/ drugs atfda_ docs/ label/ 2019/ 12546 9s023 lbl. pdf. Accessed 24 June 2021.
21. Victoza® Prescribing Information https:// www. novo- pi. com/ victo za. pdf.
Accessed 24 June 2021.
22. Invokana® Prescribing Information http:// www. janss enlab els. com/ packa ge- insert/ produ ct- monog raph/ presc ribing- infor mation/ INVOK ANA- pi.
pdf. Accessed 24 June 2021.
23. Farxiga® Prescribing Information https:// www. acces sdata. fda. gov/ drugs atfda_ docs/ label/ 2014/ 20229 3s003 lbl. pdf. Accessed 24 June 2021.
24. Jardiance® Prescribing Information https:// docs. boehr inger- ingel heim.
com/ Presc ribing% 20Inf ormat ion/ PIs/ Jardi ance/ jardi ance. pdf. Accessed 24 June 2021.
25. Ozempic® Prescribing Information [https:// www. novo- pi. com/ ozemp ic.
pdf]. Accessed 24 June 2021.
26. International Diabetes Federation: IDF Diabetes Atlas, 8th edn. Brussels, Belgium: International Diabetes Federation; 2017.
27. Gerstein HC, Colhoun HM, Dagenais GR, Diaz R, Lakshmanan M, Pais P, et al. Dulaglutide and cardiovascular outcomes in type 2 diabetes (REWIND): a double-blind, randomised placebo-controlled trial. Lancet.
2019;394:121–30.
28. Wiviott SD, Raz I, Bonaca MP, Mosenzon O, Kato ET, Cahn A, et al. Dapa- gliflozin and Cardiovascular Outcomes in Type 2 Diabetes. N Engl J Med.
2019;380:347–57.
29. Barquera S, Pedroza-Tobías A, Medina C, Hernández-Barrera L, Bibbins- Domingo K, Lozano R, et al. Global overview of the epidemiology of atherosclerotic cardiovascular disease. Arch Med Res. 2015;46:328–38.
30. Schütte S, Acevedo PNM, Flahault A. Health systems around the world—a comparison of existing health system rankings. J Glob Health.
2018;8:010407.
31. World Health Organization (WHO). Global Atlas on Cardiovascular Disease Prevention and Control. Geneva: World Health Organization; 2011.
32. Boonman-de Winter LJM, Rutten FH, Cramer MJM, Landman MJ, Liem AH, Rutten GEHM, Hoes AW. High prevalence of previously unknown heart failure and left ventricular dysfunction in patients with type 2 diabetes.
Diabetologia. 2012, 55(8):2154–2162.
33. World Health Organization (WHO). A Prioritized Research Agenda for Prevention and Control of Noncommunicable Diseases. Geneva: World Health Organization; 2011.
34. Joseph P, Leong D, McKee M, Anand SS, Schwalm JD, Teo K, et al. Reduc- ing the global burden of cardiovascular disease, part 1: the epidemiology and risk factors. Circ Res. 2017;121:677–94.
35. Schnell O, Erbach M, Hummel M. Primary and secondary prevention of cardiovascular disease in diabetes with aspirin. Diab Vasc Dis Res.
2012;9:245–55.
36. Baigent C, Blackwell L, Collins R, Emberson J, Godwin J, Peto R, et al.
Aspirin in the primary and secondary prevention of vascular disease: col- laborative meta-analysis of individual participant data from randomised trials. Lancet. 2009;373:1849–60.
37. Baigent C, Blackwell L, Emberson J, Holland LE, Reith C, Bhala N, et al.
Efficacy and safety of more intensive lowering of LDL cholesterol: a meta- analysis of data from 170,000 participants in 26 randomised trials. Lancet.
2010;376(9753):1670–81.
Publisher’s Note
Springer Nature remains neutral with regard to jurisdictional claims in pub- lished maps and institutional affiliations.