CLINICAL RESEARCH ARTICLE
OPENPredictive performance and metabolite dynamics of proton MR spectroscopy in neonatal hypoxic – ischemic encephalopathy
Hajnalka Barta 1✉, Agnes Jermendy1, Livia Kovacs1, Noemie Schiever1, Gabor Rudas2and Miklos Szabo1
© The Author(s) 2021
BACKGROUND:Prognostic value of proton MR spectroscopy (H-MRS) in hypoxic–ischemic encephalopathy (HIE) is acknowledged;
however, effects of gestational age (GA) and postnatal age (PA) on prediction and metabolite levels are unknown.
METHODS:One hundred and sixty-nine newborns with moderate-to-severe HIE were studied, having≥1 H-MRS scan during postnatal days 0–14 and known neurodevelopmental outcome (Bayley-II score/cerebral palsy/death). Initial scans were categorized by PA (day 1–3/4–6/≥7), and metabolite ratios were compared by predictive value. Metabolite dynamics were assessed in a total of 214 scans performed in the study population, using regression modeling, with predictors GA, PA, and outcome.
RESULTS:N-acetyl-aspartate (NAA)/creatine (Cr) and myo-inositol (mI)/NAA height ratios were consistently associated with outcome throughout thefirst 14 days, with the highest predictive value in the late (≥7 days) period (AUC=0.963 and 0.816, respectively). Neither GA nor PA had an overall effect on these metabolite ratios, which showed strongest association with outcome (p< 0.001). Assessed separately in patients with good outcome, GA became a significant covariate for metabolite ratios (p=0.0058 and 0.0002, respectively). However, this association disappeared in the poor outcome group.
CONCLUSIONS:In HIE, NAA/Cr and mI/NAA give most accurate outcome prediction throughout postnatal days 0–14. GA only affected metabolite levels in the good outcome group.
Pediatric Research; https://doi.org/10.1038/s41390-021-01626-z
IMPACT:
● Proton MR spectroscopy metabolite ratiosN-acetyl-aspartate/creatine and myo-inositol/N-acetyl-aspartate have persistently high predictive value throughout postnatal days 0–14 in newborns with hypoxic–ischemic encephalopathy, with the highest predictive power between postnatal days 7 and 14.
● Overall, neither metabolite ratio was affected by gestational age nor by postnatal age, while they showed the strongest association with neurological outcome.
● However, in newborns facing good outcome, metabolite ratios were associated with gestational age, whereas in cases facing poor outcome, this association disappeared.
● Proton MR spectroscopy provides valuable prognostic information in neonatal hypoxic–ischemic encephalopathy throughout thefirst 2 weeks of life, irrespective of the timing of MR scan.
INTRODUCTION
Neonatal hypoxic–ischemic encephalopathy (HIE) affects 1–2‰of newborns in the developed countries and is one of the leading causes of permanent neurological handicap1. A wide variety of neuroprotective therapies are emerging, additional to the current gold standard therapeutic hypothermia, emphasizing the need for early outcome prediction for risk stratification strategies2,3.
Brain proton magnetic resonance spectroscopy (H-MRS) is one of the most accurate tools for predicting long-term neurodevelop- mental outcome in HIE, especially during thefirst weeks of life4,5. Recent evidence suggests that the prognostic accuracy of H-MRS is not equal in the period between postnatal hours 18–96 and postnatal days 7–146. However, the effect of the newborns’
postnatal age on the predictive value of H-MRS throughout the
first weeks of life has not been studied in detail, albeit examination of all newborns with HIE in a uniform postnatal narrow age window is not plausible, due to variable clinical stability and available resources. Moreover, existing evidence proposes that metabolite ratios may also be affected by gestational age7. The influence of neither of these factors has been studied so far on the predictive value of H-MRS, even though accurate description of metabolite dynamics would be essential, especially by investigating metabolite ratios registered conven- tionally, to ensure generalizability.
Thus, the purpose of our study was to determine whether H-MRS is a suitable predictive tool throughout days of life 0–14 with particular interest in the effect of postnatal age at H-MRS scan on the accuracy of outcome prediction in newborns with HIE.
Received: 12 January 2021 Revised: 26 April 2021 Accepted: 7 June 2021
1Division of Neonatology, 1st Department of Paediatrics, Semmelweis University, Budapest, Hungary.2Medical Imaging Centre, Department of Neuroradiology, Semmelweis University, Budapest, Hungary.✉email: barta.hajnalka@med.semmelweis-univ.hu
Additionally, we aimed to investigate how gestational age and postnatal age affect the most commonly analyzed, conventionally determined metabolite ratios.
METHODS Patient selection
In our retrospective analysis, we reviewed all 484 consecutive patients diagnosed with moderate-to-severe HIE according to the criteria of the international TOBY trial8, born between January 2006 and December 2016, and admitted to the regional cooling center, the Neonatal Intensive Care Unit (NICU) of the 1st Department of Paediatrics, Semmelweis University, Budapest, Hungary. Prospective consent was obtained from parents/legal guardians of all newborns participating in our study. Ethical permission for the analysis was obtained from the Scientific and Medical Research Council Ethics Committee of Hungary (11790-2/2016/EKU).
Inclusion criteria were (A) having at least one brain H-MRS examination performed during thefirst 14 days of life and (B) having a neurodevelop- mental follow-up examination result, as detailed below OR death (<28 days of life OR >28 days associated with HIE). Exclusion criteria were (c) gestational age <36 weeks OR (d) other underlying conditions for encephalopathy besides HIE (i.e., stroke, intracranial hemorrhage, con- genital malformation, or metabolic disease) OR (e) lack of hypothermia treatment OR (f) low-quality brain H-MRS scan. The algorithm for patient selection is presented in Fig.1.
Clinical care of newborns
Whole-body hypothermia treatment was initiated as soon as possible but within 6 h after delivery using a water-filled mattress (Tecotherm©;
TecCom, Halle, Germany). The target rectal temperature was between 33 and 34 °C, maintained for 72 h. In the rewarming phase, temperature increase velocity was 0.5 °C/h. All infants were invasively ventilated throughout the cooling and rewarming phase and were extubated following rewarming. Sedation was provided using continuous morphine infusion, and clinical or electrophysiological seizures were treated with phenobarbitone and midazolam, if necessary.
Clinical care of the newborns was performed according to our unit’s protocol for HIE in the examined time period, described in detail in our previous study9. Neurological staging was performed according to the modified Sarnat amplitude-integrated electroencephalography (aEEG) scoring system, as follows: moderate encephalopathy was defined as moderately abnormal aEEG pattern (discontinuous normal voltage) on
<6 h aEEG AND Sarnat stage 1–2, severe encephalopathy was defined as severely abnormal (burst suppression (BS), low voltage (LV), orflat trace (FT)) on <6 h aEEG OR Sarnat 310. In case of hemodynamic instability, infants received cardiovascular support (dobutamine, dopamine, norepi- nephrine, epinephrine, hydrocortisone, or milrinone) and invasive ventilation.
H-MRS examination
H-MRS studies were carried out as part of the routine MR examination on a 3-Tesla Philips Achieva magnetic resonance imaging (MRI) scanner between 2006 January and 2015 November and on a 3-Tesla Philips Ingenia MRI scanner between 2015 December and 2016 December (Philips Medical Systems, Best, The Netherlands) at the Department of Neuror- adiology of the Medical Imaging Centre, Semmelweis University, as early as the infant reached clinical stability and was suitable for transport. Control MR and H-MRS were performed at a later age, if needed. The MR scans were performed between days of life (DOL) 1 and 14 (median 4).
The Neonatal Emergency & Transport Services of the Peter Cerny Foundation provided the neonatal transport and the critical care, including hypothermia treatment and sedation during MR scanning. Continuous monitoring of transcutaneous oxygen saturation and capnography was provided for all neonates during the MR scan, using Medrad Veris MR Monitoring System (Bayer Healthcare LLC, Whippany, NJ). During the MR examination, passive hypothermia was provided (bare infants, covered only with a blanket), considering the relatively cool room temperature of the MR examination room. Pre-scan and post-scan core temperature was checked per protocol, and no deviation larger than ±0.5 °C was detected.
Acquisition protocols
Proton MR spectra were acquired using the PRESS (Point RESolved Spectroscopy) single-voxel localization sequence, at an intermediate echo
time (TE) of 144 ms, repetition time (TR)=2000, number of signal acquisitions (NSA)=128. Duration of scan was approximately 30 min.
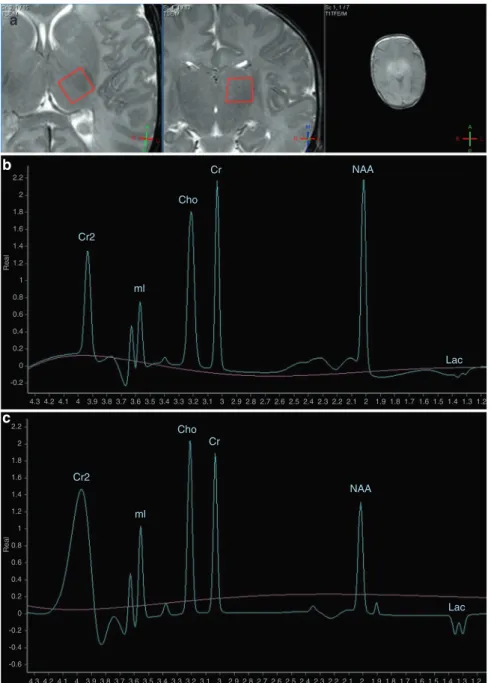
The analyzed volume of interest was a 1 × 1 × 1 cm voxel in the left thalamus of infants, localized based on gradient echo survey images acquired with TE=5 ms, TR=75 ms, and 30° flip angle (Fig. 2a). For analysis of the acquired spectra, we used the vendor-provided data- processing software on the MR console, “Spektroview,” and its generic scripts, consisting of the following data-processing steps: (1) Initial Baseline Subtraction (only on 144 and 288 ms TEs), (2) Peak Selection (where all possible peaks were selected, except the water peak), (3) Peak Fitting (Analysis range [−1; 4.35] ppm, Visualized range [0; 4.35]
ppm, Baseline Terms: 7; Gaussian Character [%]: 90), (4) Phase: Real, (5) Lock relative frequency option: ON (this enables for more robust peak fitting, by detecting the individual peaks using their known difference of frequency), (6) Lock width option: OFF (peak width is freelyfitted by the software).
Representative spectra of newborns facing good and poor outcome are presented in Fig.2b, c.
Metabolite ratios
For quality assurance of the registered H-MRS, only spectral data of peaks with sufficiently high signal-to-noise ratio (>2) were included in our
Diagnosis of moderate to severe HIE according to
TOBY criteria n = 491
Brain H-MRS examination during the first 14 days of life
Neurodevelopmental follow-up between 18 and 26 months of age
Further exclusion criteria
(c) Gestational age < 36 weeks:
n = 12 (d) Additional cause for
encephalopathya n = 25 (e) No hypothermic
treatment n = 7 (f) Low quality H-MRS
n = 4 (A) Brain H-MRS scan:
n = 345 – +
(B) Follow-up results n = 217
After exclusion n = 169 newborns
H-MRS spectraa (n = 169) with age at scan
categorization
All H-MRS spectrab (n = 214) uncategorized by age
Analysis of prognostic performance (ROC analysis)
Analysis of metabolite dynamics (regression model)
No brain H-MRS scan n = 146
No follow-up results:
n = 128 –
+
–
Fig. 1 Algorithm of patient selection for our study, detailing inclusion and exclusion criteria.aAge at scan categorization was done based on the initial performed H-MRS scan, where more than one was performed.bInitial and control H-MRS spectra were also included, without age at scan categorization. ROC receiver- operating characteristics.
2
1234567890();,:
analysis. From the registered H-MRS spectrum, we analyzed the metabolite ratios showing high predictive power in newborns with HIE when registered conventionally, according to existing research results: N- acetyl-aspartate (NAA)/creatine (Cr), NAA/choline (Cho), and myo-inositol (mI)/NAA ratios9. Both ratios of peak height and ratios of peak areas were analyzed, due to their similar reliability in case of conventional H-MRS sequence11.
Postnatal age categories
For analysis of optimal postnatal age at H-MRS for outcome prediction,first acquired H-MRS results were categorized based on postnatal age at scan, given in DOL, as follows: (I) early H-MRS (DOL 1–3), (II) midtime H-MRS (DOL 4–6) and (III) late H-MRS (DOL≥7)12.
In the analysis of metabolite ratio dynamics, initial and control H-MRS results were also included, without the above-described age categorization.
Follow-up
Neurodevelopmental follow-up was measured by Bayley Scales of Infant Development II tool-kit (BSID-II) on all patients performed between 18 and 26 months of age by trained personnel blinded to the H-MRS results. We defined poor outcome as a composite of either death (<28 days of age OR
>28 days associated with HIE) OR moderately/severely delayed develop- ment (Mental Developmental Index (MDI) or Psychomotor Developmental Index (PDI) <70). In children where BSID-II was not feasible due to severe disability, diagnosed cerebral palsy OR bilateral cortical visual impairment with no useful vision OR bilateral sensorineural hearing loss constituted the poor outcome. All other outcomes were considered as good outcome.
Statistical analysis
Categorical variables are reported as absolute numbers and percentages, while continuous variables as mean ± standard deviation or median [25th to 75th interquartile range] depending on the distribution of the Cr2
2.2
a
2 1.8 1.6 1.4 Real1.2
1 0.8 0.6 0.4 0.2
-0.2
4.3 4.2 4.1 4 3.9 3.8 3.7 3.6 3.5 3.4 3.3 3.2 3.1 3 2.9 2.8 2.7 2.6 2.5 2.4 2.3 2.2 2.1 2 1.9 1.8 1.7 1.6 1.5 1.4 1.3 1.2 0
ml
Cho
Cr NAA
Lac
Cr2
ml
Cho Cr
NAA
Lac
4.3 4.2 4.1 4 3.9 3.8 3.7 3.6 3.5 3.4 3.3 3.2 3.1 3 2.9 2.8 2.7 2.6 2.5 2.4 2.3 2.2 2.1 2 1.9 1.8 1.7 1.6 1.5 1.4 1.3 1.2 2.2
2 1.8 1.6 1.4 1.2
Real
1 0.8 0.6 0.4 0.2
-0.2 -0.4 -0.6 0
b
c
Fig. 2 Representative H-MRS spectra of newborns with moderate-to-severe HIE. aGradient echo survey images acquired with echo time (TE)=5 ms, repetition time (TR)=75 ms, and 30°flip angle for selection of volume of interest (VOI) from the left thalamus of infants (red frame).bH-MRS of newborn who later had good outcome at TE=144 ms.cH-MRS of newborn who later had poor outcome at TE=144 ms.
Cho choline, Cr creatine, Cr2 creatine, second peak, Lac lactate, doublet peak, mI myo-inositol, doublet peak, NAAN-acetyl-aspartate.xaxis represents chemical shift in parts per million (ppm),yaxis represents signal intensity in arbitrary units.
3
parameters. Shapiro–Wilk test was used to assess normality. Categorical variables were compared with Fisher’s exact test, while continuous variables were compared with Student’s t test/analysis of variance or Mann–Whitney U test/Kruskal–Wallis test for parametric and non- parametric comparisons, respectively. Prognostic performance of the metabolite ratios showing significant association with outcome was evaluated by receiver-operating characteristics (ROC) analysis. Repeated- measures linear mixed-effect regression model, with first-order autore- gressive within-group correlation structure fitted by maximizing the restricted log-likelihood, was performed to assess metabolite dynamics, with metabolite ratios as dependent variables and postnatal age, gestational age, and neurological outcome as predictors. Demographic, clinical, and spectral data were analyzed using the IBM SPSS Statistics software version 23.0.0.0 (IBM Corporation, Armonk, NY), as well as R Statistical software 4.0.2 (R Core Team, Vienna, Austria).
RESULTS
One hundred and sixty-nine neonates with moderate-to-severe HIE met the inclusion criteria, and were enrolled in our study.
Patient selection is presented on Fig.1. From this patient pool, 129 newborns had only 1 initial H-MRS scan, 30 newborn had a total of 2 scans, and 8 newborn had 3 scans, summing to a total of 214 H-MRS results. Initial scans were performed on median DOL 4, second scans on median DOL 7, and the third scans on median DOL 8. Exact metabolite ratios for newborns having multiple H-MRS scans are presented in the Supplementary Table.
A total of 7 newborns were excluded due to lack of hypothermia treatment as per protocol: 1 infant did not receive cooling as it was not yet adopted as a standard center practice in
2008, 1 infant received hypothermia with late onset (9 h of life) due to logistical reasons, and 5 newborns suffered postpartum asphyxia treated with altered hypothermia protocols. All other 169 infants enrolled received therapeutic hypothermia per protocol.
Ninety-six of the 169 patients had the H-MRS examination performed while receiving whole-body hypothermia; the remain- ing 73 patients were scanned under normothermic conditions, after the completion of hypothermia treatment. All newborns with early (DOL 1–3) H-MRS scans had the examination under hypothermic conditions, and 6 newborns with midtime (DOL 4–6) H-MRS scan were examined during ongoing hypothermic treatment.
A total of 69 patients had poor outcome, among whom 25 died, all during the neonatal period. Of the 44 newborns who survived but presented with poor outcome, MDI <70 was registered in 40 cases, whereas PDI <70 in 37 cases (both scores where <70 in 35 cases). Cerebral palsy was diagnosed in 21 cases, and 1 child presented with bilateral sensorineural hearing loss.
Clinical data of newborns are presented in Table1according to postnatal age category at initial H-MRS, as well as in Table 2, sorted according to the number of performed H-MRS examinations.
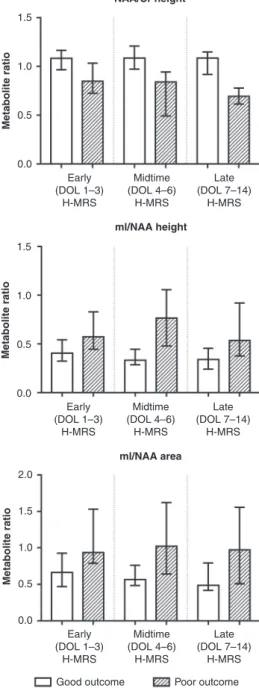
Analysis of the association between metabolite ratios and outcome across all three postnatal age categories revealed that only NAA/Cr peak height ratio and mI/NAA peak height ratio and peak area ratio were able to consistently differentiate between outcomes throughout early, midtime, and late postnatal age windows as well. Detailed results of the performed Mann–Whitney
Table 1. Clinical characteristics of newborns enrolled in the study, categorized by postnatal age at initial scan.
Early H-MRS (DOL 1–3), n=91
Midtime H-MRS (DOL 4–6), n=50
Late H-MRS (DOL 7–14),
n=28 pvalue
Male sex, % 63% 37% 61% 0.071
Gestational age (weeks) 39 [38; 40] 40 [39; 40] 39 [37; 40] 0.298
Birth weight (g) 3175 ± 521 3321 ± 542 3082 ± 528 0.126
Apgar 1’ 2 [0; 3] 2 [1; 4] 2 [1; 5] 0.425
Apgar 5’ 4 [3; 6] 5 [3; 6] 5 [3; 7] 0.107
Apgar 10’ 5 [4; 7] 6 [5; 7] 5 [4; 7] 0.758
Onset of hypothermia (h) 1.8 [1.2; 2.5] 2.1 [1.4; 2.6] 1.8 [1.0; 2.7] 0.439
Lowest pH <1 h of age 7.03 ± 0.20 7.04 ± 0.18 6.96 ± 0.24 0.202
Highest BD <1 h of age 17.7 ± 6.2 16.1 ± 6.7 16.5 ± 7.0 0.352
Neurology
Clinical or aEEG seizures (<24 h) 59% 56% 39% 0.173
Abnormal aEEG pattern (DNV, BS, LV, FT) 98% 94% 96% 0.506
aEEG normalization (CNV) <72 h 38% 58% 43% 0.805
aEEG normalization time (h) 20 [7; 44] 14 [10; 32] 10 [5;41] 0.533
Severity of encephalopathy (severe)a 85% 68% 71% 0.054
Cardiorespiratory status and multiorgan failure
Need for invasive ventilationb 93% 94% 93% 0.980
Length of invasive ventilation (days) 4 [4; 5] 5 [4; 5] 5 [5; 7] 0.018*
Need for cardiovascular supportc 65% 74% 82% 0.172
Length of cardiovascular support (h)d 67 [40; 146] 135 [74; 197.5] 163 [60; 229] 0.002*
Data shown as median [IQR], mean ± SD, or percentage.
BDbase deficit,aEEGamplitude-integrated electroencephalography,BSburst suppression,LVlow voltage,FTflat trace,CNVcontinuous normal voltage,DNV discontinuous normal voltage.
*Boldfigures represent significant results of chi-square test, ANOVA, or Kruskal–Wallis test (p< 0.05).
aModerate and severe encephalopathy defined using the modified Sarnat aEEG score10, as follows: moderate encephalopathy DNV on <6 h aEEG AND Sarnat stage 1–2, severe encephalopathy: BS, LV, or FT on <6 h aEEG OR Sarnat 3.
bSIMV (synchronized intermittent mandatory ventilation), SIPPV (synchronous positive pressure ventilation) or HFO (high frequency oscillatory ventilation).
cDobutamine, dopamine, norepinephrine, epinephrine or milrinone infusion, or hydrocortisone supplementation.
dCalculated by summing up the length for the different vasoactive medications, in hours.
4
Utest are presented in Table3and Fig.3. ROC analysis showed that the highest predictive value could be observed in the late (DOL≥7) postnatal age window for both NAA/Cr peak height and mI/NAA peak height and peak area ratios. Overall predictive value was higher for mI/NAA height ratio than for mI/NAA area ratio (calculated as a sum of areas under the ROC curve across postnatal age categories), therefore we aimed the mixed-effect regression model on NAA/Cr height ratio and mI/NAA height ratio. Detailed results of the performed Mann–WhitneyUtest and ROC analysis are displayed in Table4.
A mixed-effect regression model was constructed to investigate metabolite dynamics in the whole patient population, using NAA/
Cr and mI/NAA height ratios as dependent variables and gestational age, postnatal age and neurological outcome as predictors. Ongoing hypothermia treatment was not included as a covariate, as it is coincidental with postnatal age during thefirst 3 postnatal days, due to the therapeutic hypothermia protocol (onset of hypothermia <6 postnatal hours, duration of hypother- mia 72 h)8. We found that, overall in the whole study population, outcome was the only significant covariate for both metabolite ratios, suggesting that these metabolite ratios are not affected by gestational age and postnatal age.
However, analyzing the mixed-effect model separately in the two outcome groups revealed that both NAA/Cr and mI/NAA ratios are significantly affected by gestational age in the good outcome group, but this association disappears in the poor outcome group. In case of postnatal age though, in the good outcome group, mI/NAA metabolite ratio proved to be highly associated with postnatal age but not NAA/Cr. In the poor
outcome group, NAA/Cr showed only slight association with postnatal age, whereas mI/NAA none. Results of the regression analysis are presented in Table5.
DISCUSSION
To the best of our knowledge, this is thefirst study to examine the effect of postnatal age on the predictive value of brain H-MRS in newborns with HIE throughout thefirst 2 weeks of life, as well as the combined effect of gestational age, postnatal age, and outcome on metabolite ratios. Ourfindings suggest that H-MRS is a valuable predictive tool throughout the examined postnatal age windows—the first 14 days of life—with the highest predictive power between postnatal days 7–14, for the metabolite ratios showing the strongest prognostic power, namely, NAA/Cr and mI/NAA ratios. Moreover, these two metabolite ratios showed the strongest association with neurodevelopmental outcome and were not significantly affected by gestational age and postnatal age, overall.
In our previous study, assessment of early (first 96 h of life), conventional H-MRS concluded that, other than having predictive power, NAA/Cr, NAA/Cho, and mI/NAA show weak correlation with postnatal age at scan duringfirst 4 days of life, hence might be considered relatively stable in this early postnatal age period9. However, no examination has been performed concerning the postnatal age dependence of these metabolite ratios in the later postnatal period. In the current research, we hypothesized that after being relatively stable in the first 4 days of life, dynamic changes of these metabolite ratios do appear in the later time Table 2. Clinical characteristics of newborns, categorized by postnatal age at initial scan.
Single H-MRS performed,n=135 Multiple (2 or 3) H-MRS performed,n=34 pvalue
Male sex, % 58% 62% 0.702
Gestational age (weeks) 40 [38; 40] 39 [38; 40] 0.535
Birth weight (g) 3230 ± 510 3090 ± 600 0.179
Apgar 1’ 1 [0; 4] 2 [1; 4] 0.100
Apgar 5’ 5 [3; 6] 4 [3; 6] 0.998
Apgar 10’ 5 [4; 7] 5 [4; 7] 0.915
Onset of hypothermia (h) 1.8 [1.2; 2.6] 1.8 [1.2; 2.8] 0.673
Lowest pH <1 h of age 7.01 ± 0.21 7.07 ± 0.17 0.135
Highest BD <1 h of age 17.0 ± 6.6 17.1 ± 6.1 0.946
Neurology
Clinical or aEEG seizures (<24 h) 67% 85% 0.527
Abnormal aEEG pattern (DNV, BS, LV, FT) 95% 100% 0.601
aEEG normalization (CNV) <72 h 72% 72% >0.999
aEEG normalization time (h) 14 [7; 36] 36 [12; 44] 0.250
Severity of encephalopathy (severe)a 75% 88% 0.111
Cardiorespiratory status and multiorgan failure
Need for invasive ventilationb 93% 97% 0.696
Length of invasive ventilation (days) 5 [4; 5] 4 [4; 5] 0.601
Need for cardiovascular supportc 70% 71% >0.999
Length of cardiovascular support (h)d 116 [60; 206] 64 [31; 131] 0.004*
Data shown as median [IQR], mean ± SD, or percentage.
BDbase deficit,aEEGamplitude-integrated electroencephalography,DNVdiscontinuous normal voltage,BSburst suppression,LVlow voltage,FTflat trace,CNV continuous normal voltage,DNVdiscontinuous normal voltage.
*Boldfigures represent significant results of chi-square test, ANOVA, or Kruskal–Wallis test (p< 0.05).
aModerate and severe encephalopathy defined using the modified Sarnat aEEG score10, as follows: moderate encephalopathy DNV on <6 h aEEG AND Sarnat stage 1–2, severe encephalopathy: BS, LV, or FT on <6 h aEEG OR Sarnat 3.
bSIMV (synchronized intermittent mandatory ventilation), SIPPV (synchronous positive pressure ventilation) or HFO (high frequency oscillatory ventilation).
cDobutamine, dopamine, norepinephrine, epinephrine or milrinone infusion, or hydrocortisone supplementation.
dCalculated by summing up the length for the different vasoactive medications, in hours.
5
periods, potentially modifying their predictive power. Our results suggest that, whereas prognostic accuracy of these metabolite ratios varies with age, NAA/Cr and mI/NAA keep their predictive power throughout thefirst 14 days of life, making them optimal for prediction.
The physiological and gestational age-related variability of metabolite levels in healthy fetuses has been previously described in detail. According to Urbanik et al., a significant rise can be detected in NAA, Cr, Cho, and mI absolute concentrations throughout gestation (weeks 18–40)7. This observation is partly confirmed by Kok et al., also describing increasing NAA absolute levels between gestational weeks 30–41, further adding that, while NAA/Cr and NAA/Cho ratios also rise in the examined gestational period, Cho/Cr ratio decreases, suggesting that absolute metabolite levels do not elevate uniformly and with Table3.ResultsofMann–WhitneyUtestcomparisonofmetaboliteratiosandoutcome,acrosspostnatalagecategoriesatH-MRSscan(n=169). EarlyH-MRS(DOL1–3)MidtimeH-MRS(DOL4–6)LateH-MRS(DOL≥7) Goodn=44Poorn=47pvalueGoodn=37Poorn=13pvalueGoodn=19Poorn=9pvalue NAA/Crheight1.08[0.97;1.16]0.85[0.73;1.02]<0.0005*1.09[0.99;1.21]0.84[0.52;0.94]<0.0005*1.09[0.93;1.15]0.69[0.62;0.74]<0.0005* NAA/Crarea1.05[0.94;1.15]0.91[0.78;1.02]<0.0005*1.00[0.97;1.12]0.93[0.67;1.08]0.1110.98[0.83;1.12]0.72[0.66;0.76]<0.0005* NAA/Choheight0.95[0.88;1.09]0.86[0.74;1.03]0.0970.80[0.75;0.92]0.69[0.57;0.83]0.1670.65[0.56;0.72]0.48[0.42;0.66]0.053 NAA/Choarea0.69[0.62;0.77]0.65[0.53;0.75]0.0880.70[0.66;0.73]0.55[0.40;0.59]<0.0005*0.58[0.49;0.65]0.38[0.37;0.45]0.001* mI/NAAheight0.41[0.33;0.52]0.57[0.45;0.81]<0.0005*0.33[0.29;0.44]0.77[0.50;1.01]<0.0005*0.34[0.24;0.44]0.54[0.41;0.89]0.009* mI/NAAarea0.66[0.48;0.91]0.94[0.80;1.51]0.004*0.56[0.49;0.74]1.02[0.71;1.51]0.002*0.49[0.42;0.79]0.97[0.53;1.37]0.009* Datashownasmedian[IQR]. DOLdayoflife,NAAN-acetyl-aspartate,Crcreatine,Chocholine,mImyo-inositol. *Boldfiguresrepresentsignificantresults(p<0.05).
NAA/Cr height
Metabolite ratio
1.5
1.0
0.5
0.0
Early (DOL 1–3)
H-MRS
Midtime (DOL 4–6)
H-MRS
Late (DOL 7–14)
H-MRS
Metabolite ratio
1.5
1.0
0.5
0.0
Metabolite ratio
2.0
1.5
1.0
0.5
0.0
Early (DOL 1–3)
H-MRS
Midtime (DOL 4–6)
H-MRS
Late (DOL 7–14)
H-MRS
Early (DOL 1–3)
H-MRS
Good outcome Poor outcome Midtime
(DOL 4–6) H-MRS
Late (DOL 7–14)
H-MRS ml/NAA height
ml/NAA area
Fig. 3 H-MRS metabolite ratios showing association with outcome across all postnatal age categories (postnatal days 0–14), categorized by outcome and postnatal age category. Bars represent medians, error bars represent interquartile ranges.mI myo-inositol, NAAN-acetyl aspartate, DOL day of life.
6
the same velocity throughout physiological neuronal maturation13.
The results of our mixed-effect regression model propose that, when outcome is taken into consideration as a covariate, neither gestational age nor postnatal age have a significant effect on NAA/Cr and mI/NAA metabolite ratios. This suggests that the moderate-to-severe hypoxic–ischemic injury has such a definitive impact on brain metabolism (and consequently, metabolite levels and ratios) that the influence of other modifying factors like gestational age or postnatal age disappears.
However, when these associations were analyzed in the good outcome group alone, it was revealed that these metabolite ratios are greatly influenced by gestational age—similar to healthy newborn conditions—represented by a rise in NAA/Cr ratio and a decrease in mI/NAA ratio, as gestational age increases. Addition- ally, in the good outcome group, postnatal age turned out to be a significant covariate, but only for mI/NAA, represented by a decrease in mI/NAA with increasing postnatal age. This might imply that, in case of newborns facing good outcome, the physiological, gestational age-dependent variability of metabolite levels can be observed, despite the HIE (presumably due to having undergone milder neuronal injury). Moreover, in case of mI/NAA, signs of postnatal age-dependent metabolic variability also emerged.
Based on our observation, in the poor outcome group though, the effect of gestational age on metabolite ratios disappeared, suggesting that the more severe metabolic changes caused by a more intense hypoxic–ischemic insult may obscure the physiolo- gical pattern evolution of metabolites. Furthermore, the effect of postnatal age on mI/NAA ratio also vanished, whereas NAA/Cr ratio presented an although significant but slight association with postnatal age.
A number of existing research papers studying H-MRS as a prognostic tool in HIE use various methods for data optimization (e.g., custom made headcoil, absolute quantification sequences, post-processing techniques)14–16. These methods enable the accurate detection and measurement of the lactate (Lac) metabolite peak, making Lac and Lac-derived ratios (Lac/NAA, Lac/Cr, Lac/Cho) also among the most widely analyzed metabo- lites for prediction. While the above listed methods may indeed improve data quality, these methods may not be generally applicable in all clinical settings, especially in those with low resources. Our aim was to assess whether H-MRS is an adequate prognostic tool, as well as to describe the dynamics of conventional H-MRS, throughout the first 14 days of newborns with HIE, for our conclusions to be applicable in every clinical setting. Nevertheless, based on our previous study, Lac peak cannot be accurately detected under conventional conditions, due to high noise levels9. Additionally, it has been previously described that at 3 T and moderate TE (e.g., 144 ms), Lac peak suffers signal
loss and may not be detectable due to anomalous j-coupling17. Also, Wu et al. found that in newborns with moderate and severe HIE, cerebral Lac concentrations peak early in all examined cerebral regions (basal ganglia, thalamus, cortex, and white matter) and, in most cases, fall in the normal range after postnatal days 4–518. Moreover, recent evidence suggests that Lac ceases to be an accurate H-MRS predictor, when analyzed in newborns treated with therapeutic hypothermia, an observation presumably indicating the working mechanism of hypothermic treatment for HIE19,20. Conclusively, for the sake of our initial aim, we excluded Lac from the list of our metabolite ratio candidates.
While NAA and NAA/Cr ratio are extensively studied biomarkers, few studies focus on mI and its significance in HIE21. mI, as a conformation isomer of the pentose sugar inositol, is one of the main osmolites of human cells, as well as an intracellular signal transmitter and precursor molecule for lipid synthesis. During gestation and maturation, its level rises around term (with ongoing myelination), being one of the highest peaks in the neonatal period, and then rapidly decreases with age, reaching its final level around 1 year of age. Being a membrane compound, its level significantly rises after neuronal injuries, suggesting cell death22,23.
Current guidelines for management of HIE recommend the performance of more than one MR examination12, considering that the utility and sensitivity of its various imaging modalities change with the postnatal age of the newborns—conclusively, H-MRS of asphyxiated newborns is also performed at various postnatal ages. Moreover, H-MRS examination of all newborns with HIE in a uniform postnatal narrow age window is not possible, due to the variable clinical stability of neonates with HIE, as well as resource availability. This further emphasizes the importance of detailed description of how postnatal age affects metabolite ratios and, more importantly, their predictive power.
According to our study, it seems that H-MRS examination keeps its outstanding predictive value throughout thefirst 14 days of life in newborns with HIE. Therefore, performing an additional H-MRS sequence whenever a brain MRI examination is done provides valuable additional diagnostic and prognostic information to the clinician.
Limitations
Despite our careful preparation of our study methodology, there are limitations that should be taken into consideration. The general limitation of our study is the lack of healthy, gestational age-specific reference data from thefirst 2 weeks of the neonatal period. However, this would be an unrealistic expectation, from both ethical and methodological reasons, and theoretically, this missing referential data is not indispensable for prognostication.
The other limitation is the retrospective nature of the study. On the one hand, this is a limitation compared to a prospective study Table 4. Results of Mann–WhitneyUtest comparison of metabolite ratios and outcome, across postnatal age categories at H-MRS scan, as well as receiver-operating characteristics (ROC) analysis of metabolite ratios.
Early H-MRS (DOL 1–3) Midtime H-MRS (DOL 4–6) Late H-MRS (DOL≥7)
AUC Cutoff SENS SPEC AUC Cutoff SENS SPEC AUC Cutoff SENS SPEC
NAA/Cr height 0.807 0.96 81.8% 70.2% 0.871 0.95 81.1% 84.6% 0.963 0.83 88.9% 88.9%
NAA/Cr area 0.733 0.99 70.5% 68.1% 0.65 0.69 97.3% 46.2% 0.895 0.78 94.4% 77.8%
NAA/Cho height 0.601 0.85 77.3% 48.9% 0.63 0.69 86.5% 53.8% 0.735 0.54 88.9% 66.7%
NAA/Cr area 0.604 0.59 84.1% 42.6% 0.84 0.65 78.4% 84.6% 0.883 0.45 94.4% 77.8%
mI/NAA height 0.719 0.42 59.0% 82.6% 0.897 0.37 63.6% 99.9% 0.816 0.42 73.7% 75.0%
mI/NAA area 0.683 0.80 69.2% 72.7% 0.818 0.85 84.8% 70.0% 0.816 0.93 99.9% 62.5%
AUCarea under ROC curve,SENSsensitivity,SPECspecificity.
7
with fine-tuned imaging and clinical parameters for research purposes; however, on the other hand, this could be viewed as a strength from a clinical point of view, having relied on data obtainable from any MR facility dealing with asphyxiated neonates, thus being more generalizable. Furthermore, due to resource availability, two different 3 Tesla MRI scanners were used to examine our patient population. While this might bias the acquired spectral data, this technical issue is counteracted by the identical magneticfield strength of the scanners, as well as our assessment of metabolite ratios instead of absolute metabolite levels. Our results could also be biased by the uneven sample sizes of our patient groups, which may decrease the accuracy of our statistical analysis. Another potential limitation might be the fact that a large number of patients were unavailable to follow-up and had to be excluded from the outcome analysis. However, clinical parameters of surviving newborns lost to follow-up did not differ significantly from those with follow-up results (data not shown), therefore a systematic bias is unlikely. Moreover, the establish- ment of postnatal age categories by itself, for analysis of prognostic performance of HMRS, can be considered a limitation, since it inevitably creates artificial conditions. While assessment of postnatal age at scan in considerably smaller age categories (i.e., 6 or 12-h periods) or as a continuous variable would be less artificial and more accurate approach to determine predictive value during the examined postnatal period, that would require such a large sample size that might only be feasible in a future multicenter study. Therefore, prompted by our results, we seek to outline and conduct such a future study in a larger population and on other vendors’MR scanner, as well as to compare the predictive value for 2-year neurological outcome with that for longer-term (i.e., 7 and 14 years of age) neurodevelopmental outcome, in order to refine and optimize the prognostic power of conventional H-MRS.
CONCLUSION
In summary, we propose that conventional brain H-MRS examination has consistently high prognostic value for metabolite ratios NAA/Cr and mI/NAA throughout thefirst 2 postnatal weeks of newborns with HIE, with the highest predictive power between postnatal days 7–14. Moreover, actual metabolite ratios show the strongest association with the long-term outcome and are not overall significantly affected by gestational age and postnatal age.
This implies that, while assessed separately in the outcome groups, gestational age and postnatal age-dependent metabolite variations do appear, and these are strongly outweighed by the consequential outcome, presumably determined by severity of insult.
REFERENCES
1. Mcintyre, S., Badawi, N., Blair, E. & Nelson, K. B. Does aetiology of neonatal encephalopathy and hypoxic-ischaemic encephalopathy influence the outcome of treatment?Dev. Med. Child Neurol.57, 2–7 (2015).
2. Hassell, K. J., Ezzati, M., Alonso-Alconada, D., Hausenloy, D. J. & Robertson, N. J.
New horizons for newborn brain protection: enhancing endogenous neuropro- tection.Arch. Dis. Child. Fetal Neonatal Ed.100, F541–F552 (2015).
3. Hankins, G. D. V. & Speer, M. Defining the pathogenesis and pathophysiology of neonatal encephalopathy and cerebral palsy. Obstet. Gynecol.102, 628–636 (2003).
4. Lally, P. J. et al. Magnetic resonance spectroscopy assessment of brain injury after moderate hypothermia in neonatal encephalopathy: a prospective multicentre cohort study.Lancet Neurol.18, 35–45 (2019).
5. Thayyil, S. et al. Cerebral magnetic resonance biomarkers in neonatal encepha- lopathy: a meta-analysis.Pediatrics125, e382–e395 (2010).
6. Shibasaki, J. et al. Changes in brain metabolite concentrations after neonatal hypoxic-ischemic encephalopathy.Radiology288, 840–848 (2018).
7. Urbanik, A., Cichocka, M., Kozub, J., Karcz, P. & Herman-Sucharska, I. Evaluation of changes in biochemical composition of fetal brain between 18th and 40th gestational week in proton magnetic resonance spectroscopy.J. Matern. Fetal Neonatal Med.32, 2493–2499 (2019).
8. Azzopardi, D. et al. The TOBY Study. Whole body hypothermia for the treatment of perinatal asphyxial encephalopathy: a randomised controlled trial.BMC Pediatr.
8, 17 (2008).
9. Barta, H. et al. Prognostic value of early, conventional proton magnetic resonance spectroscopy in cooled asphyxiated infants.BMC Pediatr. 18, 302 (2018).
10. Shalak, L. F., Laptook, A. R., Velaphi, S. C. & Perlman, J. M. Amplitude-integrated electroencephalography coupled with an early neurologic examination enhances prediction of term infants at risk for persistent encephalopathy.Pediatrics111, 351–357 (2003).
11. Bottomley, P. A. The trouble with spectroscopy papers.Radiology181, 344–350 (1991).
12. The American Academy of Pediatrics. The American College of Obstetricians and Gynecologists. Executive summary: Neonatal Encephalopathy and Neurologic Outcome, Second Edition.Obstet. Gynecol.123, 896–901 (2014).
13. Kok, R. D., van den Berg, P. P., van den Bergh, A. J., Nijland, R. & Heerschap, A.
Maturation of the human fetal brain as observed by 1H MR spectroscopy.Magn.
Reson. Med.48, 611–616 (2002).
Table 5. Effect of gestational age, postnatal age, and neurological outcome on metabolite dynamics during thefirst 14 days of life.
NAA/Cr height mI/NAA height
Coefficient 95% CI pvalue Coefficient 95% CI pvalue
General
(Intercept) 0.4522 (−0.3335, 1.2379) 0.2574 1.1115 (−0.2324, 2.4553) 0.1043
Gestational age (weeks) 0.0162 (−0.0038, 0.0362) 0.1115 −0.0177 (−0.0519, 0.0165) 0.3086
Postnatal age (days) −0.0450 (−0.1015, 0.0114) 0.1148 −0.0467 (−0.1224, 0.0291) 0.2209
Poor outcome −0.2277 (−0.2883,−0.1672) 0.0000* 0.3167 (0.2125, 0.4208) 0.0000*
Good outcome group
(Intercept) −0.1929 (−1.0761, 0.6902) 0.6656 1.8131 (1.1285, 2.4978) 0.0000
Gestational age (weeks) 0.0320 (0.0095, 0.0545) 0.0058* −0.0346 (−0.0521,−0.0171) 0.0002*
Postnatal age (days) −0.0038 (−0.0723, 0.0646) 0.9088 −0.1047 (−0.1601,−0.0494) 0.0007*
Poor outcome group
(Intercept) 0.7541 (−0.5712, 2.0795) 0.2600 0.5655 (−2.3818, 3.5128) 0.7025
Gestational age (weeks) 0.0032 (−0.0310, 0.0374) 0.8513 0.0039 (−0.0723, 0.0802) 0.9182
Postnatal age (days) −0.0958 (−0.1824,−0.0091) 0.0319* 0.0151 (−0.1133, 0.1435) 0.8083 Results of mixed-effect regression models are shown, presented overall in the whole study population and separately in the good and poor outcome groups.
95% CIconfidence interval (at 95% confidence level).
*Boldfigures represent significant results (p< 0.05).
8
14. Cheong, J. L. Y. et al. Proton MR spectroscopy in neonates with perinatal cerebral hypoxic-ischemic injury: metabolite peak-area ratios, relaxation times, and absolute concentrations.AJNR Am. J. Neuroradiol.27, 1546–1554 (2006).
15. Alderliesten, T. et al. MRI and spectroscopy in (near) term neonates with perinatal asphyxia and therapeutic hypothermia.Arch. Dis. Child. Fetal Neonatal Ed.102, F147–F152 (2017).
16. van Doormaal, P. J., Meiners, L. C., ter Horst, H. J., van der Veere, C. N. & Sijens, P. E.
The prognostic value of multivoxel magnetic resonance spectroscopy determined metabolite levels in white and grey matter brain tissue for adverse outcome in term newborns following perinatal asphyxia.Eur. Radiol.22, 772–778 (2012).
17. Lange, T. et al. Pitfalls in lactate measurements at 3T.AJNR Am. J. Neuroradiol.27, 895–901 (2006).
18. Whu, T. W. et al. Cerebral lactate concentration in neonatal hypoxic-ischemic encephalopathy: in relation to time, characteristic of injury, and serum lactate concentration.Front. Neurol.11, 293 (2018).
19. Sijens, P. E., Wischniowsky, K. & ter Horst, H. J. The prognostic value of proton magnetic resonance spectroscopy in term newborns treated with therapeutic hypothermia following asphyxia.Magn. Reson. Imaging42, 82–87 (2017).
20. Erecinska, M., Thoresen, M. & Silver, I. A. Effects of hypothermia on energy metabolism in mammalian central nervous system.J. Cereb. Blood Flow Metab.
23, 513–530 (2003).
21. Robertson, N. J. et al. Early increases in brain myo-inositol measured by proton magnetic resonance spectroscopy in term infants with neonatal encephalopathy.
Pediatr. Res.50, 692–700 (2001).
22. Macrì, M. A. et al. Regional changes in the metabolite profile after long-term hypoxia-ischemia in brains of young and aged rats: a quantitative proton MRS study.Neurobiol. Aging27, 98–104 (2006).
23. Brighina, E., Bresolin, N., Pardi, G. & Rango, M. Human fetal brain chemistry as detected by proton magnetic resonance spectroscopy. Pediatr. Neurol. 40, 327–342 (2009).
ACKNOWLEDGEMENTS
We thank Laszlo Szakacs for his expert help with statistical analysis, as well as Gyula Gyebnar and the MR operators for the technical help with the H-MRS acquisition protocol. We also thank the medical and nursing team at the NICU of the 1st Department of Paediatrics, Semmelweis University for the professional care. H.B. and A.J. were supported by the Higher Education Institutional Excellence Program of the Ministry for Innovation and Technology in Hungary, within the framework of the Neurology thematic program of the Semmelweis University. H.B. was also supported by the ÚNKP-20-4-I New National Excellence Program of the Ministry for Innovation and Technology from the source of the National Research, Development and Innovation Fund (ÚNKP-20-4-I-SE-8). A.J. was also supported by the Hungarian Academy of Science, Premium Postdoctoral Fellowship (PPD460004). Neither funding source had any role in the design of the study, collection and analysis of data, and decision to publish.
AUTHOR CONTRIBUTIONS
H.B. acquired clinical and radiological patient information and finalized and interpreted the analysis of data, as well as drafted the manuscript. A.J. participated
in the conception of the study, outlined the statistical analysis, and critically revised the statistical analysis and the manuscript language. L.K. and N.S. participated in the acquisition and interpretation of H-MRS data. G.R. contributed to the outline of the methods and aims of the study and participated in the analysis and interpretation of results. M.S. was responsible for the conception and analysis and interpretation of data for the work. All authors read and approved thefinal manuscript.
FUNDING
Open access funding provided by Semmelweis University.
COMPETING INTERESTS
The authors declare no competing interests.
PATIENT CONSENT
Consent was obtained from parents/legal guardians of all newborns participating in our study. Ethical permission for the analysis was obtained from the Scientific and Medical Research Council Ethics Committee of Hungary (11790-2/2016/EKU).
ADDITIONAL INFORMATION
Supplementary informationThe online version contains supplementary material available athttps://doi.org/10.1038/s41390-021-01626-z.
Correspondenceand requests for materials should be addressed to Hajnalka Barta.
Reprints and permission information is available at http://www.nature.com/
reprints
Publisher’s noteSpringer Nature remains neutral with regard to jurisdictional claims in published maps and institutional affiliations.
Open AccessThis article is licensed under a Creative Commons Attribution 4.0 International License, which permits use, sharing, adaptation, distribution and reproduction in any medium or format, as long as you give appropriate credit to the original author(s) and the source, provide a link to the Creative Commons license, and indicate if changes were made. The images or other third party material in this article are included in the article’s Creative Commons license, unless indicated otherwise in a credit line to the material. If material is not included in the article’s Creative Commons license and your intended use is not permitted by statutory regulation or exceeds the permitted use, you will need to obtain permission directly from the copyright holder. To view a copy of this license, visithttp://creativecommons.
org/licenses/by/4.0/.
© The Author(s) 2021
9