A Spitzer Survey for Dust-Obscured Supernovae
Ori D. Fox
1,2, Harish Khandrika
1, David Rubin
3, Chadwick Casper
4,5, Gary Z. Li
4,6, Tamás Szalai
7,8, Lee Armus
9, Alexei V. Filippenko
4,10, Michael F. Skrutskie
11, Lou Strolger
1, Schuyler D. Van Dyk
91Space Telescope Science Institute, 3700 San Martin Drive, Baltimore, MD 21218, USA.
2ofox@stsci.edu.
3Department of Physics and Astronomy, University of Hawai‘i at M ¯anoa, Honolulu, Hawai‘i 96822, USA.
4Department of Astronomy, University of California, Berkeley, CA 94720-3411, USA.
5Glint Photonics, 1520 Gilbreth Rd., Burlingame, CA 94010, USA.
6The Aerospace Corporation, 2310 E. El Segundo Blvd., El Segundo, CA 90245, USA.
7Department of Optics and Quantum Electronics, University of Szeged, H-6720 Szeged, Dóm tér 9, Hungary.
8Konkoly Observatory, Research Centre for Astronomy and Earth Sciences, H-1121 Budapest, Konkoly Thege Miklós út 15-17, Hungary.
9IPAC, Caltech, 1200 E. California Blvd., Pasadena, CA 91125, USA.
10Miller Institute for Basic Research in Science, University of California, Berkeley, CA 94720, USA.
11Department of Astronomy, P.O. Box 3818, University of Virginia, Charlottesville, VA 22903-0818, USA.
13 July 2021
ABSTRACT
Supernova (SN) rates serve as an important probe of star-formation models and initial mass functions. Near-infrared seeing-limited ground-based surveys typically discover a factor of 3–10 fewer SNe than predicted from far-infrared (FIR) luminosities owing to sensitivity limitations arising from both a variable point-spread function (PSF) and high dust extinction in the nuclear regions of star-forming galaxies. This inconsistency has potential implications for our understanding of star-formation rates and massive-star evolution, particularly at higher redshifts, where star-forming galaxies are more common. To resolve this inconsistency, a successful SN survey in the local universe must be conducted at longer wavelengths and with a space-based telescope, which has a stable PSF to reduce the necessity for any subtraction algorithms and thus residuals. Here we report on a two-yearSpitzer/IRAC 3.6𝜇m survey for dust-extinguished SNe in the nuclear regions of forty luminous infrared galaxies (LIRGs) within 200 Mpc. The asymmetric Spitzer PSF results in worse than expected subtraction residuals when implementing standard template subtraction. Forward-modeling techniques improve our sensitivity by several∼1.5 magnitudes. We report the detection of 9 SNe, five of which were not discovered by optical surveys. After adjusting our predicted rates to account for the sensitivity of our survey, we find that the number of detections is consistent with the models. While this search is nonetheless hampered by a difficult-to-model PSF and the relatively poor resolution ofSpitzer, it will benefit from future missions, such asRomanand JWST, with higher resolution and more symmetric PSFs.
Key words: supernovae: general — dust, extinction — infrared: stars
1 INTRODUCTION
The observed rate at which stars more massive than∼8 Mex- plode as core-collapse supernovae (CCSNe) can be used to deter- mine chemical evolution and feedback processes (Matteucci et al.
2006;Scannapieco & Bildsten 2005), progenitor-mass distributions (Smith et al. 2011), star-formation rates (Iben 1983;Mannucci et al.
2007), and dust yields (Maiolino et al. 2004a,b;Rho et al. 2009).
Given the intrinsic brightness of SNe, they serve as useful probes of the above characteristics at higher redshifts where other techniques
are less feasible (e.g.,Dahlén & Fransson 1999;Dahlen et al. 2004;
Strolger et al. 2015).
SN rates are useful probes, however, only if we understand the models linking the initial mass function (IMF), star-formation rates (SFRs), and SNe. For example,Mattila & Meikle(2001) derive the expected CCSN rate (CCSNr) as a function of a galaxy’s far-infrared (FIR) luminosity,𝐿FIR=𝐿
(8−1000)𝜇m (which is used as a proxy for star formation):
CCSNr= 2.7𝐿FIR 1010L
SN(100 yr)−1. (1)
arXiv:2106.09733v2 [astro-ph.HE] 12 Jul 2021
Figure 1.The effects of dust on the intensity and shape of a blackbody spectrum. The SED here is that of a 5000 K blackbody assumed to represent the photosphere of a SN IIP several months post-explosion. The 3.6𝜇m flux is normalised to𝑀 =−16 mag Vega (see Fig.2). Since more absorption occurs at shorter wavelengths, the peak of the spectrum shifts beyond the NIR (i.e., 2.6𝜇m) as𝐴𝑉increases beyond 25 mag.Spitzeris more efficient thanHSTat these higher extinction levels.
While Equation1is an empirical relationship,Mattila & Meikle (2001) derive a similar relation (their Eq. 5) from first principles and show that Equation1both has a basis in and is consistent with the theoretical connection between the FIR luminosity and SFR.
Mattila et al.(2012) add that this empirical relationship could have a significant uncertainty owing to a small sample size. We further note that the theoretically derived relationship also has significant uncertainty since it assumes a scaling factor between the intrinsic FIR-specific luminosity and the SFR, with no correction for extinc- tion or other effects1, of about𝜅FIR≈4×10⁻¹⁰Myr−1L−1 . This is about twice as large as the value determined for dusty galaxies by Madau & Dickinson(2014) andKennicutt(1998), at ages of above around 300 Myr.2The derivation also assumes the fraction of stars ultimately successful in producing CCSNe is 𝑘 ≈ 0.007 M−1. This value is ∼ 30% larger than estimated for average galaxies by Strolger et al. (2015), but also carries some assumptions on progenitor mass ranges an/d average shape of the high-mass IMF.
Considering the relationship between all of these variables, the observed CCSNr therefore gives a useful constraint on the model by providing some leverage on our theoretical understanding of𝑘 and𝜅FIR.
The ability to detect all CCSNe in a survey limits the com- pleteness of any rate study. This is particularly true in galaxies with high SFRs, where gas and dust obscure many CCSNe. In fact, optical-wavelength surveys in dusty, star-forming (ultra)-luminous IR galaxies (LIRGs and ULIRGs) have routinely established CC- SNr values that are unexpectedly similar to those in more normal galaxies (Richmond et al. 1998;Navasardyan et al. 2001).Strolger
1 This includes the an unknown efficiency in reprocessing UV radiation from stars into dust emission in the far-IR, which for starbursts with high optical depths is around 100%.
2 Younger galaxies (. 300 Myr) have higher emission-to-star-formation ratios as short-lived massive stars still dominate UV emission that is repro- cessed and re-emitted in the IR.
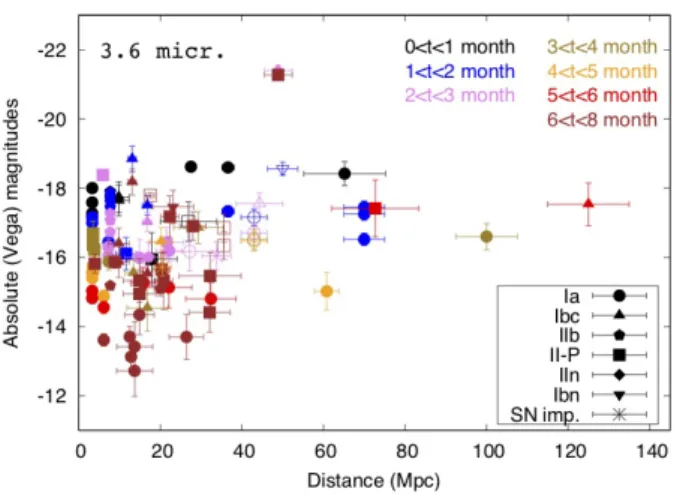
Figure 2.Early-time MIR evolution of all historical SNe obtained from Spitzerarchival data bySzalai et al.(2019). Filled and open symbols denote SNe where photometry was obtained with or without image subtraction, respectively. SN subtypes (e.g.,Filippenko 1997) are denoted in the legend, and “SN imp" refers to SN impostors.
et al.(2015) derive the CCSNr from theHubble Space Telescope (HST)CANDELS and CLASH programs, two extragalactic mul- ticycle treasury programs using the WFC3 IR channel with sensi- tivities down to 25.5 magVegaout to 1.6𝜇m. The observations are notably different from the ultraviolet (UV)/optical SFR (Madau &
Dickinson 2014), and even less so with the mid-IR (MIR) and FIR predictions (Chary & Elbaz 2001).Strolger et al.(2015) link the low CCSNr (and the subsequent source of discrepancy between the UV/optical and IR-derived SFRs) to dust obscuration, particularly in galaxies with high SFRs, where gas and dust obscure most of the SNe, in agreement withMattila et al.(2012).
The highest SFRs in the local Universe are found in LIRGs and ULIRGs (𝐿FIR>1011Land 1012L, respectively;Sanders et al.
2003). Although one must account for the contribution from hidden active galactic nuclei (AGNs), star formation tends to contribute most of the IR luminosity (Sanders & Mirabel 1996;Genzel et al.
1998), and estimates of the relative AGN power have been made using a variety of MIR tracers in hundreds of local IR galaxies (e.g., Díaz-Santos et al. 2017). (U)LIRGs account for only a small fraction of the local (<100 Mpc) galaxy population (Sanders et al. 2003), so obscuration in these galaxies does not have a detrimental effect onlocalCCSNr studies. At higher redshifts, however, obscured star formation in (U)LIRGsdominatesover star formation traced by UV and optical light (e.g., Floc’h et al. 2005;Magnelli et al. 2009, 2011;Strolger et al. 2015). To accurately measure the CCSNr as a function of redshift, the local CCSNr in starburst galaxies, such as (U)LIRGs, must be fully characterised.
The IR, which can be up to 10 times less affected by ex- tinction than visible light, offers an optimised window for SN searches in these starburst galaxies. Already, a number of near-IR (NIR) searches have been performed with mixed success. Early NIR ground-based surveys were hampered by poor resolution and limited telescope time (van Buren & Greenhouse 1994;Grossan et al. 1999;
Maiolino et al. 2002;Mannucci et al. 2003;Mattila et al. 2004;Mat- tila et al. 2005a,b;Miluzio et al. 2013). These studies resulted in an inferred CCSNr that was still a factor of 3–10 lower than expected from the SFR (Mannucci et al. 2003). Furthermore, no SNe were detected within the galaxy nuclei. Ground-based high-resolution adaptive optics (AO) NIR searches have had some additional suc- cess in their discovery of several CCSNe within<300 pc from the
Table 1.Target Galaxies
Name RA (J2000) Dec (J2000) Distance 𝐿FIR # of SNe # of SNe Detections
(Mpc) (log L) (Corrected)
NGC 34 00:11:06.612 -12:06:28.33 83.33 11.43 1.45 0.42 0
NGC 232 00:42:45.814 -23:33:40.69 91.66 11.23 0.92 0.28 0
MCG+12-02-001 00:54:03.943 +73:05:05.23 66.67 11.29 1.05 0.71 0
IC 1623 01:07:47.2 -17:30:25 79.17 11.38 1.30 0.35 0
UGC 2369 02:54:00.9 +14:58:31 129.17 11.44 1.49 0.09 0
IRAS 03359+1523 03:38:46.9 +15:32:55 145.83 11.38 1.30 0.04 1
MCG-03-12-002 04:21:20.0 -18:48:45 133.33 11.30 1.08 0.05 0
NGC 1572 04:22:42.814 -40:36:03.50 83.33 11.16 0.78 0.34 0
NGC 1614 04:34:00.027 -08:34:44.57 66.67 11.41 1.39 0.56 0
NGC 2623 08:38:24.093 +25:45:16.70 75.00 11.47 1.59 0.82 0
UGC 4881 09:15:55.54 +44:19:58.2 166.67 11.57 2.01 0.01 0
UGC 5101 09:35:51.694 +61:21:10.52 162.50 11.90 4.29 0.02 0
MCG+08-18-012 09:36:30.7 +48.28:10 108.33 11.19 0.84 0.14 0
IC 563/IC 564 09:46:20.361 +03:02:43.86 83.33 11.10 0.68 0.29 1
NGC 3110 10:04:02.124 -06:28:29.12 66.67 11.10 0.68 0.44 0
NGC 3256 10:27:51.60 -43:54:18.0 37.50 11.44 1.49 1.25 1
IRAS 10565+2448 10:59:18.153 +24:32:34.30 175.00 11.87 4.00 0.03 0
Arp 148 11:03:53.892 +40:50:59.89 141.67 11.50 1.71 0.06 1
MCG+00-29-0023 11:21:12.261 -02:59:03.00 100.00 11.36 1.24 0.26 0
IC 2810/UGC 6436 11:25:45.055 +14:40:35.98 141.67 11.50 1.71 0.06 0
NGC 3690 11:28:33.13 +58:33:58.0 45.83 11.72 2.83 0.24 0
ESO507-G070 13:02:52.354 -23:55:17.65 87.50 11.31 1.10 0.39 0
UGC 8335 13:15:32.8 +62:07:37 129.17 11.60 2.15 0.06 0
UGC 8387 13:20:35.380 +34:08:21.84 95.83 11.52 1.79 0.23 0
NGC 5256 13:38:17.69 +48:16:33.9 112.50 11.37 1.27 0.16 0
NGC 5257 13:39:52.273 +00:50:22.48 91.67 11.37 1.27 0.40 1
Mk 273 13:44:42.070 +55:53:13.17 158.33 12.10 6.80 0.08 0
NGC 5331 13:52:16.15 +02:06:03.3 137.50 11.43 1.45 0.06 0
UGC 8782 13:52:17.7 +31:26:44 187.50 12.27 10.06 0.00 0
Arp 302 14:57:00.4 +24:36:44 141.67 11.59 2.10 0.05 0
Mk 848 15:18:06.123 +42:44:44.59 166.67 11.72 2.83 0.03 0
Arp 220 15:34:57.272 +23:30:10.48 75.00 12.12 7.12 3.52 0
NGC 6090 16:11:40.39 +52:27:21.5 120.83 11.35 1.21 0.11 1
NGC 6240 16:52:58.97 +02:24:01.7 100.00 11.85 3.82 0.65 2
IRAS 17208-0014 17:23:21.943 -00:17:00.96 179.17 12.30 10.77 0.05 0
IC 4687/86 18:13:39.829 -57:43:31.25 70.83 11.35 1.21 0.68 0
IRAS 18293-3413 18:32:40.2 -34:11:26 75.00 11.63 2.30 0.97 1
NGC 6926 20:33:06.108 -02:01:39.07 83.33 11.11 0.70 0.29 0
NGC 7130 21:48:19.490 -34:57:04.73 66.67 11.21 0.88 0.48 0
IRAS 23128-5919 23:15:46.772 -59:03:15.94 183.33 11.80 3.41 0.01 0
LIRG nuclei (e.g.Mattila et al. 2007;Kankare et al. 2008,2012;
Kool et al. 2018;Kankare et al. 2021;Pérez-Torres et al. 2021).Kool et al.(2018) note their high-spatial-resolution search uncovered a larger concentration of nuclear SNe in (U)LIRGs than previous low-resolution searches, whileKankare et al.(2021) showed that a sample of 29 CCSNe at<2.5 kpc from (U)LIRG nuclei showed a correlation between the startburst age and SN subtype. In general, these gorund-based surveys either did not find their rates consistent with the predictions or had limited statistics. The overall conclu- sion was that a majority of SNe likely occur within the nuclei, but the extinction is so high (𝐴𝑉 > 25 mag) and the nuclei are so bright that longer-wavelength observations are necessary. Even several space-based surveys (e.g.,Bregman et al. 2000), including aHST/NICMOS (Cresci et al. 2007), turned up no confirmed de- tections, concluding that the ULIRG dust-extinction values are too high (𝐴𝑉 >25 mag). Results from the SPitzer InfraRed Intensive Transients Survey (SPIRITS;Kasliwal et al. 2017) between 2014 and 2018 find the fraction of CCSNe in nearby galaxies missed by optical surveys could be as high as 38.5% (Jencson et al. 2019).
High-resolution ground-based radio surveys, by contrast, have suc-
cessfully discovered nuclear SNe with rates consistent with the galaxy IR luminosities, but not all SNe are sufficiently bright at radio wavelengths to conduct a complete survey (Pérez-Torres et al.
2021).
Until theJames Webb Space Telescope (JWST)is launched, the Spitzer Space Telescope (Spitzer)Infrared Array Camera (IRAC;
Fazio et al. 2004) offered the best combination of long-wavelength sensitivity, stable point-spread function (PSF), moderate resolution, and sensitivity to SN radiation. Here we describe a post-cryogenic Warm-Spitzer/IRAC survey conducted in the years 2012–2014 for dust-extinguished SNe in, but not limited to, the nuclear regions of nearby star-forming (U)LIRGs (PID 90031; PI: O. Fox). (A similar, but more limited survey was conducted during the cryogenicSpitzer mission byLawrence & Gautier 2004, PID 108; however, the data analysis and results were never published.) The MIR is optimised for dust-extinction levels𝐴𝑉 >25 mag. The improved sensitivity offers an improved estimate of the number of SNe missed by visible (and NIR) surveys and tighter constraints on our understanding of star-formation models out to high redshifts. The direct product of this study is the connection between FIR luminosity and massive-
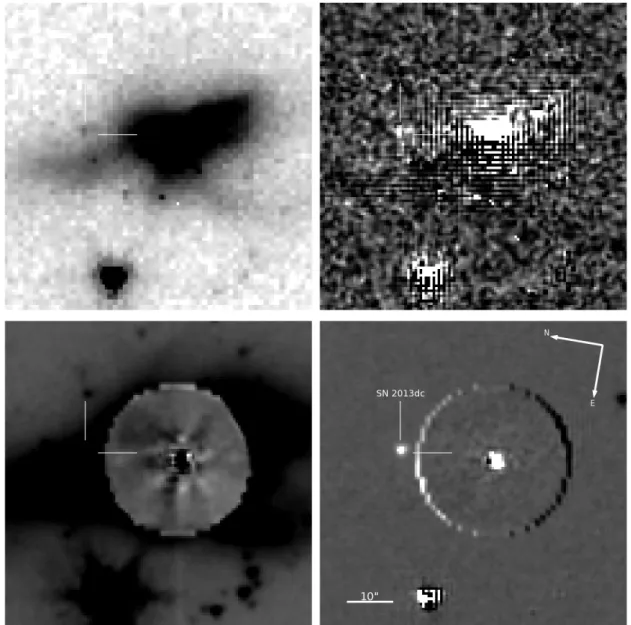
Figure 3.Comparison of sample data products, in this case for the first epoch of NGC 6240, used in our transient search. (Top left:) Original, unsubtracted MOPEX processed data. (Top right:) Standard alignment and subtraction of two epochs. (Bottom left:) Forward modeling subtraction, where the circle corresponds to our forward modeling radius. (Bottom right:) Subtraction of two epochs that have been forward modeled, but in this case are spaced nearly one year apart so that the telescope roll angle is similar. The colour scale and stretch is constant for all subtracted images shown in this figure. The point source is SN 2013dc. It is present in all the images, but is most clearly detected in the bottom right. The central source is the galaxy nucleus. As described in the text, there are a number of caveats for modeling the inner core, including nonlinearity concerns. Correcting those issues is beyond the scope of this paper, but we account for them in our statistics.
star formation. Such results naturally connect to the high-redshift universe, where a fundamental observable is the FIR galactic flux.
Given a future which includes the LSST,EUCLID, theNancy Grace Roman Space Telescope (NGRST), andJWST, local measurements characterising the properties of galaxies selected from FIR samples have large-scale implications.
Our observations are presented in Section 2. Section3 de- scribes the data reduction, data processing, and analysis techniques.
Our results are discussed in Section4, and Section5summarises our conclusions.
2 OBSERVATIONS
The original proposal called for a Warm-Spitzer/IRAC survey of 40 galaxies to maximise the number of expected SNe and generate a statistically significant sample to minimise the statistical effects of undetected SNe. We selected the nearest 40 (U)LIRGs (𝐿FIR>
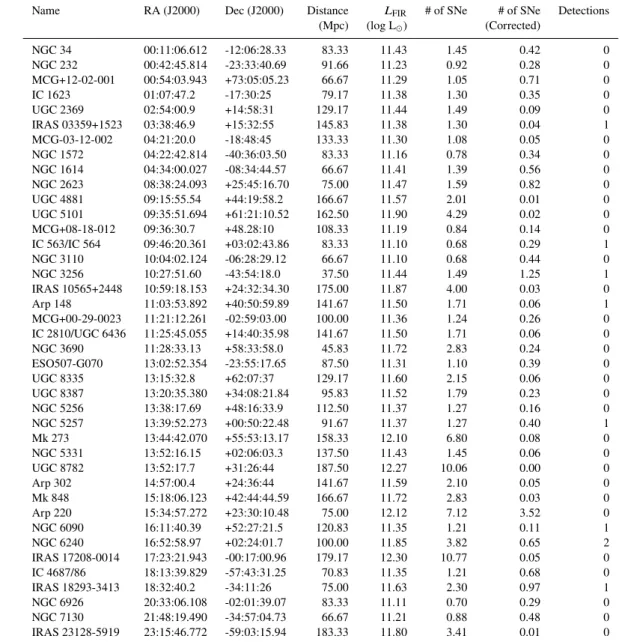
1010L) fromSanders et al.(2003), which ultimately extended our sample out to 200 Mpc. Table1summarises the targets and also lists the number of SNe predicted by Equation1over the two-year survey window. For each galaxy, eight epochs of observations were obtained, spaced approximately 1–6 months apart depending on the visibility window.
To minimise observing time, all observations were obtained in only a single filter with IRAC Channel 1 (3.6𝜇m). The spectral en-
Figure 4. A residual map of UGC 8782 illustrating complications and limitations of our algorithm to detect interconnected groups of pixels within a given epoch with fluxes&3𝜎of their average value. The original image has the forward model subtracted, resulting in the ringed structure corresponding to the model itself. The color scale units are𝜎, defined by the statistics of each individual pixel across all eight epochs. The poorly subtracted nuclear region in this example is typical of many of the targets in our sample for a variety of issues beyond forward modeling that we describe and account for in the text.
ergy distribution (SED) for a 5000 K blackbody peaks at>2.0𝜇m for𝐴𝑉 >25 mag (Fig.1). Increasing the extinction pushes the peak of the SED to longer wavelengths, but also lowers the overall flux substantially enough that it becomes inefficient to observe these targets at larger distances. Channel 1 (3.6𝜇m) is also slightly more sensitive than Channel 2 (4.5𝜇m). These are the only two chan- nels available during the Warm-Spitzermission and, at the time of the survey,Spitzer/IRAC was the only MIR observing capabilities accessible from space.
To calculate our integration times, we consider the distribu- tion of CCSN magnitudes. MIR light curves of CCSNe are sparse, butSzalai et al.(2019) present comprehensive plots of all existing Spitzerobservations. Figures 6 and 7 fromSzalai et al.(2019) show that CCSNe plateau in the MIR for∼300 days post-explosion, and often even longer. Figure2plots the photometry as a function of distance, separated by explosion type and age. A majority of CC- SNe fall within a range of−16 < 𝑀3.6𝜇 𝑚 < −18 over the first few months. Most of these SNe are at distances<60 Mpc, since the proposedSpitzerobservations generally targeted nearby, bright SNe.
Given that the typical time between consecutive observations is anywhere in the range 1–6 months, we assumed a magnitude of 𝑀3.6𝜇 𝑚 ≈ −17 when designing our observations. In general, photon-counting statistics from the underlying galaxy dominate the uncertainty, and we therefore require longer integration times. We also account for possible extinction ranging up to 𝐴𝑉 = 35 mag.
Figure1shows the effects of extinction by plotting the SED for a 5000 K blackbody for various values of𝐴𝑉. At 3.6𝜇m, the effects of extinction are minimal, decreasing the brightness only∼2 mag for 𝐴𝑉 =45 mag. Despite this planning, however, subtraction effects ultimately dominated our error budget, which we discuss in more detail below.
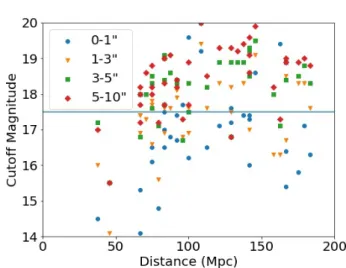
Figure 5.Sensitivity of our search algorithm derived from the artificial source tests for each galaxy as a function of the galaxy distance. Each galaxy in our sample has four data points, corresponding to recovery rates for artificial sources placed at various radii from the nucleus as defined by the legend. The detection limit, or cutoff magnitude, is defined as the magnitude at which we can achieve a 50% recovery rate for all of our sources. The solid line corresponds to the more realistic empirical cutoff magnitude derived qualitatively from Figure10, as we discuss in the text. Figure6plots the consolidated results for all galaxies shown in this plot.
3 REDUCTION TECHNIQUES 3.1 Forward Modeling and Subtraction
Despite the absence of atmospheric effects when working with im- ages taken by space telescopes, there are three features of theSpitzer data that combine to make precise galaxy subtraction difficult. (1) The PSF is undersampled (only∼1 pixel per full width at half- maximum intensity). (2) The PSF is highly azimuthally asymmetric.
(3) The data are taken over a range of spacecraft roll angles, with no two epochs matching exactly. To enable precise galaxy subtraction, we turn to forward modeling.
Forward modeling infers an analytic galaxy model on the sky by tracing the light (“forward”) through convolution with the PSF and pixel, and then sampling by the detector (e.g.,Holtzman et al.
2008;Suzuki et al. 2012;Hayden et al. 2021;Rubin et al. 2021).
Each of the epochs is fit simultaneously with a model of the galaxy background plus SN. This model is inferred using a set of dithers and/or rotations, bypassing the traditional step of resampling the im- ages for pixel-by-pixel subtraction, which would introduce artifacts.
In testing, we found that the given model of the Point Response Function3(PRF, the covolution of the PSF and the pixel response) was not accurate enough for our purposes, so we derived our own PRF from high signal-to-noise-ratio observations of field stars.
For each of the eight epochs in which a search is performed, the forward model is derived from reference observations of the galaxy obtained before the SN appears or after the SN fades. In other words, we exclude observations obtained<20 days prior or
>330 days to account for the possibility that a rising/falling SN component may contribute to the model. In addition to the galaxy model, we also fit small tweaks to the astrometry and differences
3 https://irsa.ipac.caltech.edu/data/SPITZER/docs/irac/calibrationfiles/psfprf/
10 12 14 16 18 20 Magnitude
0 20 40 60 80 100
Percent Recovered
0-1 arcseconds 1-3 arcseconds 3-5 arcseconds 5-10 arcseconds
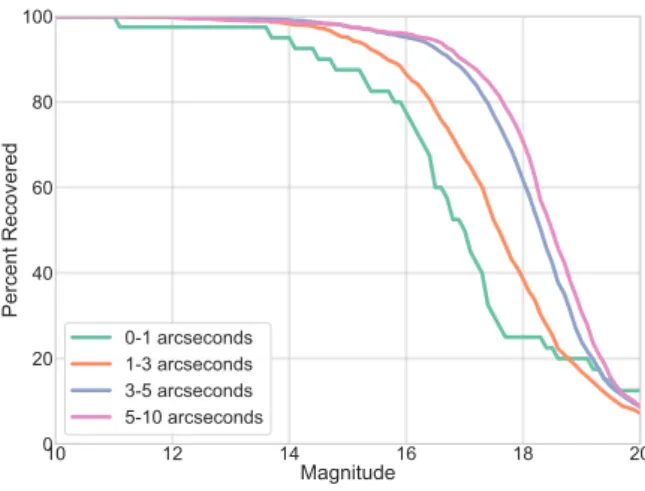
Figure 6.Overall detection rate as a function of radius from the galactic nucleus for forward model subtracted images based on artificial star tests
.
in the sky level. Once a model is generated, it is subtracted from each corrected Basic Calibrated Data (cBCD) file, which are then stacked with the MOsaicker and Point source EXtractor (MOPEX)4 (Fig.3).
3.2 Detecting Transient Sources
To quantify the success of the forward-modeling algorithm, we use grids of artificial star tests. Owing to the IRAC mosaic’s large pixel scale (∼ 0.600), however, the flux density within any single pixel tends to vary from epoch to epoch, particularly in rapidly chang- ing (i.e., nuclear) environments. This could lead to false positives.
We therefore developed an approach that considers the variance in each pixel over all eight epochs and then searches for a cluster of interconnected pixels within a given epoch that are all>3𝜎from their average value (e.g., Fig.4). For each galaxy, we calculate the percent of SNe recovered using this method as a function of magni- tude and distance from the centre of the galaxy. The detection limit, or cutoff magnitude, is defined as the magnitude at which we can achieve a 50% recovery rate and varies significantly depending on the individual features of the host galaxy (Fig.5).
Figures6and7consolidate the results from Figure5and show the evolution of the detection rate as a function of magnitude for the different radii bins. Generally, the detection limit improves at larger radii owing to less complicated subtraction residuals. For comparison, results for the traditional (i.e., non-forward modeling) subtraction images are also plotted in Figure7. Note how the forward modeling improves our relative fraction of faint SNe (>14 mag) recovered.
Using this 3𝜎interconnected pixel detection algorithm, how- ever, is limited given only eight epochs of data per pixel and the fact that SNe can span multiple epochs, thereby influencing the statistics of the pixels that we are trying to isolate. Any single threshold does not equally apply to all pixels because the asymmetric PSF impacts the noise in the model subtractions of some pixels in a non-Gaussian way. We also notice a subtle nonlinearity in the pixel response that
4 https://irsa.ipac.caltech.edu/data/SPITZER/docs/dataanalysistools/tools/mopex/
10 12 14 16 18 20
Magnitude 0
20 40 60 80 100
Percent Recovered
Forward Modeling Standard Subtraction
Figure 7.Overall detection rate for 0–500comparing the standard and forward model subtraction techniques based on artificial star tests
.
Figure 8.Histograms of flux-density variance per pixel in the inner<300of each galaxy using the two different reduction techniques: standard template subtraction and forward modeling. The histogram for the forward modeling is much narrower, suggesting less variance per pixel and overall increased sensitivity to detecting fainter sources.
evolves over the two-year lifetime of the survey (i.e., later epochs have lower fluxes). Pixels may therefore exhibit 3𝜎deviations that are not due to Poisson statistics alone (Fig.4). Furthermore, we have prior knowledge of the artificial source locations, so recovering the sources is not hampered with false positives or nearby noise effects.
All of this is to say that false positives could impact our in- terpretation of Figures6and7. To alleviate any of these concerns, Figure8plots the distribution of variance in each pixel for the two different subtraction techniques. The forward-modeling approach has a much narrower distribution, which is consistent with an im- proved subtraction approach. We conclude that the artificial star tests are most useful for guiding the relative success of our for- ward modeling and subtraction algorithms, but the limitations of the simulations are significant enough that we cannot use them
Table 2.Supernova Detections in this Survey
Host Source RA/Dec Nuclear Offset Date 𝐹𝜈 ,[3.6𝜇 𝑚] 𝑚/𝑀 Notes
Galaxy (J2000) (00N/E) (MJD) (𝜇Jy) (3.6𝜇 𝑚)
NGC 5257 13:39:52.2148, +0:50:25.328 -11.8/0.3 56780 12(5) 18.3/−16.5 (0.5) –
IRAS 18293-3413 18:32:41.0980,−34:11:27.230 -1.0/0.2
56455 55(5) 16.8/−17.6 (0.1)
SN 2013if 56483 26(5) 17.6/−16.8 (0.3)
56613 87(5) 16.3/−18.1 (0.1) 56646 45(5) 17.0/−17.4 (0.2) Arp 148 11:03:53.1180, +40:51:09.385 -8.8/9.5 56510 1(0) 21.2/−14.6 (0.1) – NGC 6090 16:11:40.3172, +52:27:23.609 -3.7/-3.3 56890 44(5) 17.0/−18.4 (0.2) – NGC 3256 10:27:50.7987,−43:54:02.554 -5.2/11.0 56875 610(10) 14.1/−18.7 (0.1)
PSN J10275082-4354034 56925 142(20) 15.7/−17.1 (0.2)
IRAS 03359 03:38:47.3486, +15:32:56.462 3.0/2.7 56964 24(2) 17.7/−18.1 (0.1) –
IC 563 09:46:20.7408, +3:02:38.346 5.7/-5.5 56687 31(3) 17.4/−17.2 (0.3) –
NGC 6240 16:52:57.6161, +02:23:36.731 -18.7/-26.8
56795 46(4) 17.0/−18.0 (0.3)
PS1-14xw 56833 20(5) 17.8/−17.2 (0.4)
56953 5(2) 19.4/−15.6 (0.8)
NGC 6240 16:52:58.9791, +02:24:25.587 1.8/22.0
56421 56(5) 16.8/−18.2 (0.1)
SN 2013dc 56454 55(5) 16.8/−18.2 (0.1)
56580 8(2) 18.9/−16.1 (0.2) 56617 7(2) 19.0/−16.0 (0.2)
as an absolute quantification of the sensitivity of our search. Ulti- mately, we choose to manually search for transient sources in the resulting images with limited guidance from our algorithm.
4 RESULTS 4.1 Detections
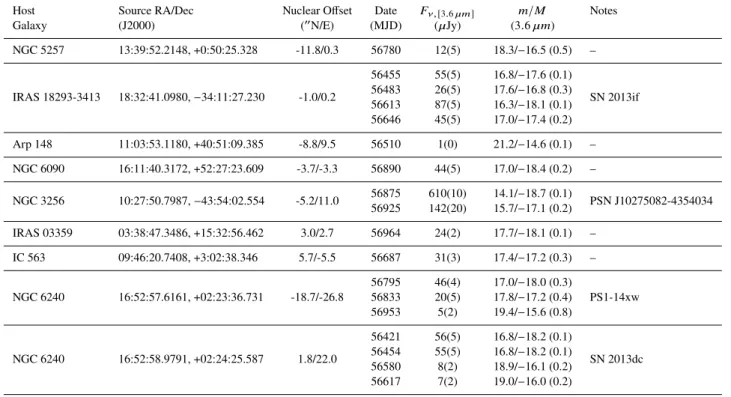
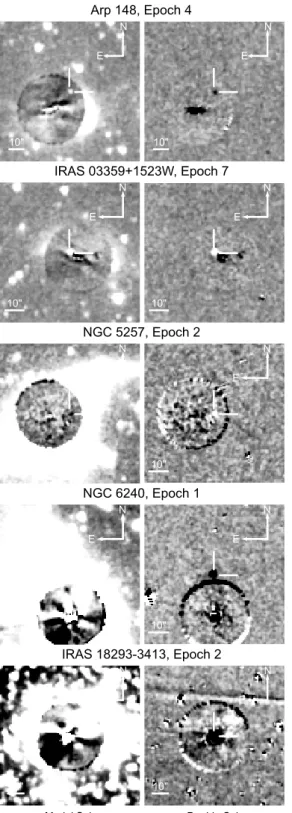
Table2 lists, and Figures9and 10 show, all 9 detections from our sample. We also indicate any corresponding ground-based dis- coveries, which help us constrain the explosion dates. SN 2013if was discovered by the Supernova UNmasked By Infra-Red Detec- tion (SUNBIRD) project and had an associated near-IR light curve (Kool et al. 2018). The best-fit light-curve template shows SN 2013if to be an SN IIP with almost no extinction, which is surprising given its proximity to the nucleus. Kankare et al.(2021) reported the discovery of PSN J10275082-4354034 near the nucleus of NGC 3256. The SN was also detected in serendipitous Hubble Space Telescopehigh-resolution imaging. The subsequent light curve was determined to be most consistent with an SN IIn, although an SN IIP could not be ruled out. Again, only a small amount of extinction (𝐴𝑉 .0.3 mag) is present. PS1-14xw was first reported byBenitez et al.(2014) and classified as an SN Ia, while SN 2013dc was first reported byBlock et al.(2013). We find no published analysis of either PS1-14xw or SN 2013dc.
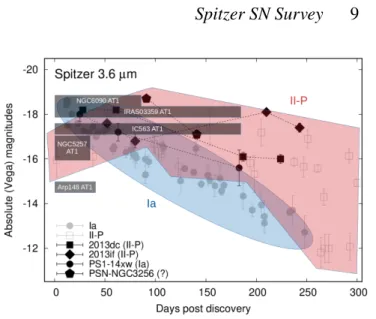
Figure11 plots the MIR light curves along with previously published light curves fromSzalai et al.(2019). The MIR evolution of SNe Ia and SNe IIP overlap substantially, especially at early times, but they do tend to diverge a bit more at later times. Of the light curves that extend out to later epochs, the evolution is most consistent with SNe IIP. Of course, PS1-14xw was originally classified as an SN Ia. For the SNe for which we only have a single epoch, the brightness is consistent with both SNe Ia and SNe IIP around peak with very little to no extinction. The detection
in Arp148 stands out for being relatively faint, which could indicate significant extinction or perhaps a poor constraint on the explosion time. It is difficult to draw any conclusions on the extinction from just a single filter.
Even with the forward modeling, all of our SN detections are outside (> 300) of the galactic nucleus. (SN 2013if is a nuclear event included in our tally for rates purposes, but we do not have a convincing detection in Figure9.) The survey has limited follow- up observations to confirm the nature and classification of each transient source, but the observed magnitudes are consistent with those of other SNe (Fig.10), bright enough to rule out most other types of transients (see Fig. 4 of Kasliwal et al. 2017). For the purposes of this analysis, we assume that each detection (except PS1-14xw) is a CCSN.
4.2 Survey Sensitivity
Before we can interpret the statistics of our detections, it is impor- tant to have an understanding of our survey’s sensitivity. We first consider our search sensitivity from an empirical perspective. Fig- ure10plots the photometry of SNe detected in our survey (green points), as well as the relatively early (<3 month) magnitudes of the nearby (<50 Mpc) CCSNe from Figure2(black points) and some young SNe Ia fromSzalai et al.(2019) (red points). Overplotted are lines of constant apparent magnitude. The early-time magnitude distribution of nearby CCSNe is−16 . 𝑀3.6𝜇 𝑚 . −18, while known SNe Ia are a couple of magnitudes brighter. We assume that the nearby distribution of magnitudes is relatively complete. If our survey were also to be considered complete and the magnitude dis- tribution doesn’t change as a function of redshift, then to first order we should detect a similar spread in our SN magnitude distribution out to 200 Mpc.
The actual distribution of our SN photometry in Figure10, however, does not reflect the more nearby distribution. Most of the
Arp 148, Epoch 4
E N
10"
E N
10"
IC 563, Epoch 5
E N
10"
E N
10"
IRAS 03359+1523W, Epoch 7
E N
10"
E N
10"
NGC 3256, Epoch 7
E N
10"
E N
10"
NGC 5257, Epoch 2
E N
10"
E N
10"
NGC 6240, Epoch 5
E N
10"
E N
10"
NGC 6240, Epoch 1
E N
10"
E N
10"
NGC 6090, Epoch 7
E N
10"
E N
10"
IRAS 18293-3413, Epoch 2
Model Sub E
N
10"
Double Sub E
N
10"
0.03
0.01 0.01 0.03
Flux Density (MJy sr-1)
Figure 9.Imaging of each SN detected in this survey, labeled by galaxy and epoch. For each detection, two images are displayed. On the left is the subtraction of the template derived using forward modeling. On the right is the subtraction of two different epochs that have been forward modeled. Epochs separated by
∼1 yr have similar orientations and the relative subtractions remove additional residuals that were still visible after forward modeling, as well as the more diffuse, outer galaxy that was not forward modeled. In general, this relative subtraction of epochs separated by about a year provided optimal results.
Figure 10.Absolute magnitudes of the nine SNe discovered in our sample (green symbols). The photometry corresponds to zero host galaxy extinction for all the events and therefore their absolute magnitudes should be consid- ered as lower limits. Also plotted are early (i.e.,<3 month) photometry from Szalai et al.(2019) of nearby (<50 Mpc) SNe IIP and some SNe Ia within 30 days of explosion (black and red symbols, respectively). Dashed, dotted, and dotted-dashed lines represent apparent brightness levels of 17, 18, and 19 mag, respectively.
SNe we detect are relatively bright. In fact, as noted in Figure11, an absolute magnitude𝑀3.6𝜇m≈ −18 may be interpreted as more consistent with the peak magnitudes of SNe Ia rather than those of SNe IIP. Although our sample is limited in size, we conclude that we are Malmquist biased and generally do not detect SNe dimmer than 17.5±0.5 mag. This empirical limit is compared to the results of our artificial-star tests in Figure5. While in most cases the empirical threshold is brighter than the artificial-star tests achieved, there are a number of cases where the artificial-star tests are brighter than the empirical limit, particularly in the innermost regions of the galaxies. As noted in Section3.2, there are a number of caveats in the sensitivity of the artificial-star tests to the fainter stars. In general, we therefore define our sensitivity limit for a given radial bin to be the brighter of these two limits.
4.3 Possible Causes for Decreased Sensitivity
This survey is not particularly sensitive to SNe in either the nuclear regions of galaxies or galaxies at>150 Mpc.Cresci et al.(2007) offer some explanations for theirHST/NICMOS survey that could apply to our survey. For example, the FIR flux used to calculate the expected CCSNr is dominated by obscured AGNs and not by star formation. Estimates of the relative AGN power, however, have been made using a variety of MIR tracers in hundreds of local IR galaxies and, in most cases, do not suggest significant AGN contributions (e.g.,Díaz-Santos et al. 2017).
Another possibility is that the SNe may be more obscured by dust than originally expected, or underluminous SNe (e.g.,Pa- storello et al. 2004) form a significant fraction of all CCSNe. In the latter case, the SNe would stay above our detection limit for a shorter time. In either case, the Gaussian distribution of magnitudes would have a tail skewed toward dimmer objects and our overall sensitivity would decrease, resulting in a decrease in our expected CCSNr.
The most likely explanation, however, is a combination of worse than expected subtraction residuals combined with relatively poor resolution, despite the decreased extinction afforded by obser-
Figure 11.The 3.6𝜇m light curves of the four detected known transients in our Survey (with black symbols), together with previously published light-curves (grey symbols and shaded colored regions, adopted fromSzalai et al. 2019). Dark-grey transparent rectangles mark the single epoch of photometry for the other five detected sources within the possible periods (taking into account the dates of last non-detections). Widths and heights of the rectangles denote the uncertainties of epochs and absolute magnitudes of the five previously unknown transients, respectively.
vations at 3.6𝜇m. Note that the mosaic images have a pixel scale of∼0.600that corresponds to a projected distance of∼290 pc at 100 Mpc (and the real resolution is a factor of 2–3 worse). Our poor residual at<300corresponds to∼1.5 kpc at these distances. If most starburst activity is concentrated within the galaxy nucleus, then our survey not being sensitive to a majority of these events. We correct for the limitations in our survey sensitivity below.
4.4 Observed vs. Expected
To properly compare the observed number of SNe detected to the predicted value, we first have to correct for the number of expected SNe to account for our decreased sensitivity. To properly correct, we must calculate both the fraction of SNe we are sensitive to at any given location in a galaxy,𝑓SNe, and the fraction of light within that radius,𝑓light.
We first define our detection threshold in Section4.2. We then assume the distribution of SN magnitudes to be consistent with observations in Figure2, which we take to be a Gaussian cen- tred function at 𝑀3.6𝜇m = −17 mag and a standard deviation of 𝜎SN IIP=0.7. No extinction is applied. This distribution should be considered an upper limit as the actual function may have a lower- luminosity tail or be shifted to a somewhat less-luminous centre in the case of high extinction. For each galaxy, we calculate the respec- tive apparent magnitude distribution for the given distance and the corresponding fraction of SNe,𝑓SNe, in the magnitude distribution that is bright enough to be detected based on the detection threshold.
This fraction is calculated separately for each radial bin.
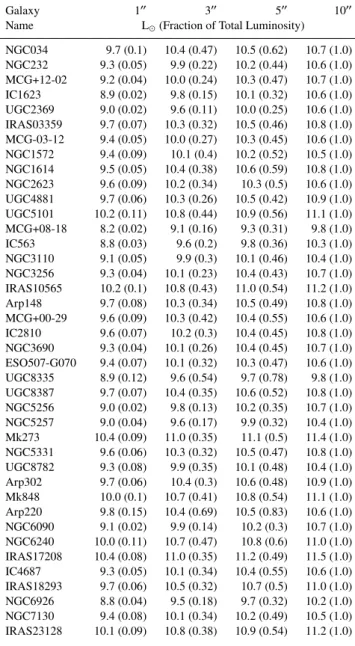
We next derive the fraction of light within each radial bin, 𝑓light, from the integrated MIR lumninosity, which we measure using aperture photometry performed on archival IRAC and MIPS data (when available). Although the SFR and the CCSNr are tied to the FIR luminosity, we assume the MIR to be a useful and convenient proxy, at least to first order. While most (U)LIRG flux comes out at longer wavelengths (i.e.,∼70𝜇m), the shape of a (U)LIRG SED is
Figure 12.Relationship between predicted CCSN rate, actual CCSN rate, and distance.(Top:)The number of actual detections compared to the pre- dicted number of CCSNe, where the colour bar corresponds to the distance (Mpc), for both the uncorrected and corrected rates.(Bottom:)The predicted number of SNe as a function of distance, where the colour bar corresponds to the number of actual detections. Both plots show values for both the uncorrected and corrected rates (as described in the text).
roughly constant (Wright et al. 2014). Table3lists our derived MIR luminosities and fractional luminosity for each aperture.
The predicted CCSNr is finally corrected by multiplying by both the fraction of SNe we are sensitive to,𝑓SNe, and the fraction of light within that radial bin,𝑓light. Table1lists the corrected CCSNr predictions, and Figure12 compares the predicted and observed number of SNe detected for each galaxy. Figure12(a) compares the number of observed CCSNe to the number of predicted CCSNe.
Overplotted is a line corresponding to a 1:1 ratio, which is what we would expect in an ideal scenario. The two plots correspond to the uncorrected and corrected number of predicted events, respectively.
Figure12(b) plots the predicted number of CCSNe as a function of distance. Again, the upper and lower panels correspond to the uncorrected and corrected number of predicted events, respectively.
There are several qualitative takeaways. First, all of our detec- tions occur at<150 Mpc. Although our calculations suggest that we should be sensitive to SNe out to 200 Mpc, other challenges arise at these distances. For example, galaxies become less resolved and more compact, so the subtraction residuals have a larger im-
Table 3.IR Integrated Luminosities (5–24𝜇m)
Galaxy 100 300 500 1000
Name L(Fraction of Total Luminosity)
NGC034 9.7 (0.1) 10.4 (0.47) 10.5 (0.62) 10.7 (1.0) NGC232 9.3 (0.05) 9.9 (0.22) 10.2 (0.44) 10.6 (1.0) MCG+12-02 9.2 (0.04) 10.0 (0.24) 10.3 (0.47) 10.7 (1.0) IC1623 8.9 (0.02) 9.8 (0.15) 10.1 (0.32) 10.6 (1.0) UGC2369 9.0 (0.02) 9.6 (0.11) 10.0 (0.25) 10.6 (1.0) IRAS03359 9.7 (0.07) 10.3 (0.32) 10.5 (0.46) 10.8 (1.0) MCG-03-12 9.4 (0.05) 10.0 (0.27) 10.3 (0.45) 10.6 (1.0) NGC1572 9.4 (0.09) 10.1 (0.4) 10.2 (0.52) 10.5 (1.0) NGC1614 9.5 (0.05) 10.4 (0.38) 10.6 (0.59) 10.8 (1.0) NGC2623 9.6 (0.09) 10.2 (0.34) 10.3 (0.5) 10.6 (1.0) UGC4881 9.7 (0.06) 10.3 (0.26) 10.5 (0.42) 10.9 (1.0) UGC5101 10.2 (0.11) 10.8 (0.44) 10.9 (0.56) 11.1 (1.0) MCG+08-18 8.2 (0.02) 9.1 (0.16) 9.3 (0.31) 9.8 (1.0) IC563 8.8 (0.03) 9.6 (0.2) 9.8 (0.36) 10.3 (1.0) NGC3110 9.1 (0.05) 9.9 (0.3) 10.1 (0.46) 10.4 (1.0) NGC3256 9.3 (0.04) 10.1 (0.23) 10.4 (0.43) 10.7 (1.0) IRAS10565 10.2 (0.1) 10.8 (0.43) 11.0 (0.54) 11.2 (1.0) Arp148 9.7 (0.08) 10.3 (0.34) 10.5 (0.49) 10.8 (1.0) MCG+00-29 9.6 (0.09) 10.3 (0.42) 10.4 (0.55) 10.6 (1.0) IC2810 9.6 (0.07) 10.2 (0.3) 10.4 (0.45) 10.8 (1.0) NGC3690 9.3 (0.04) 10.1 (0.26) 10.4 (0.45) 10.7 (1.0) ESO507-G070 9.4 (0.07) 10.1 (0.32) 10.3 (0.47) 10.6 (1.0) UGC8335 8.9 (0.12) 9.6 (0.54) 9.7 (0.78) 9.8 (1.0) UGC8387 9.7 (0.07) 10.4 (0.35) 10.6 (0.52) 10.8 (1.0) NGC5256 9.0 (0.02) 9.8 (0.13) 10.2 (0.35) 10.7 (1.0) NGC5257 9.0 (0.04) 9.6 (0.17) 9.9 (0.32) 10.4 (1.0) Mk273 10.4 (0.09) 11.0 (0.35) 11.1 (0.5) 11.4 (1.0) NGC5331 9.6 (0.06) 10.3 (0.32) 10.5 (0.47) 10.8 (1.0) UGC8782 9.3 (0.08) 9.9 (0.35) 10.1 (0.48) 10.4 (1.0) Arp302 9.7 (0.06) 10.4 (0.3) 10.6 (0.48) 10.9 (1.0) Mk848 10.0 (0.1) 10.7 (0.41) 10.8 (0.54) 11.1 (1.0) Arp220 9.8 (0.15) 10.4 (0.69) 10.5 (0.83) 10.6 (1.0) NGC6090 9.1 (0.02) 9.9 (0.14) 10.2 (0.3) 10.7 (1.0) NGC6240 10.0 (0.11) 10.7 (0.47) 10.8 (0.6) 11.0 (1.0) IRAS17208 10.4 (0.08) 11.0 (0.35) 11.2 (0.49) 11.5 (1.0) IC4687 9.3 (0.05) 10.1 (0.34) 10.4 (0.55) 10.6 (1.0) IRAS18293 9.7 (0.06) 10.5 (0.32) 10.7 (0.5) 11.0 (1.0) NGC6926 8.8 (0.04) 9.5 (0.18) 9.7 (0.32) 10.2 (1.0) NGC7130 9.4 (0.08) 10.1 (0.34) 10.2 (0.49) 10.5 (1.0) IRAS23128 10.1 (0.09) 10.8 (0.38) 10.9 (0.54) 11.2 (1.0)
pact. These residuals correspond to larger projected distances in, and therefore fraction of, the host galaxy. While there is no sharp cutoff, the more distant galaxies in our sample are more luminous, but also more compact and dustier.
Second, in almost every case the adjusted expected CCSNr ends up falling to<1, which makes a comparison to the expected trend (black line) in Figure12(a) difficult. Despite small-number statistics, we still see a slight correlation between observed SNe versus predicted SNe that, although weak, does provide a useful self-consistency check. The one exception is Arp 220, which stands out from the other galaxies at∼ 75 Mpc for its large number of predicted SNe. Despite this expectation, we don’t detect any SNe, possibly due to the fact that most of the light is concentrated in the inner< 300. Furthermore, like other IR-bright galaxies, Arp 220 may suffer from relatively high local extinction.
Taken all together, these adjustments limit a significant fraction of the phase space in which we can search for and detect an SN. The large number of galaxies observed, however, compensates for these inefficiencies and provides adequate statistics. In total, we expect 96 and 14±6 SNe before and after corrections are made (respectively),
where the error bars are dominated by uncertainty assigned above to our detection threshold (i.e., 𝑚
3.6𝜇m = 17.5±0.5 mag). We discover 9 SNe (Table2).
4.5 Statistical Implications
After all corrections are taken into account, our observations yield a statistically significant sample that will enable us to differentiate between (1) undetected SNe and (2) counting statistics. Assuming the counting statistics are determined by the SN sample (i.e.,𝜎=
√
𝑁), then the minimum number of SNe we must expect to detect isroughlysixteen. Any fewer expected SNe would be statistically insufficient. For example, to identify a 3𝜎 deficit in the CCSNr when only 9 SNe are expected, one would need to observe<0 SNe.
As noted above, we detect 9 SNe, whereas theory predicted 14±6 SNe. We conclude that our observations are generally consis- tent with the predictions, especially when considering the counting statistics, which for 14 SNe yield𝜎counting=√
14=3.7. Of course, the number of predicted SNe is givenaftersignificant corrections in our sensitivity have been applied.
5 CONCLUSION
We have presented a Spitzer/IRAC MIR survey for dust- extinguished SNe to resolve the discrepancy between theoreti- cally predicted and optical/NIR observed core-collapse SN rates.
We searched 40 nearby (<200 Mpc) star-forming galaxies using Spitzer/IRAC. The survey includes eight epochs of observations obtained in the years 2012–2014.
Our ability to detect new SNe was dominated by subtraction residuals near the nuclear regions (<300) of each galaxy caused by an asymmetric PRF that rotated throughout the year as the telescope circled the Sun. To optimise our subtraction algorithm, we imple- mented a forward modeling technique that will be employed on the NGRST; (Rubin et al. 2021).
While forward modeling improves our overall sensitivity, the number of discovered SNe is still substantially lower than the ex- pected intrinsic number during the survey period. We compensate for the number of predicted SNe by quantifying the inefficiencies, mostly arising from remaining residuals in the inner<300, where a majority of star formation occurs. The predicted rates are par- ticularly impacted by the fact that most of the galaxies with the highest SN rates (2–11 SNe per year) are located at distances larger than 150 Mpc, where essentially zero SNe can be expected to be discovered owing to the sensitivity limits of the search (Table1).
After all corrections are applied, we expect to discover 14±6 SNe and actually find 9 SNe, which suggests that our observations are consistent with the theoretical expectations.
While still hampered by high extinction, if most starburst ac- tivity is concentrated within the inner nucleus of the galaxy (for this experiment<1.5 kpc at 100 Mpc), a survey with both higher res- olution and longer-wavelength observations is necessary. A stable, space-based PSF is needed, too. Figure1shows that the optimal wavelength is actually closer to 2.7𝜇m. With the upcoming launch ofJWST, with a PSF of∼0.09100in its F277W filter, such a survey to probe the nuclear regions of star-forming galaxies for transients will finally be possible.
ACKNOWLEDGEMENTS
The authors acknowledge an anonymous referee for helpful com- ments that led to improvements in this paper. We also give tremen- dous thanks to the IRAC instrument support team at theSpitzerSci- ence Center (SSC) for their continued assistance over the years. They are also grateful to Rick Arendt for his helpful comments. O.D.F.
additionally thanks Peter Capak, Sean Carey, and Patrick Lowrance for useful technical discussions. This work is based on observa- tions made with theSpitzer Space Telescope(PID 90031), which is operated by the Jet Propulsion Laboratory, California Institute of Technology, under a contract with NASA. Support for this work was provided by NASA through an award issued by JPL/Caltech, primar- ily supporting students C.C., G.L., and H.K. Additional support was provided to D.R. and H.K. by STScI’s DDRF Grant D0001.82477 and the TSRC program. T.S. is supported by the János Bolyai Re- search Scholarship of the Hungarian Academy of Sciences, by the New National Excellence Program (UNKP-20-5) of the Ministry of Technology and Innovation of Hungary, by the GINOP-2-3-2-15- 2016-00033 project of the National Research, Development, and Innovation Office of Hungary (NKFIH) funded by the European Union, and by NKFIH/OTKA FK-134432 grant. A.V.F. acknowl- edges support from the TABASGO Foundation, the Christopher R. Redlich Fund, and the U.C. Berkeley Miller Institute for Basic Research in Science (in which he is a Senior Miller Fellow).
Data availability
The data underlying this article will be shared on reasonable request to the corresponding author.
REFERENCES
Benitez S., et al., 2014, The Astronomer’s Telegram,6107, 1 Block A., et al., 2013, Central Bureau Electronic Telegrams,3551, 1 Bregman J. D., Temi P., Rank D., 2000, A&A,355, 525
Chary R., Elbaz D., 2001,ApJ,556, 562
Cresci G., Mannucci F., Valle M. D., Maiolino R., 2007,A&A, 462, 927 Dahlén T., Fransson C., 1999, A&A,350, 349
Dahlen T., et al., 2004,The Astrophysical Journal, 613, 189 Díaz-Santos T., et al., 2017,ApJ,846, 32
Fazio G. G., et al., 2004,ApJS,154, 10 Filippenko A. V., 1997, ARA&A, 35, 309
Floc’h E. L., et al., 2005,The Astrophysical Journal, 632, 169 Genzel R., et al., 1998,Astrophysical Journal v.498, 498, 579
Grossan B., Spillar E., Tripp R., Pirzkal N., Sutin B. M., Johnson P., Barnaby D., 1999,The Astronomical Journal, 118, 705
Hayden B., et al., 2021, arXiv e-prints,p. arXiv:2103.13285 Holtzman J. A., et al., 2008,AJ,136, 2306
Iben I., 1983,Astrophysical Journal, 275, L65 Jencson J. E., et al., 2019,ApJ,886, 40
Kankare E., et al., 2008,The Astrophysical Journal, 689, L97 Kankare E., et al., 2012,The Astrophysical Journal Letters, 744, L19 Kankare E., et al., 2021,A&A,649, A134
Kasliwal M. M., et al., 2017,ApJ,839, 88 Kennicutt Robert C. J., 1998,ARA&A,36, 189 Kool E. C., et al., 2018,MNRAS,473, 5641
Lawrence C., Gautier N., 2004, Spitzer Proposal ID #108, p. 108 Madau P., Dickinson M., 2014,ARA&A,52, 415
Magnelli B., Elbaz D., Chary R. R., Dickinson M., Borgne D. L., Frayer D. T., Willmer C. N. A., 2009,Astronomy and Astrophysics, 496, 57 Magnelli B., Elbaz D., Chary R. R., Dickinson M., Borgne D. L., Frayer
D. T., Willmer C. N. A., 2011,Astronomy & Astrophysics, 528, 35
Maiolino R., Vanzi L., Mannucci F., Cresci G., Ghinassi F., Valle M. D., 2002,Astronomy and Astrophysics, 389, 84
Maiolino R., Oliva E., Ghinassi F., Pedani M., Mannucci F., Mujica R., Juarez Y., 2004a,Astronomy and Astrophysics, 420, 889
Maiolino R., Schneider R., Oliva E., Bianchi S., Ferrara A., Mannucci F., Pedani M., Sogorb M. R., 2004b,Nature, 431, 533
Mannucci F., et al., 2003,A&A, 401, 519
Mannucci F., Valle M. D., Panagia N., 2007,Monthly Notices of the Royal Astronomical Society, 377, 1229
Matteucci F., Panagia N., Pipino A., Mannucci F., Recchi S., Valle M. D., 2006,Monthly Notices of the Royal Astronomical Society, 372, 265 Mattila S., Meikle W. P. S., 2001, Monthly Notices RAS, 324, 325 Mattila S., Meikle W. P. S., Greimel R., 2004,New Astron. Rev.,48, 595 Mattila S., Monard L. A. G., Li W., 2005a, IAU Circ., 8473, 2
Mattila S., et al., 2005b, IAU Circ., 8474, 1
Mattila S., et al., 2007,The Astrophysical Journal, 659, L9 Mattila S., et al., 2012,ApJ,756, 111
Miluzio M., et al., 2013,A&A,554, A127
Navasardyan H., Petrosian A. R., Turatto M., Cappellaro E., Boulesteix J., 2001,Monthly Notices of the Royal Astronomical Society, 328, 1181 Pastorello A., et al., 2004,MNRAS,347, 74
Pérez-Torres M., Mattila S., Alonso-Herrero A., Aalto S., Efstathiou A., 2021,A&ARv,29, 2
Rho J., Reach W. T., Tappe A., Hwang U., Slavin J. D., Kozasa T., Dunne L., 2009, eprint arXiv, 0905, 497
Richmond M. W., Filippenko A. V., Galisky J., 1998,The Publications of the Astronomical Society of the Pacific, 110, 553
Rubin D., Cikota A., Aldering G., Fruchter A., Perlmutter S., Sako M., 2021, arXiv e-prints,p. arXiv:2102.05069
Sanders D. B., Mirabel I. F., 1996,Annual Review of Astronomy and As- trophysics, 34, 749
Sanders D. B., Mazzarella J. M., Kim D.-C., Surace J. A., Soifer B. T., 2003, The Astronomical Journal, 126, 1607
Scannapieco E., Bildsten L., 2005,The Astrophysical Journal, 629, L85 Smith N., Li W., Filippenko A. V., Chornock R., 2011,Monthly Notices of
the Royal Astronomical Society, 412, 1522 Strolger L.-G., et al., 2015,ApJ,813, 93 Suzuki N., et al., 2012,ApJ,746, 85
Szalai T., Zsíros S., Fox O. D., Pejcha O., Müller T., 2019,ApJS,241, 38 Wright J. T., Griffith R. L., Sigurdsson S., Povich M. S., Mullan B., 2014,
ApJ,792, 27
van Buren D., Greenhouse M. A., 1994,The Astrophysical Journal, 431, 640
