S P E C I A L I S S U E A R T I C L E
Effective MDR reversers through phytochemical study of Euphorbia boetica
Sara Neto
1 |Noélia Duarte
1 |Cecília Pedro
1 |Gabriella Spengler
1 |Joséph Molnár
2 |Maria ‐ José U. Ferreira
11Research Institute for Medicines (iMed.
ULisboa), Faculty of Pharmacy, University of Lisbon, Lisbon, Portugal
2Department of Medical Microbiology and Immunobiology, Faculty of Medicine, University of Szeged, Szeged, Hungary
Correspondence
Maria‐José U. Ferreira,Research Institute for Medicines (iMed.ULisboa), Faculty of Pharmacy, University of Lisbon, Av. Prof. Gama Pinto, 1649‐003 Lisbon, Portugal.
Email: mjuferreira@ff.ulisboa.pt
Funding information
Fundação para a Ciência e a Tecnologia, Grant/
Award Numbers: PTDC/MED‐QUI/30591/
2017, SAICTPAC/0019/2015, LISBOA‐01‐ 0145‐FEDER‐402‐022125
Abstract
Introduction:
Macrocyclic diterpenes from
Euphorbiaspecies were found to be promising modulators of multidrug resistance (MDR), a complex phenomenon that hampers the effectiveness of cancer therapy.
Objective:
To find new effective MDR reversers through the phytochemical study of
E. boetica, including isolation and molecular derivatisation.Material and methods:
The phytochemical study of
E. boeticawas performed through chromatographic techniques. Preliminary analysis of crude chromatographic fractions from the methanol extract was carried out by
1H
‐NMR in order to prioritise the study of those having macrocyclic diterpenes. Polyamide resin was used to remove chlorophylls. Molecular derivatisation of isolated compounds comprised hydrolysis, reduction and acylation reactions. The structural identification of compounds was performed through analysis of spectroscopic data, mainly one
‐dimensional
‐and two
‐dimensional
‐NMR. The MDR reversing activity was assessed using a combination of transport and chemosensitivity assays, in mouse lymphoma (L5178Y
‐MDR) and Colo320 cell models.
Results:
The
1H
‐NMR study of crude fractions and application of a straightforward method to remove chlorophylls, allowed the effortless isolation of two lathyrane
‐type diterpenes in large amounts, including the new polyester, euphoboetirane B (1).
Taking advantage of the chemical functions of
1, 13 new derivatives were prepared.Several compounds showed to be promising modulators of P
‐glycoprotein (P
‐gp), in resistant cancer cells. Most of the compounds tested revealed to interact synergisti- cally with doxorubicin.
Conclusion:
These results corroborate the importance of macrocyclic lathyrane diterpenes as effective lead compounds for the reversal of MDR.
K E Y W O R D S
Euphorbia, lathyrane, macrocyclic diterpenes, multidrug resistance, P‐glycoprotein
Sara Neto and Noélia Duarte are first co‐authors DOI: 10.1002/pca.2841
498 © 2019 John Wiley & Sons, Ltd. wileyonlinelibrary.com/journal/pca Phytochemical Analysis. 2019;30:498–511.
1
|I N T R O D U C T I O N
Euphorbiaspecies (Euphorbiaceae) are reported to be used in traditional medicine to treat skin cancer and warts, digestive system disorders and infections.1Importantly, topical administration ofE. peplussap in Aus- tralian folk medicine prompted the development of Picato® (ingenol mebutate) gel, approved in 2012 by the US Food and Drug Administra- tion (FDA) for the treatment of actinic keratosis.2In the last decades, Euphorbiaspecies have been the subject of intensive phytochemical studies that have resulted in the isolation of a high diversity of com- pounds, some of them exhibiting very important biological activities.3,4 In particular, these species have afforded a large number of structurally unique macrocyclic diterpenes with the lathyrane and jatrophane skele- tons.4,5Apart from their importance as biogenetic and chemotaxonomic markers, since they are exclusively isolated from Euphorbiaceae plants,6 several studies have revealed that they are promising modulators of multidrug resistance (MDR) in tumour cells.4,5,7-14
Currently, resistance towards many clinically used drugs is a major limitation to effective cancer therapies.15-17Cancer resistance can be broadly divided as intrinsic, when the tumour fails to respond to the initial chemotherapy, and acquired during treatment by various therapy‐induced adaptive responses.16,18Resistance could also take more complex outcomes when treatments fail to respond to multiple drugs with different mechanisms of action, a phenomenon referred as multidrug resistance (MDR).19There are several mechanisms responsi- ble for MDR, which have been exhaustively reviewed.15,17,18,20-22By far, the most studied mechanisms are related with the overexpression of several efflux membrane proteins. Among them, the ATP‐Biding‐ Cassete (ABC) superfamily largely contributes to MDR, resulting in the increased translocation of the cytotoxic drugs out of the cell, consequently reducing their intracellular concentrations and their biological effect.15,19,21
In mammalian cells, three main ABC transporter proteins are involved in MDR: P‐glycoprotein (P‐gp/MDR1/ABCB1), the multidrug resistant associated protein (MRP1/ABCC1) and the breast cancer resistant protein (BCRP/ABCG2).19,21P‐gp has been exhaustively stud- ied, and until date, some of the most significant strategies to overcome MDR target this efflux transporter. One pharmacological approach involves the co‐administration of a non‐toxic P‐gp modulator and the cytotoxic agent, in order to inhibit or modulate its efflux, increasing the concentration of drugs within the cells.19-21Many synthetic and natural P‐gp modulators have been reported, and some of them have reached the stage of clinical trials. However, only limited success was achieved and more studies to find new non‐toxic and effective P‐gp modulators are still of great significance.23,24In addition, in recent years considerable progresses have been made on knowledge about mechanistic and functional aspects of ABC transporters, not only to define their substrates and inhibitors,21but also to characterise P‐gp structure at near‐atomic resolution providing molecular basis for addi- tional conformations and drug binding modes and sites.23
Continuing our research for novel MDR modulators from natural sources, herein, we report the isolation of two lathyrane diterpene polyesters (1and2), fromEuphorbia boeticaaerial parts, one of them
(1) isolated for the first time. The straightforward and timeless isola- tion of compounds was only possible thanks to the use preliminary
1H‐NMR analysis of crude fractions, and removal of chlorophylls through flash chromatography over polyamide. Aiming at obtaining a set of homologous bioactive compounds, diterpene1, isolated in high quantity, was submitted to several chemical transformations, including hydrolysis, reduction and acylation reactions. Overall, 13 derivatives (3–15) were obtained, and characterised using spectroscopic methods.
Their effect on modulation of P‐gp efflux was evaluated by flow cytometry, measuring the rhodamine‐123 accumulation in MDR mouse T‐lymphoma cells and MDR human colon adenocarcinoma (Colo 320) cells. Furthermore, some of these modulators were assayed,in vitro, for their effects in combination with doxorubicin.
2
|E X P E R I M E N T A L S E C T I O N 2.1
|General procedures
All solvents were dried according to published methods and distilled prior to use. All the other reagents were obtained from commercial sup- pliers and were used without further purification. Flash column chro- matography (CC) was performed on polyamide CC 6 (0.05–0.16 mm, Macherey‐Nagel) and silica gel (Merck 9385), or by using CombiFlash®
Rf200 (Teledyne Isco). Merck silica gel 60 F254 plates were used in analytical thin‐layer chromatography (TLC), with visualisation under ultraviolet (UV) light (λ = 254 and 366 nm) and by spraying with sulphuric acid/methanol (H2SO4/MeOH) (1:1), followed by heating.
For preparative TLC, 20 cm × 20 cm silica plates were used (Merck 1.05774). Melting points were determined on a Köpffler apparatus.
Specific optical rotations½ α25D were obtained on a Perkin‐Elmer 241‐ MC polarimeter using quartz cells of 1 dm path length, and all samples were solubilised in chloroform (CHCl3). Infrared (IR) spectra were deter- mined on a Shimadzu IRAffinity‐1 FTIR spectrophotometer. Nuclear magnetic resonance (NMR) spectra were recorded on a Brüker ARX‐ 400 NMR spectrometer (1H 400 MHz;13C 100.61 MHz), using CDCl3, CD3OD, C5D5N or DMSO‐d6as solvents. Chemical shifts are expressed inδ(ppm) referenced to the solvent used, and the proton coupling con- stantsJin hertz (Hz). Spectra were assigned using appropriate COSY, DEPT, HMQC and HMBC sequences. High‐resolution mass spectra were recorded on a FTICR‐MS Apex Ultra (Brüker Daltonics) 7 T instru- ment. Electrospray ionisation mass spectrometry (ESI‐MS) analysis were performed on a triple quadrupole (QT) Micromass Quattro Micro AP1 mass spectrometer, with an ESI ion source set in a positive ionisation mode. All tested compounds were purified to≥95% purity as determined by high‐performance liquid chromatography (HPLC).
2.2
|Phytochemical study
Euphorbia boeticaBoiss. (Euphorbiaceae) aerial parts were extracted with MeOH as previously reported.8Briefly, the air‐dried aerial parts were exhaustively extracted with MeOH at room temperature. The pooled extracts were evaporated under vacuum to give a residue that
was suspended in a MeOH/H2O solution (1:1) and extracted with ethyl acetate (EtOAc). Chromatographic fractionation of the EtOAc soluble part of the MeOH extract afforded 10 crude fractions (A–J).
To perform preliminary1H‐NMR experiments, 15 mg of each fraction were solubilised in 650μL of CDCl3, filtered, and further analysed aiming at prioritising the study of those fractions having macrocyclic diterpenes.Fraction E (58.2 g) obtained with n‐hexane/EtOAc (7:3) was chromatographed on a polyamide column (300 g) with mixtures of MeOH/H2O (1:1, 3:2, 7:3, 4:1 and 1:0) as eluents. The Fraction obtained with MeOH/H2O (3:2 and 7:3, 24.8 g) was subjected to silica gel flash chromatography [silicaon dioxide (SiO2), 300 g], using a gradi- ent ofn‐hexane/EtOAc (1:0 to 0:1) and EtOAc/MeOH (1:0 to 3:1). As indicated by TLC, and according to differences in composition, 12 fractions were obtained (EA–EL). Fractions EB, EC, ED, EE, EGand EH
were recrystallised from EtOAc/n‐hexane to give: euphoboetirane B (1, 1.88 g) and2(Euphorbia Factor L15, herein named euphoboetirane A, 1.72 g). The residue of fraction EF(2.63 g) and the mother liquors of fraction EE(1.69 g) were combined and chromatographed over SiO2
(200 g) using mixtures ofn‐hexane/EtOAc (1:0 to 0:1) to obtain six fractions (EEF1ato EEF1f). The residue of fraction EEF1b(1.52 g) was recrystallised with EtOAc/n‐hexane to obtain 740 mg of the already isolated compound2.
Euphoboetirane B; 5α,15β‐diacetoxy‐3β‐propanoyloxy‐lathyr‐ 6(17),12E‐en‐14‐one(1): white crystals (EtOAc/n‐hexane); m.p. 168– 171°C; ½ α25D + 213.0 (c 0.100, CHCl3); IR (KBr): υmax 2969, 1736, 1674, 1624, 1373, 1227, 907 cm−1;1H‐NMR (400 MHz, CDCl3):δ 0.87 (3H, d,J =6.7 Hz, CH3‐16), 1.12 (3H, s, CH3‐19), 1.12 (3H, t, J =7.4 Hz, 3‐OCOCH2CH3), 1.14 (3H, s, CH3‐18), 1.12 (1H, m, H‐9), 1.36 (1H, dd, J =8.2, 11.4 Hz, H‐11), 1.56 (1H, dd, J =11.6,14.4 Hz, H‐1β), 1.66 (3H, s, CH3‐20), 1.74 (1H, m, H‐8a), 1.94 (3H, s, 5‐OCOC- H3), 2.00 (1H, m, H‐7b), 2.04 (1H, m, H‐8b), 2.06 (3H, s, 15‐OCOCH3), 2.20 (1H, m, H‐7a), 2.27 (1H, m, H‐2), 2.32 (2H, m, 3‐OCOCH2CH3), 2.75 (1H, dd, J =3.4, 10.2 Hz, H‐4), 3.42 (1H, dd, J =8.4, 14.4 Hz, H‐ 1α), 4.70 (1H, s, H‐17a), 4.96 (1H, s, H‐17b), 5.57 (1H, t,J= 3.2 Hz, H‐3), 6.05 (1H, d,J= 10.3 Hz, H‐5), 6.46 (1H, d,J= 11.4 Hz, H‐12);
13C‐NMR (100.61 MHz, CDCl3):δ9.1 (3‐OCOCH2CH3), 12.5 (C‐20), 14.2 (C‐16), 16.9 (C‐19), 21.3 (5‐OCOCH3), 21.7 (C‐8), 22.1 (15‐ OCOCH3), 25.4 (C‐10), 27.9 (3‐OCOCH2CH3), 28.5 (C‐11), 29.1 (C‐ 18), 35.1 (C‐7), 35.5 (C‐9), 37.4 (C‐2), 48.5 (C‐1), 52.4 (C‐4), 65.9 (C‐ 5), 80.1 (C‐3), 92.5 (C‐15), 115.6 (C‐17), 134.3 (C‐13),δ144.5 (C‐6), 146.8 (C‐12), 169.9 (15‐OCOCH3), 170.6 (5‐OCOCH3), 173.9 (3‐ OCOCH2CH3), 197.0 (C‐14); ESI‐MSm/z475 [M + H]+. HR‐ESI‐MS:
m/z475.26163 [M + H]+(calcd for C27H39O7: 475.26175).
Euphoboetirane A (Euphorbia Factor L15,2): white crystals (EtOAc/
n‐hexane); m.p. 138–140°C;½ α25D + 230.0 (c0.117, CHCl3); IR (KBr):
υmax 2934, 1736, 1644, 1613, 1375, 905 cm−1; ESI‐MS m/z 461 [M + H]+.25
2.3
|Preparation of 14 β‐ hydroxylathyrane (3)
Euphoboetirane B (1, 0.33 mmol) was dissolved in dry terahydrofuran (THF, 5 mL) and the solution was cooled at 0°C. Lithium aluminium
hydride (LiAlH4) (0.1 mol) was added and the mixture was stirred for 1 h at 0°C. The reaction was stopped with aqueous sodium hydroxide (NaOH) (10%, 1.5 mL) and stirred for 10 min to neutralise the excess of LiAlH4. The obtained precipitate was filtrated through celite with EtOAc/H2O 20% (m/v, 100 mL) and the aqueous layer was extracted with EtOAc (8 × 20 mL). The organic layers were dried with anhydrous sodium sulphate (Na2SO4), and evaporated to give an oil that was sub- jected to column chromatography (SiO2, 12 g,n‐hexane/EtOAc 1:0 to 0:1, CombiFash system) to give 56 mg of a white powder (0.17 mmol, 52% yield).
14β‐Hydroxylathyrane, 3β,5α,14β,15β‐tetrahydroxy‐lathyr‐6 (17),12E‐ene (3): ½ α25D‐134 (c 0.100, CHCl3); IR (KBr) υmax 3387, 2930, 1627, 1240, 922 cm−1; 1H‐NMR (400 MHz, CDCl3): δ 0.87 (1H, m, H‐9), 0.94 (1H, m, H‐8b), 1.07 (3H, d,J =4.4 Hz, H‐16), 1.13 (3H, s, H‐18), 1.07 (3H, s, H‐19), 1.32 (1H, dd, J =8.4, 10. 0 Hz, H‐ 11), 1.59 (1H, m, H‐7b), 1.66 (1H, m, H‐8a), 1.70 (3H, s, H‐20), 1.74 (1H, m,H‐4), 1.78 (1H, m, H‐1β), 1.91 (1H, m, H‐2), 2.32 (1H, m, H‐ 1α), 2.39 (1H, m, H‐7a), 4.21 (1H, t,J= 3.2 Hz, H‐3), 4.24 (1H, s, H‐ 14), 4.91 (1H, s, H‐17a), 4.92 (1H, d,J= 6.0 Hz, H‐5), 5.06 (1H, s, H‐ 17b), 5.80 (1H, d,J= 10.8 Hz, H‐12);13C‐NMR (100.61 MHz, CDCl3):
δ14.4 (C‐16), 15.5 (C‐19), 16.2 (C‐20), 22.2 (C‐10), 23.9 (C‐8), 24.6 (C‐ 11), 29.1 (C‐18), 33.0 (C‐9), 34.5 (C‐7), 36.8 (C‐2), 48.2 (C‐1), 48.8 (C‐ 4), 71.5 (C‐5), 77.8 (C‐14), 78.2 (C‐3), 84.6 (C‐15), 109.1 (C‐17), 122.8 (C‐12), 132.8 (C‐13), 150.6 (C‐6); ESI‐MSm/z359 [M + Na]+, 375 [M + K]+.
2.4
|Preparation of lathyrol (4)
Compound1(1.52 mol) in MeOH/KOH (potassium hydroxide) (5%) was stirred for 3 h at room temperature. The reaction was worked up by dilution with water (20 mL) and extraction with EtOAc (8 × 20 mL). The organic layers were dried with Na2SO4, evaporated and puri- fied by column chromatography (12 g, n‐hexane/EtOAc 1:0 to 0:1, CombiFlash system), and further recrystallisation with EtOAc/n‐hex- ane to give 390 mg of4(1.18 mol, yield 78%).Lathyrol, 3β,5α,15β‐
trihydroxy‐lathyr‐6(17),12E‐en‐14‐one(4): m.p. 174–176°C (EtOAc/n‐ hexane); ½ α25D+ 116.0 (c 0.100, CHCl3); IR (KBr): υmax 3414, 1640, 1622, 1411, 1269, 909 cm−1; ESI‐MS m/z 335 [M + H]+. This compound was identified by comparison of the obtained NMR spec- troscopic data with literature values.26
2.5
|General preparation of lathyrol derivatives
A solution of lathyrol (4) in dry triethylamine and dichloromethane (CH2Cl2) (1:1) was stirred for 5 min at room temperature before addi- tion of the appropriate acyl chloride or anhydride and a catalytic amount of 4‐dimethylaminopyridine (DMAP). The mixture was stirred for 2–18 h, at room temperature or under reflux (60°C, nitrogen atmo- sphere). The reaction mixture was concentrated under vacuum at 40°C and the obtained residue was purified by flash column chroma- tography, preparative TLC or HPLC.
2.5.1
|Preparation of euphoboetirane C (5)
Obtained from reaction of 4 (21 mg, 0.060 mmol) with 70 μL (0.71 mmol) of 2‐furoyl chloride. The mixture was purified by CC (SiO2, 4 g,n‐hexane/EtOAc (1:0 to 0:1), Combiflash system) and pre- parative TLC (n‐hexane/EtOAc, 7:3) to afford 25 mg (0.046 mmol, 77% yield) of an amorphous white powder. ½ α25D+ 128 (c 0.100, CHCl3);1H‐NMR (400 MHz, CDCl3):δ1.00 (3H, d,J =6.7 Hz, CH3‐ 16), 1.16 (3H, s, CH3‐19), 1.20 (1H, m, H‐9), 1.22 (3H, s, CH3‐18), 1.44 (1H, dd, J =8.7, 11.5 Hz, H‐11), 1.68 (1H, m, H‐1β), 1.84 (3H, s, CH3‐20), 1.92 (1H, m, H‐7b), 2.26 (1H, m, H‐7a), 2.40 (1H, m, H‐ 2), 2.86 (1H, dd, J= 3.2, 10.0 Hz, H‐4), 3.14 (1H, m, H‐1α), 4.95 (1H, s, H‐17a), 4.97 (1H, s, H‐17b), 5.79 (1H, t,J= 3.2 Hz, H‐3), 6.14 (1H, d,J= 9.9 Hz, H‐5), 6.43 (1H, dd,J= 1.6, 3.3 Hz, H‐4′), 6.48 (1H, dd, J= 1.6, 3.3 Hz, H‐4″), 7.01 (1H, d,J= 3.2 Hz, H‐3″), 7.12 (1H, d, J= 3.0 Hz, H‐3′), 7.48 (1H, s, H‐5″), 7.55 (1H, s, H‐5′);13C‐NMR (100.61 MHz, CDCl3):δ13.2 (C‐20), 16.3 (C‐16, C‐19), 25.9 (C‐10), 28.6 (C‐11), 29.0 (C‐18), 36.3 (C‐9), 37.6 (C‐2), 49.6 (C‐1), 52.6 (C‐4), 69.2 (C‐5), 81.2 (C‐3), 115.0 (C‐17), 111.9 (C‐4″), 112.1 (C‐4′), 118.3 (C‐3″), 118.5 (C‐3′), 134.8 (C‐13), 144.2 (C‐2′), 144.0 (C‐2″), 144.4 (C‐6), 145.6 (C‐5′), 146.5 (C‐5″), 157.5 (C‐1″), 157.9 (C‐1′); ESI‐MS m/z545 [M + Na]+, 561 [M + K]+.
2.5.2
|Preparation of euphoboetirane D (6)
Obtained from reaction of 4 (25 mg, 0.075 mmol) with 70 μL (0.65 mmol) of 2‐thiophenecarbonyl chloride. The residue was puri- fied by CC [SiO2, 4 g,n‐hexane/EtOAc (1:0 to 0:1), Combiflash sys- tem] and preparative TLC (n‐hexane/EtOAc 7:3) to give 26 mg (0.046 mmol, 61% yield) of an amorphous white powder. ½ α25D + 189 (c 0.090, CHCl3); 1H‐NMR (400 MHz, CDCl3): δ 1.02 (3H, d, J = 6.7 Hz, CH3‐16), 1.22 (3H, s, CH3‐18), 1.16 (3H, s, CH3‐19), 1.23 (1H, m, H‐9), 1.45 (1H, dd, J = 9.0, 11.1 Hz, H‐11), 1.70 (1H, m, H‐1β), 1.87 (3H, s, CH3‐20), 2.42 (1H, m, H‐2), 2.86 (1H, dd, J = 3.2, 10.1 Hz, H‐4), 3.12 (1H, m, H‐1α), 4.95 (1H, s, H‐17a), 5.00 (1H, s, H‐17b), 5.79 (1H, t, J = 3.2 Hz, H‐3), 6.16 (1H, d, J = 9.8 Hz, H‐5), 7.01 (1H, t, J = 4.3 Hz, H‐4″), 7.07 (1H, t, J = 4.2 Hz, H‐4′), 7.49 (1H, d, J = 4.9 Hz, H‐3″), 7.53 (1H, d, J = 4.9 Hz, H‐3′), 7.58 (1H, d, J = 3.1 Hz, H‐5″), 7.67 (1H, d, J = 4.8 Hz, H‐5′); 13C‐NMR (100.61 MHz, CDCl3): δ 13.2 (C‐20), 14.7 (C‐16), 16.3 (C‐19), 25.9 (C‐10), 28.5 (C‐11), 29.0 (C‐18), 36.4 (C‐9), 37.8 (C‐2), 49.8 (C‐1), 52.6 (C‐4), 80.4 (C‐3), 86.9 (C‐15), 114.7 (C‐17), 123.2 (C‐2′), 123.5 (C‐2″), 127.7 (C‐4″), 127.9 (C‐4′), 132.5 (C‐3″), 132.7 (C‐3′), 133.6 (C‐5″), 133.7 (C‐5′), 134.7 (C‐13), 144.1 (C‐6), 161.1 (C‐1″), 161.4 (C‐1′). ESI‐MSm/z 577 [M + Na]+, 593 [M + K]+.
2.5.3
|Preparation of euphoboetirane E (7) and 12‐
hydroxyboetirane A (12)
Obtained from reaction of 4 (24 mg, 0.073 mmol) with 83 mg (0.44 mmol) of 2‐naphtoyl chloride. The residue was purified by CC
[SiO2, 4 g,n‐hexane/EtOAc (1:0 to 0:1), Combiflash system] and pre- parative TLC (n‐hexane/EtOAc 4:1, 2×) to give 19 mg of7(0.039 mmol, 54% yield) and 6 mg of12(0.012 mmol, 16% yield) as amorphous white solids.Euphoboetirane E(7): ½ α25D+ 102 (c 0.100, CHCl3); 1H‐ NMR (400 MHz, CDCl3): δ 1.11 (3H, d, J =6.8 Hz, CH3‐16), 1.17 (3H, s, CH3‐18), 1.22 (1H, m,H‐9), 1.23 (3H, s, CH3‐19), 1.46 (1H, dd,J =8.7, 11.4 Hz, H‐11), 1.63 (1H, m, H‐8a), 1.68 (1H, m,H‐1β), 1.83 (3H, s, CH3‐20), 1.96 (1H, m, H‐8b), 1.97 (1H, m, H‐7b), 2.20 (1H, m, H‐2), 2.30 (1H, m, H‐7a), 2.64 (1H, dd, J= 1.7, 10.1 Hz, H‐ 4), 3.11 (1H, m, H‐1α), 3.15 (1H, s, 3‐OH), 4.21 (1H, brs,H‐3), 4.41 (1H, s, 5‐OH), 5.00 (1H, s, H‐17a), 5.01 (1H, s, H‐17b), 6.15 (1H, d, J= 10.2 Hz, H‐5), 8.60 (1H, s, H‐3′), 7.88 (2H, d,J= 8.5 Hz, H‐5′, H‐8′), 7.54 (1H, t,J= 7.3 Hz, H‐6′), 7.60 (1H, t,J= 7.0 Hz, H‐7′), 7.96 (1H, d,J= 8.0 Hz, H‐10′), 8.05 (1H, d,J= 8.6 Hz, H‐11′).13C‐ NMR (100.61 MHz, CDCl3):δ13.3 (C‐20), 14.5 (C‐16), 16.3 (C‐19), 21.3 (C‐8), 25.9 (C‐10), 28.4 (C‐11), 29.0 (C‐18), 36.3 (C‐9), 37.6 (C‐ 2), 49.3 (C‐1), 53.9 (C‐4), 71.4 (C‐5), 79.0 (C‐3), 114.7 (C‐17), 125.4 (C‐11′), 126.9 (C‐6′), 127.0 (C‐4′), 127.9 (C‐8′, C‐5′), 128.7 (C‐7′), 129.5 (C‐10′), 131.6 (C‐3′), 132.6 (C‐13), 135.3 (C‐2′), 135.8 (C‐9′), 144.2 (C‐6), 166.0 (C‐1′). ESI‐MSm/z511 [M + Na]+, 527 [M + K]+.
12‐Hydroxyboetirane A(12):½ α25D+ 56 (c0.100, CHCl3);1H‐NMR (400 MHz, CDCl3):δ 0.55 (1H, d, J = 9.1 Hz, H‐11), 0.65 (1H, m, H‐9), 1.04 (3H, d, J =6.6 Hz, CH3‐16), 1.07 (3H, s, CH3‐18), 1.15 (3H, s, CH3‐19), 1.22 (3H, d, J = 7.7 Hz, CH3‐20), 1.82 (1H, m, H1α), 1.84 (1H, m, H‐7b), 1.91 (1H, m, H‐8a), 2.06 (1H, m, H‐8b), 2.12 (1H, m, H‐1β), 2.16 (1H, m, H‐2), 2.53 (1H, m, H‐7a), 2.74 (1H, m, H‐13), 3.11 (1H, dd, J =3.2, 11.1 Hz, H‐4), 3.51 (1H, s, 3‐ OH), 3.91 (1H, brs, H‐3), 4.75 (1H, d,J= 9.4 Hz, H‐12), 4.92 (1H, s, H‐17a), 5.09 (1H, s, H‐17b), 5.76 (1H, d, J= 11.1 Hz, H‐5), 7.54 (1H, t,J= 7.0 Hz, H‐6′), 7.60 (1H, t,J= 7.1 Hz, H‐7′), 7.87 (2H, d, J= 8.5 Hz, H‐8′, H‐10′), 7.95 (1H, d,J= 7.8 Hz, H‐5′), 8.02 (1H, d, J= 8.6 Hz, H‐11′), 8.58 (1H, s, H‐3′);13C‐NMR (100.61 MHz, CDCl3):
δ13.1 (C‐20), 13.5 (C‐16), 15.5 (C‐10, C‐19), 23.1 (C‐8), 26.6 (C‐11), 29.2 (C‐18), 30.3 (C‐9), 37.7 (C‐2), 38.3 (C‐7), 41.5 (C‐13), 44.2 (C‐1), 55.2 (C‐4), 70.8 (C‐5), 74.6 (C‐12), 75.0 (C‐3), 87.1 (C‐15), 116.0 (C‐17), 125.5 (C‐11′), 126.9 (C‐6′), 127.1 (C‐4′), 127.9 (C‐8′), 128.3 (C‐10′), 128.6 (C‐7′), 129.6 (C‐5′), 131.7 (C‐3′), 132.5 (C‐9′), 135.8 (C‐2′), 147.4 (C‐6), 168.1 (C‐1′), 220.1 (C‐14); ESI‐MSm/z 489 [M –H2O + H]+.
2.5.4
|Preparation of euphoboetirane F (8)
Obtained from reaction of 4 (24 mg, 0.072 mmol) with 70 μL (0.55 mmol) of propionic anhydride. The residue was purified by CC (SiO2, 4 g,n‐hexane/EtOAc (1:0 to 0:1), Combiflash system) and pre- parative TLC (n‐hexane/EtOAc 4:1, 2×) to give 16 mg (0.036 mmol, 50% yield) of a colourless oil.½ α25D + 117 (c0.100, CHCl3);1H‐NMR (400 MHz, DMSO):δ 0.80 (3H, d,J =10.4 Hz, CH3‐16), 0.92 (3H, t, J= 7.4 Hz, H‐3″), 1.01 (3H, t, J= 7.5 Hz, H‐3′), 1.10 (3H, s, CH3‐ 19), 1.11 (1H, m, H‐8b), 1.16 (3H, s, CH3‐18), 1.16 (1H, m, H‐7b), 1.18 (1H, m, H‐9), 1.43 (1H, dd, J =8.5, 11.6 Hz, H‐11), 1.50 (1H, t,J =12.4 Hz, H‐1β), 1.57 (3H, s, CH3‐20), 1.85 (1H, m, H‐8a), 2.08
(1H, m, H‐7a), 2.10 (2H, m, H‐2″), 2.14 (1H, m, H‐2), 2.30 (2H, m, H‐ 2′), 2.55 (1H, dd, J= 2.9, 10.2 Hz, H‐4), 2.87 (1H, dd,J =9.1, 11.9 Hz, H‐1α), 4.69 (1H, s, H‐17a), 4.90 (1H, s, H‐17b), 5.34 (1H, s, H‐3), 5.93 (1H, d,J= 10.4 Hz, H‐5), 7.76 (1H,s, H‐12);13C‐NMR (100.61 MHz, DMSO):δ8.7 (C‐3″), 9.0 (C‐3′), 12.4 (C‐20), 14.2 (C‐16), 16.3 (C‐19), 21.4 (C‐8), 25.1 (C‐10), 26.9 (C‐2″), 27.0 (C‐2′), 28.1 (C‐11), 28.6 (C‐ 18), 34.8 (C‐9), 35.5 (C‐7), 37.0 (C‐2), 49.1 (C‐1), 52.5 (C‐4), 66.7 (C‐ 5), 79.7 (C‐3), 87.4 (C‐15), 114.8 (C‐17), 133.2 (C‐13), 145.0 (C‐6), 152.5 (C‐12), 173.0 (C‐1″), 173.6 (C‐1′), 203.9 (C‐14); ESI‐MSm/z 469 [M + Na]+, 485 [M + K]+.
2.5.5
|Preparation of euphoboetirane G (9)
Obtained from reaction of 4 (25 mg, 0.075 mmol) with 70 μL (0.55 mmol) of diethylcarbamoyl chloride. The residue was purified by CC (SiO2, 4 g,n‐hexane/EtOAc 1:0 to 0:1, CombiFash system) to yield 24 mg (0.055 mmol, 73% yield) of an amorphous white solid.
α
½ 25D + 64 (c 0.090, CHCl3); 1H‐NMR (400 MHz, CD3OD):δ 1.07 (3H, d,J =6.7 Hz, CH3‐16), 1.11 (6H, m, H‐3′, H‐3″), 1.17 (3H, s, CH3‐18), 1.18 (3H, s, CH3‐19), 1.25 (1H, m, H‐9), 1.47 (1H, dd, J =8.5, 11.7 Hz, H‐11), 1.56 (1H, dd, J =10.5, 13.7 Hz, H‐1β), 1.64 (3H, s, CH3‐20), 1.80 (1H, m, H‐8a), 1.91 (1H, m, H‐8b), 2.04 (1H, m, H‐7b), 2.07 (1H, m, H‐2), 2.34 (1H, m, H‐7a), 2.46 (1H, dd, J =2.7, 10.6 Hz, H‐4), 3.07 (1H, t,J =11.4 Hz, H‐1α), 3.17 (1H, m, H‐2″), 3.29 (1H, m, H‐2′), 4.10 (1H, s, H‐3), 4.67 (1H, s, H‐17a), 4.87 (1H, s, H‐17b), 5.93 (1H, d, J= 10.5 Hz, H‐5), 7.60 (1H, brs, H‐12). 13C‐ NMR (100.61 MHz, CD3OD):δ12.8 (C‐20), 13.5 (C‐3″), 13.8 (C‐3′), 14.2 (C‐16), 16.7 (C‐19), 22.9 (C‐8), 27.1 (C‐10), 29.2 (C‐18), 30.1 (C‐11), 35.9 (C‐7), 37.9 (C‐9), 39.1 (C‐2), 42.2 (C‐2′), 43.2 (C‐2″), 50.5 (C‐1), 55.8 (C‐4), 69.9 (C‐5), 80.6 (C‐3), 90.5 (C‐15), 114.1 (C‐ 17), 135.7 (C‐13), 147.3 (C‐6), 154.3 (C‐12), 158.1 (C‐1′), 203.3 (C‐ 14); ESI‐MSm/z456 [M + Na]+, 472 [M + K]+.
2.5.6
|Preparation of euphoboetirane H (10)
Obtained from reaction of 4 (17 mg, 0.052 mmol) with 70 μL (0.74 mmol) of ethylchloroformate. The residue was purified by CC (SiO2, 4 g,n‐hexane/EtOAc 1:0 to 0:1, CombiFash System) to obtain 5 mg (0.012 mmol, yield 23%) of a white amorphous solid.½ α25D+ 27 (c0.090, CHCl3); IR (KBr)υmaxcm−1;1H‐NMR (400 MHz, CDCl3):δ
1H‐NMR (400 MHz, CDCl3):δ1.12 (3H, s, CH3–19), 1.16 (1H, m, H‐ 8b), 1.18 (3H, s, CH3‐18), 1.20 (3H, d,J= 6.8 Hz, CH3‐16), 1.24 (3H, t, J = 7.2 Hz, CH3‐3′), 1.25 (1H, m, H‐9), 1.49 (1H, dd, J = 8.3, 11.0 Hz, H‐11), 1.75 (1H, t, J= 13.2 Hz, H‐1β), 1.83 (3H, s, CH3‐ 20), 1.99 (1H, m, H‐8a), 1.97 (1H, m, H‐7b), 2.18 (1H, m, H‐2), 2.46 (1H, t, J = 3.9 Hz, H‐4), 2.56 (1H, m, H‐7a), 3.38 (1H, dd, J = 6.7, 13.1 Hz, H‐1α), 4.12 (2H, m, CH2‐2′), 4.49 (1H, t, J = 3.6 Hz, H‐3), 5.46 (1H, d, J = 3.1 Hz, H‐5), 5.08 (1H, s, H‐ 17a), 5.12 (1H, s, H‐17b), 6.39 (1H, d, J = 11.2 Hz, H‐12); 13C‐ NMR (100.61 MHz, CDCl3):δ 12.5 (C‐16), 12.6 (C‐20), 14.3 (C‐3′), 16.0 (C‐19), 22.6 (C‐8), 26.9 (C‐10), 28.7 (C‐11), 29.2 (C‐18), 33.8 (C‐7), 34.5 (C‐9), 37.8 (C‐2), 43.3 (C‐1), 48.3 (C‐4), 64.9 (C‐2′),
74.1 (C‐5), 83.1 (C‐3), 90.4 (C‐15), 114.4 (C‐17), 132.8 (C‐13), 144.9 (C‐6), 145.6 (C‐12), 153.2 (C‐1′), 194.4 (C‐14); ESI‐MSm/z 407 [M + H]+.
2.5.7
|Preparation of euphoboetirane I (11) and 12‐
hydroxyboetirane D (15)
Obtained from reaction of 4 (25 mg, 0.076 mmol) with 73 mg (0.37 mmol) of 1‐adamantanecarbonyl chloride. The residue was puri- fied by CC [SiO2, 15 g,n‐hexane/EtOAc (1:0 to 0:1)] and preparative TLC (n‐hexane/EtOAc 4:1, 2×) to give 22 mg of 11 (0.044 mmol, 58% yield) and 5 mg of15(0.01 mmol, 13% yield) as amorphous white solids. Euphoboetirane I (11): ½ α25D+ 22 (c 0.100, CHCl3); 1H‐NMR (400 MHz, CDCl3):δ1.13 (3H, d,J =4.4 Hz, CH3‐16), 1.13 (3H, s, CH3‐18), 1.18 (3H, s, CH3‐19), 1.40 (1H, dd, d,J= 8.9, 11.1 Hz, H‐ 11),1.65–1.99 (15H, brs, H‐3′to H‐11′), 2.00 (3H, s, H‐20), 2.13 (1H, m, H‐2), 2.42 (1H, d, J= 8.2 Hz, H‐4), 3.09 (2H, m, H‐1), 4.06 (1H, brs, H‐3), 4.35 (1H, s, H‐17a), 4.87 (1H, s, H‐17b), 5.72 (1H, d, J = 9.4 Hz, H‐5); 1H‐NMR (400 MHz, DMSO): δ 0.94 (3H, d, J= 6.8 Hz, CH3‐16), 1.08 (3H, s, CH3‐18), 1.12 (3H, s, CH3‐19), 1.13 (1H, m, H‐9), 1.39 (1H, dd, J = 8.6, 11.8 Hz, H‐11), 1.44 (1H, dd, J =11.2, 13.2 Hz, H‐1β), 1.54 (3H, s, CH3‐20), 1.62 (1H, m, H‐8a), 1.62 and 1.75 (12H, two brs, H‐3′, H‐5′, H‐7′, H‐8′, H‐10′, H‐11′), 1.79 (1H, m, H‐8b), 1.88 (1H, m, H‐7a), 1.89 (1H, m, H‐2), 1.91 (3H, brs, H‐4′, H‐6′, H‐9′), 2.04 (1H, m, H‐7b), 2.28 (1H, dd, J = 1.8, 10.6 Hz, H‐4), 2.92 (1H, t, J = 10.8 Hz, H‐1α), 3.84 (1H, d, J= 7.2 Hz, 3‐OH), 3.95 (1H, m, H‐3), 4.55 (1H, s, H‐17a), 4.81 (1H, s, H‐17b), 5.48 (1H, s, 15‐OH), 5.99 (1H, d, J= 9.6 Hz, H‐5), 7.53 (1H, brs, H‐12);13C‐NMR (100.61 MHz, CDCl3):δ13.3 (C‐20), 14.6 (C‐16), 16.2 (C‐19), 19.0 (C‐8), 25.6 (C‐10), 28.0 (C‐4′, C‐6′, C‐9′), 29.9 (C‐18), 34.3 (C‐7), 36.1 (C‐9), 36.5 and 38.9 (C‐3′, C‐5′, C‐7′, C‐8′, C‐10′, C‐11′), 37.1 (C‐2), 48.7 (C‐1), 55.6 (C‐4), 69.9 (C‐5), 77.8 (C‐3), 113.9 (C‐17), 135.1 (C‐13), 144.5 (C‐6), 178.1 (C‐1′); ESI‐ MSm/z519 [M + Na]+, 535 [M + K]+.
12‐Hydroxyboetirane D(15):½ α25D + 18 (c0.100, CHCl3);1H‐NMR (400 MHz, CDCl3):δ 0.50 (1H, d,J= 9.2 Hz, H‐9), 0.59 (1H, m, H‐ 11), 1.04 (3H, d,J= 4.4 Hz, H‐16), 1.04 (3H, s, H‐18), 1.10 (3H, s, H‐19), 1.17 (3H, d,J= 8.0 Hz, H‐20), 1.68 and 1.85 (12H, two brs, H‐3′, H‐5′, H‐7′, H‐8′, H‐10′, H‐11′), 1.80 (1H, m, H‐1α), 1.81 (1H, m, H‐8b), 1.90 (1H, m, H‐8a), 1.84 (2H, m, H‐7), 2.00 (3H, brs, H‐4′, H‐6′, H‐9′), 2.10 (1H, t,J= 12.6 Hz, H‐1β), 2.35 (1H, m, H‐2), 2.68 (1H, m, H‐13), 2.86 (1H,dd, J = 2.8, 11.2 Hz, H‐4), 3.46 (1H, s, 3‐ OH), 3.75 (1H, s, H‐3), 4.70 (1H, d,J= 9.2 Hz, H‐12), 4.70 (1H, s, H‐ 17a), 4.96 (1H, s, H‐17b), 5.38 (1H, d,J= 11.2 Hz, H‐5);13C‐NMR (100.61 MHz, CDCl3):δ 13.1 (C‐20), 13.5 (C‐16), 15.4 (C‐19), 15.5 (C‐10), 23.0 (C‐8), 26.6 (C‐9), 28.0 (C‐4′, C‐6′, C‐9′), 29.2 (C‐18), 30.3 (C‐11), 36.6 and 38.9 (C‐3′, C‐5′, C‐7′, C‐8′, C‐10′, C‐11′), 37.7 (C‐2), 38.2 (C‐7), 41.5 (C‐13), 44.2 (C‐1, C‐2′), 55.2 (C‐4), 69.5 (C‐5), 74.5 (C‐12),74.9 (C‐3), 87.0 (C‐15), 115.4 (C‐17), 147.3 (C‐6), 179.6 (C‐1′), 220.1 (C‐14); ESI‐MSm/z 519 [M– H2O + Na]+, 535 [M – H2O + K]+.
2.5.8
|Preparation of 12 ‐ hydroxyboetirane B (13) and 12 ‐ hydroxyboetirane C (14)
Obtained from reaction of 4 (25 mg, 0.076 mmol) with 70 μL (0.47 mmol) of 4‐(trifluoromethyl)benzoyl chloride. The residue was purified by CC (SiO2, 10 g,n‐hexane/EtOAc (1:0 to 0:1) and prepara- tive TLC (n‐hexane/EtOAc 4:1, 2×) to give 10 mg of13(0.019 mmol, 25% yield) and 11 mg of14(0.021 mmol, 28% yield) as white amor- phous solids.12‐Hydroxyboetirane B(13):½ α25D+ 35 (c0.100, CHCl3);
1H‐NMR (400 MHz, CDCl3):δ 0.54 (1H, d, J =9.2 Hz, H‐11), 0.63 (1H, m, H‐9), 1.01 (3H, d,J =6.4 Hz, H‐16), 1.07 (3H, s, H‐18), 1.15 (3H, s, H‐19), 1.20 (3H, d, J= 8.0 Hz, H‐20), 1.68 (1H, m, H‐8b), 1.77 (1H, m, H‐1α), 1.81 (1H, m, H‐8a), 2.08 (1H, m, H‐1β), 2.12 (1H, m, H‐7a), 2.26 (1H, m, H‐2), 2.50 (1H, m, H‐7b), 2.74 (1H, m, H‐13), 3.11 (1H, dd, J= 3.6, 10.5 Hz, H‐4), 3.98 (1H, d,J= 11.2 Hz, H‐5), 4.65 (1H, s, H‐17a), 4.79 (1H, d, J= 9.2 Hz, H‐12), 4.89 (1H, s, H‐ 17b), 5.72 (1H, t, J= 3.2 Hz, H‐3), 7.72 (2H, d,J= 8.2 Hz, H‐4′), 8.20 (2H, d, J = 8.1 Hz, H‐3′); 13C‐NMR (100.61 MHz, CDCl3): δ 13.2 (C‐20), 13.9 (C‐16), 15.0 (C‐19), 15.4 (C‐10), 23.0 (C‐8), 26.9 (C‐11), 29. 1 (C‐18), 35.1 (C‐9), 37.6 (C‐2), 37.8 (C‐7), 41.7 (C‐13), 45.4 (C‐1), 56.6 (C‐4), 66.3 (C‐5), 74.7 (C‐12), 80.8 (C‐3), 86.7 (C‐15), 113.3 (C‐17), 121.5 (C‐6′), 125.7 (C‐4′), 130.3 (C‐3′), 133.2 (C‐5′), 134.8 (C‐2′), 151.1 (C‐6), 165.7 (C‐1′), 220.8 (C‐14); ESI‐MS m/z 507 [M–H2O + H]+.
12‐Hydroxyboetirane C(14):½ α25D + 38 (c0.100, CHCl3);1H‐NMR (400 MHz, CDCl3):δ0.53 (1H, d, J =9.2 Hz, H‐11), 0.62 (1H, m, H‐ 9), 1.02 (3H, d,J =6.6 Hz, H‐16), 1.12 (3H, s, H‐18), 1.04 (3H, s, H‐ 19), 1.20 (3H, d,J= 7.7 Hz, H‐20), 1.79 (1H, m, H‐1α), 1.84 (1H, m, H‐1β), 1.90 (1H, m, H‐8a), 1.99 (1H, m, H‐2), 2.01 (1H, m, H‐8b), 2.15 (1H, m, H‐7a), 2.50 (1H, m, H‐7b), 2.73 (1H, m, H‐13), 3.07 (1H, dd, J= 3.3, 11.2 Hz, H‐4), 3.88 (1H, t,J= 3.2 Hz, H‐3), 4.74 (1H, d, J= 9.2 Hz, H‐12), 4.85 (1H, s, H‐17a), 5.06 (1H, s, H‐17b), 5.73 (1H, d, J = 11.2 Hz, H‐5), 7.69 (2H, d, J = 8.2 Hz, H‐4′), 8.12 (2H, d, J = 8.1 Hz, H‐3′); 13C‐NMR (100.61 MHz, CDCl3): δ 13.1 (C‐20), 13.5 (C‐16), 15.5 (C‐10, C‐19), 23.1 (C‐8), 26.6 (C‐11), 29.2 (C‐18), 30.3 (C‐9), 37.7 (C‐2), 38.3 (C‐7), 41.5 (C‐13), 44.1 (C‐1), 54.9 (C‐4), 71.3 (C‐5), 74.6 (C‐12), 75.1 (C‐3), 87.0 (C‐15), 116.2 (C‐17), 122.5 (C‐6′), 125.6 (C‐4′), 130.4 (C‐3′), 133.7 (C‐5′), 134.9 (C‐2′), 147.2 (C‐ 6), 166.5 (C‐1′), 220.5 (C‐14). ESI‐MSm/z507 [M–H2O + H]+.
2.6
|Biological assays 2.6.1
|Cell lines and cultures
L5178Y mouse T‐lymphoma cells (ECACC catalog no. 87111908, US FDA, Silver Spring, MD, USA) were transfected with the pHa MDR1/A retrovirus. The MDR1‐expressing cell line was selected by culturing the infected cells with 60 ng/mL of colchicine (Sigma‐Aldrich Chemie GmbH, Steinheim, Germany), to maintain the MDR phenotype expression. L5178Y (parental, PAR) mouse T‐cell lymphoma cells and the humanMDR1‐transfected subline were cultured in McCoy's 5A supplemented with 10% heat‐inactivated horse serum, 100 U/LL‐
glutamine, and 100 mg/L penicillin/streptomycin mixture, all obtained from Sigma Aldrich. The human colon adenocarcinoma cell lines (Colo205 parental, and Colo 320/MDR‐LRP expressing MDR1), were purchased from LGC Promochem, Teddington, UK. The cells were cul- tured in RPMI 1640 medium supplemented with 10% heat‐inactivated fetal bovine serum, 2 mML‐glutamine, 1 mM sodium pyruvate and 100 mM HEPES. The semi‐adherent human colon cancer cells were detached with 0.25% trypsin and 0.02% ethylenediaminetetraacetic acid (EDTA) for 5 min at 37°C.
2.6.2
|Antiproliferative assays
The antiproliferative effects of all compounds were tested in a range of decreasing concentrations using both mouse lymphoma and human colon adenocarcinoma cell lines as experimental models. First, the compounds were diluted in 100μL of medium. The maximum tested concentration of each compound was 100μM. Then cells were dis- tributed into 96‐well flat‐bottomed microtiter plates at concentrations of 6 × 10³and 100μL of medium were added to each well, with the exception of medium and cell control wells. The microtiter plates were initially incubated at 37°C for 72 h and, at the end of the incubation period, 20 μL of MTT (thiazolyl blue tetrazolium bromide, Sigma‐ Aldrich Chemie GmbH) solution {5 mg/ml in phosphate‐buffered saline (PBS)] was added to each well and incubated for another 4 h.
Then, 100μL of 10% SDS (sodium dodecyl sulfate, Sigma) solution [10% in 0.01 M hydrochloric acid (HCl)] was added into each well, and the plates were further incubated overnight at 37°C. Cell growth was determined by measuring the optical density (OD) at 550 nm (ref.
630 nm) with a Multiscan EX ELISA reader (Thermo Labsystems, Cheshire, WA, USA). The percentage of inhibition of cell growth was determined according to equation (1). All experiments were performed in triplicate. The results were expressed as the mean ± standard devi- ation (SD), and the half maximal inhibition concentration (IC50) values were obtained by best fitting the dose‐dependent inhibition curves in GraphPad Prism 5 software. Only data from analysis withR2> 0.90 were presented.
100− ODsample−ODmedium control
ODcell control−ODmedium control
× 100 (1)
2.6.3
|Rhodamine ‐ 123 accumulation assay
Mouse T‐lymphoma cells or human colon adenocarcinoma cells were adjusted to a density of 2 × 10⁶cells/mL, re‐suspended in serum‐free McCoy's 5A medium or RPMI 1640, respectively, and distributed in 500μL aliquots into Eppendorf centrifuge tubes. Then, 10μL of test compounds were added at two concentrations (2 or 20 μM) and verapamil (positive control, EGIS Pharmaceuticals PLC, Budapest, Hungary) was added at 20μM. Dimethyl sulphoxide (DMSO) at 4%
was also added as solvent control. The samples were incubated for 10 min at room temperature, after which 10μL of rhodamine‐123 (5.2μM final concentration) were added. After 20 min of incubation at 37°C the samples were washed twice, resuspended in 500μL of
PBS and analysed by flow cytometry (Partec CyFlow Space Instru- ment, Partec GmbH, Münster, Germany). The resulting histograms were evaluated regarding mean fluorescence intensity (FL‐1), SD, both FSC and SSC parameters, and the peak channel of 20000 individual cells belonging to the total and the gated populations. The fluores- cence activity ratio (FAR) was calculated on the basis of the quotient between FL‐1 of treated/untreated resistant cell line (MDR1‐ transfected mouse lymphoma or Colo320 human colon adenocarci- noma cells) over the respective treated/untreated sensitive cell line (PAR mouse lymphoma or Colo205 human colon adenocarcinoma cells), according to equation (2).
FAR¼FL1MDRtreated=FL1MDRuntreated
FL1PARtreated=FL1PARuntreated (2)
2.6.4
|Drug combination assay
Doxorubicin (2 mg/mL, Teva Pharmaceuticals, Budapest, Hungary) was serially diluted in the horizontal direction as previously described, starting with 8 μg/mL. The resistance modifier was subsequently diluted in the vertical direction, starting with 20μg/mL. The dilutions of doxorubicin were made in a horizontal direction in 100μL, and the dilutions of the resistance modifiers vertically in the microtiter plate in 50μL volume. The cells were re‐suspended in culture medium and dis- tributed into each well in 50μL containing 1 × 10⁴cells, with the exception of the medium control wells, to a final volume of 200μL per well. The plates were incubated for 48 h at 37°C in a CO2incuba- tor and at the end of the incubation period, the cell growth was deter- mined by the MTT staining method, as described earlier. Drug interactions were evaluated according to Chou using the CalcuSyn v2.2 software.27Each dose–response curve (for individual agents as well as combinations) was fit to a linear model using the median effect equation, in order to obtain the median effect value (corresponding to the IC50) and slope (m). Goodness‐of‐fit was assessed using the linear correlation coefficient,r, and only data from analysis with r> 0.90 were presented. The extent of interaction between drugs was expressed using the combination index (CI), where CI = 1 represents additive effect and CI > 1 antagonism. CI < 1 represents synergism where 0.1 < CI < 0.3 = strong synergism; 0.3 < CI < 0.7 = synergism;
0.85 < CI < 0.9 = slight synergism.
3
|R E S U L T S A N D D I S C U S S I O N 3.1
|Phytochemical study
Euphorbia boeticaaerial parts were studied with the aim of finding novel effective compounds for overcoming MDR in cancer cells.
Briefly, the powdered plant was exhaustively extracted with MeOH.
This crude residue was suspended in MeOH/H2O (1:1) and extracted with EtOAc. The EtOAc soluble fraction was subjected to silica gel flash chromatography to afford 10 crude fractions.8Due to the high complexity of these fractions, preliminary 1H‐NMR analysis was
performed in order to prioritise those that were of the most interest.28 Although as complex as the spectra appeared, preliminary1H‐NMR spectra showed that fraction E, obtained withn‐hexane/EtOAc (7:3) was very rich in macrocyclic diterpenes (Supporting Information, Figure S1). Characteristic signals could be observed at δ 6.5–4.5, which were assignable to olefinic protons and protons geminal to acyl functions, found in macrocyclic diterpenes that generally appear as polyesters. Moreover, it could also be recognised the signals for vinylic and acetyl methyls displayed as singlets atδ2.1–1.6, and other methyl group signals atδ1.2–0.7. Nevertheless, the isolation of macrocyclic diterpenes is a difficult and laborious task since these compounds often appear as a complex mixture of structurally related polyesters, chlorophylls, triterpenes and steroids. In particular, the removal of chlorophylls is amongst the most troublesome and time consuming process in natural products isolation and purification. Several method- ologies have been proposed to remove chlorophylls from crude extracts or fractions, which include liquid–liquid partition, repeated column chromatography, solid phase extraction using different adsor- bents, or the use of activated charcoal that carries the risk of loss of important compounds. Polyamide resins have been used to adsorb apolar compounds, in batches or packed in chromatographic col- umns.28 Therefore, in order to remove chlorophylls, fraction E was subjected to a polyamide‐6 column chromatography eluted with mix- tures of MeOH/H2O of decreasing polarity (1:1, 3:2, 7:3, 4:1 and 1:0). Fractions obtained with MeOH/H2O (3:2 and 7:3) contained the bulk of diterpenes, as showed by a TLC analysis. As a result of the removal of chlorophylls, it was possible to observe on the TLC plates, the typical black or dark brown spots after spraying with H2SO4/MeOH (1:1) followed by heating. Fractions eluted with MeOH/H2O (4:1 and 1:0) were rich in chlorophylls and were studied no further. This procedure allowed the straightforward isolation, in larger amounts, of the new diterpene polyester euphoboetirane B (1) and Euphorbia factor L15 (herein named euphoboetirane A,2) that was previously isolated fromEuphorbia lathyris.25
Compounds1and2(Figure 1) were obtained as white crystals and displayed very similar spectroscopic data. The13C‐NMR and DEPT spectra of euphoboetirane B (1) exhibited 27 signals corresponding to: seven methyl groups, five methylenes, seven methines (two oxy- genated atδC65.9 and 80.1 and one olefinic atδC146.8) and eight quaternary carbons (two olefinic atδC134.3 and 144.5, one oxygen- ated atδC92.5, one carbonyl atδC197.0 and three ester carbonyl groups atδC169.9, 170.6 and 173.9). The1H‐NMR spectrum showed signals for four methyl groups: one secondary at δH 0.87 (d, J= 6.7 Hz), two tertiary (δH1.12 and 1.14) and one vinylic methyl group displayed as singlet atδH1.66. Two oxymethine protons (δH
5.57 t, J= 3.2 Hz; 6.05, d, J= 10.3 Hz) and three olefinic protons (δH4.70 s, 4.96 s; 6.46 d,J= 11.4 Hz) could also be observed. The major difference between NMR data of compounds1and2was the presence of signals corresponding to a propanoyl group in compound 1(δH2.32 m; 1.12 t, J= 7.4 Hz andδC173.9, 27.9, 9.1) instead of an acetyl group located at C‐3 in compound2. The structure of1was confirmed by 1H‐1H COSY, HMQC and HMBC experiments that allowed the unequivocal assignment of all 1H and13C signals. The
relative stereochemistry of all tetrahedral centres was found to be identical to those of euphoboetirane A (2)25 through a NOESY spectrum.
3.2
|Derivatives of lathyrol
Molecular derivatisation of macrocyclic diterpenes is regarded as an important way to obtain a high number of homologous compounds towards an increasing knowledge on structure–activity relationships in P‐gp‐modulating activity. Therefore, in order to obtain a small set of lathyrol derivatives and taking advantage of the chemical functions of this compound, euphoboetirane B (1) was reduced, using LiAlH4, and hydrolysed in a MeOH solution of KOH, to afford 14β‐
hydroxylathyrane (3), a new lathyrane‐type polyalcohol, and lathyrol (4), respectively (Figure 1). Using lathyrol (4) as a starting material and different acylation reagents, seven new derivatives were obtained: three diacylated, named euphoboetiranes C, D and F (5,6 and8) and four monoacylated, named euphoboetiranes E, G and H
(7,9–11). While performing the referred reactions, some acylated derivatives were further modified undergoing conjugate addition of water to theα,β‐unsaturated system, giving rise to four new com- pounds, named 12‐hydroxyboetiranes A–D (12–15), (Figure 1).
Lathyrol (4) was identified by comparison of its spectroscopic data with those reported in the literature.2614β‐Hydroxylathyrane (3) was obtained as white amorphous powder with½ α25D −134.0. The spectro- scopic data of 3 resembled those achieved for lathyrol (4).26 As expected, in the1H‐NMR spectrum of3, the most remarkable differ- ence was the presence of a new singlet atδH4.24 (H‐14). In the
13C‐NMR, the presence of a signal atδC77.8 and the disappearance of the ketone resonance atδC207.1, together with the upfield shifts of C‐12 (Δδ = −17.1 ppm), C‐13 (Δδ = −4.4 ppm) and C‐15 (Δδ = −3.4 ppm) were consistent with the introduction of a new hydroxyl group at C‐14. The relative stereochemistry of all tetrahedral centres was found to be identical to those of compound1, except at C‐14, the new tetrahedral centre. In this way, assuming the α‐
orientation for H‐4 as a reference point,26the NOESY cross‐peaks between H‐4/H‐2, H‐3/H‐2 and H‐2/H‐14 established the α‐
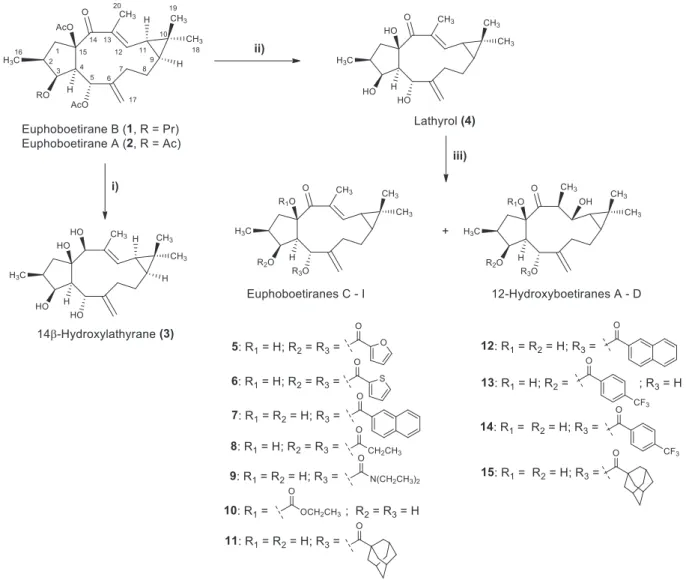
FIGURE 1 Chemical structures of lathyrane diterpenes (1 and 2) isolated from Euphorbia boetica aerial parts and preparation of 14β‐
hydroxylathyrane (3), lathyrol (4) and derivatives (5–15). Reagents and conditions: (i) LiAlH4, THF, 0°C, 1 h; (ii) KOH/MeOH (5%), room temperature, 3 h; (iii) acylating reagent, DMAP (cat.), TEA/CH2Cl2(1:1), room temperature or under reflux (60°C, nitrogen atmosphere), 2–18 h
configuration of these protons. No correlation was found between H‐ 4 and H‐5, which corroborated the preservation of theβ‐configuration for H‐5.
The structural elucidation of euphoboetiranes C‐I (5–11) was achieved by comparison of their spectroscopic data with those of lathyrol (4) and euphoboetirane A (1). However, it should be noted that due to the poor spectral resolution of some compounds when dis- solved in CDCl3, other solvents had also to be used to overcome this problem, namely CD3OD, pyridine‐d5 and DMSO‐d6 (Supporting Information).
Besides the signals due to the different acyl groups, the analysis of
1H‐NMR and13C‐NMR spectra showed, as expected, very similar data regarding the diterpenic core. When comparing with lathyrol (4), the most remarkable differences in the1H‐NMR spectrum were related to the H‐3 and H‐5 chemical shifts that were displayed downfield when these positions were acylated. These differences were in agree- ment with the effects expected for the acylation of the hydroxyl groups and were also observed in euphoboetirane B (1). Regarding the13C‐NMR spectra, it was crucial to analyse the carbonyl signals in order to make conclusions on the number of acyl groups. The location of the acyl groups was definitely confirmed by the long‐range correlations between the carbonyl signals and the corresponding H‐3 and/or H‐5 oxymethine protons. The relative stereochemistry of all tetrahedral centres was found to be identical to those of euphoboetirane B (1).
When comparing the NMR spectroscopic data of 12‐ hydroxyboetiranes A–D (12–15) to those of the already described ester derivatives 1,2 and5–11, several differences could be indi- cated. Indeed, in the 1H‐NMR spectra of compounds 12–15 both H‐12 and the olefinic methyl (CH3‐20) signal resonances disap- peared, while new signals atδH4.70–4.79 (t, J≈ 9.2 Hz) and δH
1.17–1.22 (d,J≈7.9 Hz) could be observed. Likewise, these differ- ences were also obvious in the13C‐NMR spectra, which showed the presence of two extra methine carbons atδc≈74.6 andδc≈41.5, together with the disappearance of the signals corresponding to the olefinic carbons C‐12 and C‐13. Moreover, a downfield chemical shift (Δδ+ 23 ppm) was also observed for the ketone signal that was in agreement with the absence of theα,β‐unsaturated system.
These structural features were confirmed by the analysis of1H‐1H COSY, HMQC and HMBC spectra that allowed the unambiguous assignment of all proton and carbon resonances. These spectroscopic data led to conclusion that 12‐hydroxyboetiranes A–D (12–15) dif- fered from the remaining lathyrol derivatives by having a hydroxyl group at C‐12 instead of the C‐12/C‐13 endocyclic double bond.
The relative configuration of 12‐hydroxyboetiranes A–D (12–15) was deduced through the analysis of their NOESY spectra and by comparison with euphoboetirane B (1), assuming, as usual, the α‐
orientation for H‐4. In this way, the strong nuclear Overhauser interactions between H‐4/H‐3, H4/H‐2, H‐2/CH3‐18 and at CH3‐ 18/H‐11 established the α configuration of these protons. The α‐
orientation of the new chiral centres C‐12 and C‐13 was supported by nuclear Overhauser interactions between CH3‐18/H‐12, H‐12/
H‐11, H‐12/H‐13 and H13/H11. The β‐orientation of H‐5 was
suggested by the absence of a NOESY correlation between this pro- ton and H‐4 and was corroborated byJ4,5value which were similar to that of related diterpenes.25,26
3.3
|Biological activity
The diterpenes 1–15 were investigated for their antiproliferative activity in order to select non‐cytototoxic concentrations to perform the P‐gp modulation experiments. Antiproliferative assays were per- formed using the MTT test on chemosensitive (PAR) and human MDR1‐gene transfected mouse lymphoma cells (MDR), and on sensi- tive and resistant human colon adenocarcinoma cell lines (sensitive Colo205 and Colo320 MDR cells). The results are summarised in Table 1 and expressed in IC50 values. The selectivity index [SI = IC50(MDR cells)/IC50(PAR cells)] was also calculated. As can be observed, except for euphoboetirane D (6) that showed an IC50value of 6.9μM against Colo205 cell line, all compounds exhibited weak antiproliferative activities (IC50values higher than 10μM). Moreover, the compounds did not show significant IC50disparities between the assayed parental and MDR cell lines (SI values between 2.37 and 0.80), indicating that they were similarly active against both parental and resistant cells.
The ability of compounds to modulate the transport activity of P‐ gp was evaluated on both human MDR1‐gene transfected L5178Y mouse lymphoma and on MDR human colon adenocarcinoma cells.
Reversion of MDR was performed by flow cytometry, using a standard functional assay that measures rhodamine‐123 (a fluorescent ana- logue of the anti‐cancer drug doxorubicin) accumulation on the cells.
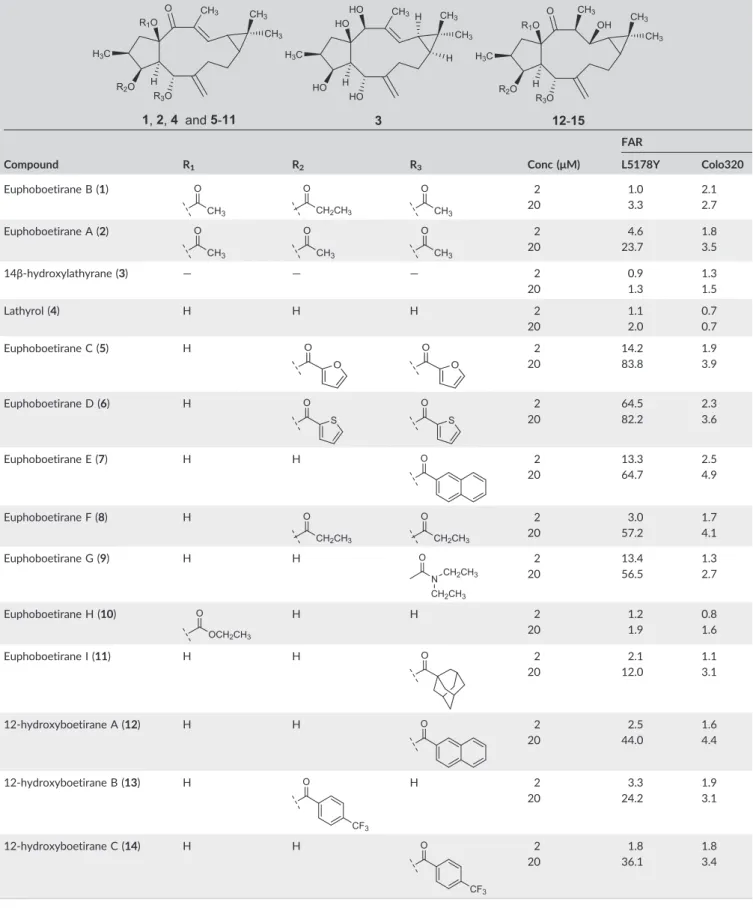
Verapamil (20μM) was used as positive control, since it was a well‐ known MDR modifier. The compounds were tested at two concentra- tions (2 and 20μM). The FAR values were used to assess the P‐gp modulating potential. Compounds were considered to be active when presenting FAR values higher than 1, and assigned as strong P‐gp modulators when FAR values are higher than 10.29,30However, it should be emphasised that FAR values obtained with L5178Y‐MDR mouse lymphoma cells, where P‐gp is highly expressed, could not be comparable with those obtained on human Colo320 MDR cells because P‐gp expression is much lower on the latter.
The results are summarised in Table 2. As it can be observed, when tested at 20μM euphoboetiranes A (2), euphoboetiranes C–G (5–9) and 12‐hydroxyboetiranes A–C (11–14) were found to be strong P‐ gp modulators on L5178Y‐MDR mouse lymphoma cells, displaying FAR values ranging from 12.0 to 83.8. At this concentration, the stron- gest effects were found for euphoboetiranes C (5, FAR = 83.8), D (6, FAR = 82.2) and E (7, FAR = 64.7), which showed a manifold activity when compared to that of verapamil (FAR = 17.7 at 20μM). Compar- ing the FAR values of the acylated diterpenes5–11and the parental alcohol lathyrol (4, FAR = 2.0 at 20μM), the majority of them showed a 6 to 42‐fold increase of the activity. 14β‐Hydroxylathyrane (3) and euphoboetirane B (1) were found to be barely active, even at the highest concentration (FAR = 3.3 and 1.3, respectively).
When tested at 2μM, euphoboetirane D (6) exhibited a remark- able reversion activity (FAR = 64.5). Moreover, at the lowest concen- tration, euphoboetiranes C (5, FAR = 14.2), E (7, FAR = 13.3) and G (9, FAR = 13.4) showed also significant MDR reversal activities (Table 2).
Concerning the activity on MDR human colon adenocarcinoma cells (Colo320), euphoboetiranes A (2), C–F (5–8) and I (11), and 12‐ hydroxyboetiranes A–C (12–14) were the most effective, when tested at 20μM (FAR values between 3.1 and 4.9), although less active than verapamil (FAR = 9.0). At 2 μM, the most active compounds were euphoboetiranes D (5, FAR = 2.3) and E (7, FAR = 2.5).
Further studies were conducted in order to assess the combined effect of diterpenes1–15and the anticancer drug doxorubicin, and evaluate the type of interaction, using the checkerboard microplate method on L5178Y‐MDR mouse lymphoma cells. The extent of inter- actions between the anticancer drug and compounds1–15was calcu- lated as proposed by Chou,27 and expressed using the CI values (Table 3). All compounds had a synergistic interaction with the anti- cancer drug (CI values among 0.19 and 0.86). Strong synergistic effects were found for compounds5,6and8–13. Interestingly, the majority of the most active compounds on the P‐gp modulation assay were also those that developed higher synergism with doxorubicin.
However, the polyalcohols 3 and 4 also exhibited low CI values (0.29 and 0.27, respectively) even though they displayed a weak P‐ gp modulation activity (FAR = 1.3 and 2.0 respectively, at 20μM), sug- gesting that different mechanisms may be involved in this process.
The drug combination assay was also applied on Colo320 cell line
for diterpenes 1, 2, 5–8 and 11–14, which revealed the highest MDRin vitromodulation activities on the referred cell line. Curiously, all compounds displayed a synergistic interaction, excepting euphoboetiranes C (5) and E (7). In fact, diterpenes5and7showed additive (CI = 0.95) and antagonistic effects (CI = 1.18), respectively, despite being two of the most active modulators of P‐gp activity on Colo320 cell line (FAR values 3.9 and 4.9, respectively, at 20μM).
Regarding the chemical structure of the diterpenic core, the analysed diterpenes could be divided in two main sets: compounds with Δ6,17 and Δ12 double bonds (1–4, and 5–11, euphoboetirane series) and compounds with an exocyclic Δ6,17 double bond and absence of theΔ12unsaturation, being hydroxylated at C‐12 (13–15, 12‐hydroxyboetirane series). Among the two sets, the compounds differ in the type, number and location of the acyl groups. These struc- tural features led to different physicochemical properties, such as lipo- philicity, molecular volume and topological polar surface area, which may condition the P‐gp modulatory ability of the compounds, and were generally considered to be important non‐specific requirements for MDR reversal activity.31,32Nevertheless, the identification of spe- cific structural characteristics of the different diterpenic scaffolds is also of major importance to better understand structure–activity rela- tionships in P‐gp modulation activity. Accordingly, our group reported an improved pharmacophore model based on the analysis of several in‐house macrocyclic diterpenes isolated from Euphorbia spe- cies.10,33,34 In these studies, in silico approaches identified several structural features that may correlate with experimental modulation TABLE 1 Antiproliferative activity of compounds1–15on mouse T‐lymphoma (L5178Y‐PAR and L5178Y‐MDR) cells and human colon ade- nocarcinoma (Colo205 and Colo320) cells
Compound
L5178Y mouse T‐lymphoma cells Colon adenocarcinoma cells
IC50a(μM) IC50a(μM)
PAR MDR SIb Colo205 Colo320 SIb
Euphoboetirane B (1) 15.2 ± 2.4 18.2 ± 3.3 1.20 23.1 ± 4.1 25.4 ± 0.5 1.10
Euphoboetirane A (2) 18.6 ± 0.3 16.0 ± 2.0 0.86 55.0 ± 4.7 > 50 —
14β‐hydroxylathyrane (3) 60.7 ± 6.8 59.7 ± 3.4 0.98 > 50 65.1 ± 7.6 —
Lathyrol (4) 78.7 ± 2.7 62.8 ± 16.1 0.80 > 100 > 100 —
Euphoboetirane C (5) 27.6 ± 0.9 29.6 ± 1.2 1.07 15.3 ± 2.4 22.0 ± 0.4 1.44
Euphoboetirane D (6) 36.4 ± 1.0 45.7 ± 6.5 1.26 6.9 ± 0.4 16.4 ± 0.2 2.37
Euphoboetirane E (7) 40.9 ± 4.9 50.6 ± 0.4 1.24 11.2 ± 1.1 12.9 ± 1.2 1.15
Euphoboetirane F (8) 32.0 ± 2.4 45.4 ± 1.6 1.42 22.9 ± 3.2 24.6 ± 1.0 1.07
Euphoboetirane G (9) > 100 > 100 — 39.1 ± 4.9 58.7 ± 4.6 1.50
Euphoboetirane H (10) 37.0 ± 6.8 > 100 — > 100 > 100 —
Euphoboetirane I (11) 34.2 ± 1.6 49.4 ± 5.4 1.44 10.4 ± 0.6 12.7 ± 0.1 1.22
12‐Hydroxyboetirane A (12) 54.4 ± 3.8 > 100 — > 50 > 50 —
12‐Hydroxyboetirane B (13) 57.2 ± 2.2 70.5 ± 16.5 1.23 46.5 ± 3.2 47.9 ± 3.8 1.03
12‐Hydroxyboetirane C (14) 57.3 ± 4.0 > 100 — 55.8 ± 8.7 > 50 —
12‐Hydroxyboetirane D (15) 48.0 ± 2.8 52.2 ± 3.2 1.09 48.9 ± 4.6 > 50 —
DMSO (1%) > 100 > 100 — > 100 > 100 —
aValues of IC50are the mean ± standard deviation of three independent experiments.
bSelectivity index (SI) = IC50(MDR cells)/IC50(PAR cells) or IC50(Colo320 cells)/IC50(Colo 320 cells).
TABLE 2 Effect of compounds1–15on the P‐glycoprotein (P‐gp) mediated rhodamine‐123 efflux, on L5178Y‐MDR mouse T‐lymphoma cells and on MDR human colon adenocarcinoma (Colo320)
Compound R1 R2 R3 Conc (μM)
FAR
L5178Y Colo320
Euphoboetirane B (1) 2 1.0 2.1
20 3.3 2.7
Euphoboetirane A (2) 2 4.6 1.8
20 23.7 3.5
14β‐hydroxylathyrane (3) — — — 2 0.9 1.3
20 1.3 1.5
Lathyrol (4) H H H 2 1.1 0.7
20 2.0 0.7
Euphoboetirane C (5) H 2 14.2 1.9
20 83.8 3.9
Euphoboetirane D (6) H 2 64.5 2.3
20 82.2 3.6
Euphoboetirane E (7) H H 2 13.3 2.5
20 64.7 4.9
Euphoboetirane F (8) H 2 3.0 1.7
20 57.2 4.1
Euphoboetirane G (9) H H 2 13.4 1.3
20 56.5 2.7
Euphoboetirane H (10) H H 2 1.2 0.8
20 1.9 1.6
Euphoboetirane I (11) H H 2 2.1 1.1
20 12.0 3.1
12‐hydroxyboetirane A (12) H H 2 2.5 1.6
20 44.0 4.4
12‐hydroxyboetirane B (13) H H 2 3.3 1.9
20 24.2 3.1
12‐hydroxyboetirane C (14) H H 2 1.8 1.8
20 36.1 3.4
(Continues)
of P‐gp. Therefore, the presence of a hydrophobic core, hydrogen bond acceptor groups and one or two aromatic moieties was highlighted as essential features for the interaction with P‐gp drug binding site.10,33Moreover, the conformation of the macrocyclic scaf- fold, the charge distribution within the molecule and the acyl or hydroxyl substitution patterns are also key factors for the biological activity and considered to be responsible for the increased affinity that some molecules display with P‐gp.34
It is interesting to note that the most active diterpenes were those with aromatic moieties (5–7,12and14) exhibiting FAR values ranging from 44.0 (12) to 83.8 (5) for L5178Y MDR cells and from 3.6 (6) to 4.9 (7) for Colo320 cells (at 20μM). Euphoboetiranes C (5) and D (6) are bioisosteric compounds, diacylated at C‐3 and C‐5, which differ only by the presence of oxygen instead of a sulphur atom at the five membered aromatic ring of the ester moieties. This fact clearly changed the logP(5.3 vs. 6.5), topological polar surface area (116.2 TABLE 2 (Continued)
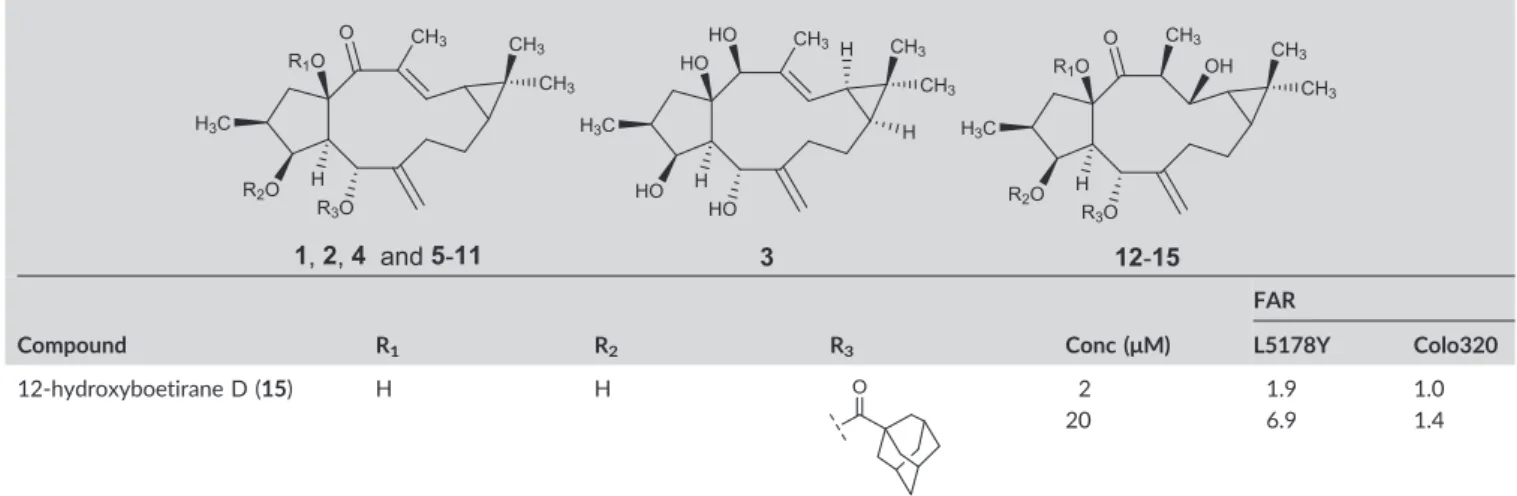
Compound R1 R2 R3 Conc (μM)
FAR
L5178Y Colo320
12‐hydroxyboetirane D (15) H H 2 1.9 1.0
20 6.9 1.4
Verapamil 20μM (positive control): FAR (L5178Y‐MDRcells) = 17.7, FAR (Colo320 cells) = 9.0; DMSO 2% (neg. control): FAR (L5178Y‐MDR cells) = 0.8, FAR (Colo320 cells) = 0.6
TABLE 3 Type and strength of the interaction between compounds1–15and doxorubicin on L5178Y‐MDR mouse T‐lymphoma cells and on MDR human colon adenocarcinoma (Colo320)
Compound
L5178Y‐MDR Colo320 cells
CIa Interaction CIa Interaction
Euphoboetirane B (1) 0.42 Synergism 0.52 Synergism
Euphoboetirane A (2) 0.32 Synergism 0.34 Synergism
14β‐hydroxylathyrane (3) 0.29 Strong synergism — —
Lathyrol (4) 0.27 Strong synergism — —
Euphoboetirane C (5) 0.22 Strong synergism 0.95 Additive
Euphoboetirane D (6) 0.16 Strong synergism 0.29 Strong synergism
Euphoboetirane E (7) 0.42 Synergism 1.18 Antagonism
Euphoboetirane F (8) 0.22 Strong synergism 0.39 Synergism
Euphoboetirane G (9) 0.20 Strong synergism — —
Euphoboetirane H (10) 0.19 Strong synergism — —
Euphoboetirane I (11) 0.25 Strong synergism 0.37 Synergism
12‐Hydroxyboetirane A (12) 0.29 Strong synergism 0.44 Synergism
12‐Hydroxyboetirane B (13) 0.25 Strong synergism 0.55 Synergism
12‐Hydroxyboetirane C (14) 0.86 Slight synergism 0.64 Synergism
12‐Hydroxyboetirane D (15) 0.44 Synergism — —
Data are shown as the best combination ratio between the tested compounds and doxorubicin.
aCombination index (CI) values at 50% of growth inhibition (ED50) were determined by using the CalcuSyn software to plot four to five data points to each ratio. The extent of interaction between drugs was expressed using the CI. CI = 1 and CI > 1 represent additive effect and antagonism, respectively. CI < 1 represents synergism where 0.1 < CI < 0.3 = strong synergism; 0.3 < CI < 0.7 = synergism; 0.85 < CI < 0.9 = slight synergism.