ORIGINAL PAPER
Machine imports, technology adoption, and local spillovers
Gábor Békés1 · Péter Harasztosi2
© The Author(s) 2019
Abstract
In developing economies import can be the primary source of adopting new tech- nologies and modern production equipment. Using a uniquely compiled Hungar- ian firm-level dataset, we investigated whether firms’ decision to import a specific machine is influenced by the local accumulation of experience in that same imported machine. Our results suggested that an additional local importer in the firm’s vicin- ity increases the probability of importing that particular machine considerably. Dis- tance plays a key mediating role as firms, especially in small cities, learned mostly from neighboring peers. We also found that even within a type of imported machine, the source country of the product matters a great deal. Finally, the extent of spillo- ver effects was found to vary a great deal both with respect to the importing firm as well as the composition of peers. Larger, foreign owned and internationalized firms are the ones that benefit from having importing firms in their vicinity, while small and domestically owned firms could actually be adversely affected by peer effects.
Our results could be indicative for policy-makers interested in indirect impact of technology upgrade subsidy programs. We found that such indirect effects do exist.
However, they are centered on large to large firm interactions. As smaller sized firms producing for the domestic market do not benefit much from import spillovers, poli- cies aimed at helping such firms may not rely on these indirect effects.
Keywords Machine imports · Trade-related spillovers · Agglomeration JEL Classification R12 · F14 · D22
Electronic supplementary material The online version of this article (https ://doi.org/10.1007/s1029 0-019-00365 -y) contains supplementary material, which is available to authorized users.
* Péter Harasztosi harasztosi@gmail.com
1 Central European University, Hungarian Academy of Sciences and CEPR, Budapest, Hungary
2 European Commission JRC Ispra, Via Fermi 2749, 21027 Ispra, Italy
1 Introduction
Capital goods, machines and manufacturing technologies are produced in a few developed economies. Countries who do take part in developing these technolo- gies can benefit from them via knowledge spillovers as suggested by endogenous growth theories which highlight the external nature of technology (see Romer 1990; Rivera-Batiz and Romer 1991). For developing countries, who do not produce manufacturing technology themselves, a key vehicle for spillovers and growth are imports. Indeed, Coe and Helpman (1995), Acharya and Keller (2009) find large spillover effects from imports from foreign, R&D-abundant countries on domestic productivity at the aggregate and sector levels. Importing technology embedded in machines, materials leads to increased productivity also at the level of the firm (see Halpern et al. 2013, 2015).
This paper looks at how accumulated knowledge of machine imports affects new adoptions and dissects channels of this spillover. Focusing on the imports of machines allows to gain a better understanding on a possible source of productiv- ity gains and development. In particular, we investigate how investment to a par- ticular machine may be encouraged by earlier imports of the same machine car- ried out by local firms. As more and more local firms have imported a particular machine, the easier it is for another firm to be informed about the advantages and the specifics of the technology. In addition, if the machine is available from many countries, firms learn whether it is worth substituting a machine from one country with one from another. If these learning channels are at work, we hypothesize that in the absence of peers a firm would be less inclined to import a given machine or it would import it much later.
To answer these questions, we compile a dataset that matches machine level import observations to Hungarian manufacturing firms for 1992–2003. The period provides several advantages. It starts with Hungary’s early transition years, prior to which foreign machine was not generally available to domestic firms. Possibly, every machine imported in the early 1990s can be regarded as technologically more modern and more advanced than previously installed machines. In addition, the tran- sition invited waves of foreign direct investments, which introduced new imported machines and technology to many sectors. This is not only true for green-field investment, but also for a portion of the privatized companies as well where firms upgraded their production facilities through imports. In the examined period, foreign machines indeed play an important role in manufacturing investments. The share of machine investment of manufacturing firms is over 60%, see Fig. 6 in the Appendix.
Our results indicate that the presence of a previous importer of a specific machine in the close vicinity increases the probability of a firm importing the same machine. The presence of such peers within 1 km of the firm increases import probability by 0.3 percentage points. This effect decreases with the dis- tance of the peers and increases in the number of peers. An additional peer within 1 km of the firm increases the probability of same machine import by 0.27 per- centage points. Compared to the baseline probability of machine import, peer presence suggests a 26% increase.
We also investigate how the decision about the country from which the chosen machine is to be imported from is influenced by peer presence. The results show that firms tend to import a particular machine from the country with 0.6 percent- age points higher probability if there is a firm in the vicinity which have already imported the machine from the same country.
There is great deal of evidence suggesting that the extent of knowledge spillo- vers varies by key features of both the receiver and the sender. To better under- stand the nature of the spillovers we will hence, investigate the heterogeneity of both the importing firms and that of the early importing peers. Our analysis sug- gests spillovers go from more to less productive firms, as local first importers of a specific machine are more productive than followers. We also find that the prob- ability of choosing the machine that others have already imported in the vicinity is higher if the firm is exporter, larger in size, foreign owned or more recently estab- lished. Regarding the heterogeneity of peers, we see much smaller differences as the importing probably is somewhat higher when peers are of medium size, foreign owned, exporter and more recently established.
This study contributes by broadening the scope of spillovers in trade behavior in showing that they not only encourage exporting behavior but can affect the import- ing technology embedded in machines. We build on previous findings in the trade spillover literature. For exporters, empirical evidence suggests that location can be an important factor influencing internationalization. Agglomeration economies can help firms overcome up-front costs and engage in trade.1 Benefits arise from sharing indivisible goods and facilities and a larger variety of more specialized inputs, from better matching of the right employment or intermediate inputs and services and from learning and the diffusion of knowledge about, e.g., production technologies and market opportunities (Duranton and Puga 2004). A positive effect of agglom- eration for exports was documented in Mexico (Aitken et al. 1997; Cardoso-Var- gas 2017), in Argenina (Pupato 2007) in France (Koenig et al. 2010) in Belgium (Dumont et al. 2010) in China (Fernandes and Tang 2014; Mayneris and Poncet 2015) and in Hungary (Harasztosi 2016).
There is ample evidence on the productivity enhancing effect of imports also at the firm level.2 The sources of these positive effects can be different mechanisms.
Some explain the increased productivity with the technology embedded in the inputs and the wide variety imports make accessible (Halpern et al. 2015; Goldberg et al.
2010; Bas and Strauss-Kahn 2014). Others highlight the R&D-generating nature of imports. MacGarvie (2006), e.g., uses patent citations to show that importing firms are more likely to generate new patents. More recently, Halpern et al. (2013) shed light on the productivity-enhancing effect of the imported technology on machines.
Despite the advantages only a fraction of firms import. For firms to be able to trade internationally, they need to be competitive and highly productive. This is
1 Agglomeration economies can either increase the firms’ productivity or can decrease the fixed costs of trade entry, or both.
2 Amongst others, Kasahara and Rodrigue (2008) find evidence for Indonesia, Amiti and Konings (2007) for Chile and Kugler and Verhoogen (2009) for Columbian firms.
often explained by the sizable up-front cost that only the most productive ones can afford. See, e.g., Bernard and Jensen (1999), Bernard et al. (2007), Amiti and Kon- ings (2007) or Castellani et al. (2010). Also, future trading firms are already bigger, employ more skilled and better paid workers and are more capital intensive than their peers in the same sector who do not trade.
We know little about the effect of agglomeration on importing activity at the firm level, especially for capital items, even though importers may face a harder challenge than exporters. First, evidence suggests that the productivity premium needed to start importing is higher than in the case of exporting (Altomonte and Békés 2010).
Second, while exporters often experiment their profitability on foreign markets for a year or two (Eaton et al. 2011), machine importers make long term investment decisions which might result in a higher fixed cost. Firms deciding to invest in an imported technology face the screening cost of potential foreign suppliers, the cost of the technology itself and adapting equipment to foreign conditions and standards.
They also require information about the skill requirements for workers and operat- ing difficulties (see Eaton and Kortum 2001; Bas and Berthou 2012). While this information may be available via the manufacturer, local industry experience with a given machine may also prove beneficial and encourage adoption. Recent empirical evidence for Sweden suggests positive local effect of peers on import activity (Pateli 2016). There is also evidence on the effect of peers on the country choice of Hun- garian importers located in the capital city, as shown by (Bisztray et al. 2018) for a smaller set of countries.
There is some evidence at the firm level that the characteristics of the location affect the adoption of advanced machines.3 These studies, however, do not relate machine adoption to trade activity. They suggest that the rate and beneficial effects of technology diffusion differ across location characteristics: regions distant from the innovation leader adopt the technology much later, while successful adoption depends on other location characteristics such as the level of existing knowledge and technology, the absorption capacity of the location and the availability of a skilled workforce. Kelley and Helper (1999) show a positive effect of localized economies on the numerically controlled machine adoption of U.S. firms. Also, No (2008) takes a similar approach and investigates the adoption of advanced manufacturing technologies (design, fabrication and inspection) across Canadian firms.4
The rest of the paper is structured as follows. Section 2, which discusses empiri- cal strategy is followed by Sect. 3 introducing the dataset. It gives details on data compilation and the construction of the main variables and portrays spatial distribu- tion of machine imports. Section 4 discusses the results, limitations and offers addi- tional insights into the sources and heterogeneity of the spillovers. Finally, Sect. 5 concludes.
3 For an aggregate approach see, e.g., Comin et al. (2012). and Keller (2002)
4 There is some evidence on the import of manufacturing scheme, but not machines. Holl et al. (2010, 2013) who focuses on the adoption of the Japanese just-in-time strategy in Spain and reveal considerable role of location and congestion.
2 Empirical strategy
In this section, we explain the empirical setup used for the main exercise in this paper.
2.1 The estimation setup
Consider an economy made up of s ∈ S sectors. Each sector is defined by its tech- nologies and in relation to that, the set of machines it uses. In each sector, firms may choose to upgrade their technology by importing a machine from this set. To choose one or many machines the firm balances the cost of import and installation against the future benefits. We assume that an imported machine is always a technology upgrade and that firms are uncertain about the net benefit due to lack of information.
Without information firms may not perceive the benefits at all.
Firms may import machines that are industry specific, such as weaving machines in textiles; they may also import general technology machines such as packag- ing equipment. We will define “core machines” those machines that are imported by firms in a single two-digit industry only. Non-core machines are those that are imported by firms in the given industry but also by firms in other industries. In our empirical work, we will first focus on core machines, and then expand to include non-core machines.
For a firm i, let us define peers as firms that operate in the same industry as firm i and are located in proximity of firm i (such as being in the same city or being less than 1 km apart). Firms can gather information about machines from peers—firms in the same industry located in their proximity—who have imported them previ- ously. Experience of these peers can reveal the true benefits of importing: the past act of importing and using a particular machine shows that it could be a good busi- ness decision to consider for firm i as well.
If there is information in machine use of peers, firms can benefit from knowledge spillovers, and hence, firms that have peers with experience in a particular machine are more likely chose to upgrade technology with this particular machine. This implies that comparing two machines in the firm’s choice-set, the one with greater available information from peers is more likely to be imported by the firm.
To do this comparison, we follow Bisztray et al. (2018) and model the effect of peer presence on the probability that firm i at a given location chooses new import machine m from the set of machines it has not imported at time t as linear hazard and so compare machine choices within the firm:
where yimt is an indicator variable for the first import of machine m by firm i at time t and 𝐗r is a vector of spillover variables representing the presence of machine importers in the past years in the vicinity r before the firm’s import decision at t.
The unit of observation is a firm-machine-time triple (denoted with subscript imt) yimt =𝛽0+∑ (1)
r
𝛽r𝐗rimt+𝛼it+𝜇mt+𝜀imt
with m defined at the sector of the firm and includes all machines ever used in sec- tor s. Time dimension t is defined for the machine m imported by firm i. This means that for a machine, which never gets imported, yimt is zero for all years the firm is observed. For machine importers, yimt =1 for the year m is imported, zero before.
As a first approach we calculate X as a vector that comprises of a set of dummy variables indicating the presence of imports of m before time t by other firms within the distances of r1 , r2 , .. (in km) to firm i. In a later step, vector X is also calculated as a vector showing the number of other firms having imported machine m that are located within the distance of r1 to firm i, the number of importers outside the radius r1 but within the distance r2 and so on.
Equation 1 also includes firm and machine specific interactions with time to control for the average propensity of a firm to import and that of a machine to be imported.
In Eq. 1, the coefficients of interest, 𝛽r , show the effect of previous machine adopters within distance r on the probability of firm i importing machine m.
This effect is identified by comparing various machine purchase options within firms. In this setup, 𝛽r shows how the existence previous adopter of machine m is correlated with the increase in the probability of importing at time t, expressed in percentage points.
We will make a variety of efforts to partial out confounders and get as close to causal interpretation as possible.
For our second approach, we are also interested in the peer effect on the coun- try choice—how local experience from importing a given machine from a given country could affect the firm’s import choice. In this case, we estimate:
where country of origin c for the imported machine is added as an extra dimen- sion. Here, 𝐗rimct is a vector of dummy variables indicating the presence of other firms within distances of r having imported machine m from country c before time t. Alternatively, vector 𝐗imct can also be specified as a count variable representing the number of firms other than i that have imported the same machine. The peers, similarly to same-country peers, are summed over various distances: within r1 km, between distances r1 and r2 , r2 and r3 and so on. Equation 2 also introduces an addi- tional set of fixed effects controlling for country-specific and machine-country spe- cific propensities detailed in the next subsection.
The idea here is to compare import decisions within a firm conditional on firm, machine and country characteristics when local experience varies in terms of country source. It is important to note, the sample is constructed to be condi- tional on machine imports. Without this restriction 𝐗 would surely have the joint task of explaining the choice to import and the country choice. We concentrate only on the latter.
In all estimations, we cluster standard errors at the location level, defined by longitude-latitude coordinates.
y∗imct =𝛽0+∑ (2)
r
𝛽r𝐗rimct+𝛼it+𝜇mt+𝜇ct+𝜇mct+𝜀imct
2.2 Controlling for potential confounders
In this section, let us review the efforts we took to partial out confounding factors.
First, let us consider location specific effects: unobserved local features may cause both past and present adoption. These time-varying location effects are captured by a location × time fixed effect in both equations. Location dummies are defined at the municipal level (in Hungary, there are over 3 thousand municipalities for 10 million inhabitants).
Such fixed effects shall capture a variety of issues, such as local policies that facil- itate investments, creation of special clusters or introducing favorable municipal tax schemes.5 The availability of scientists or abundant skilled labor who help adopting and operating new machines can also be such an unobserved factor. Reliable infra- structure (electricity supply), sufficient local input suppliers or local customers can also make installing a new machine worthwhile. In addition, the spaciousness of the location influences how close are the firms to each other and thus, the probability of knowledge flow is.
In addition, the positive correlation between the number of past and present importers can also be caused by local business cycles. If certain regions in a given period of time are experiencing economic boom while others are in downturn then the positive correlation between the presence of past and present importers can be purely driven by a series of region-specific shocks. Series of persistent local produc- tivity shocks will be a common accelerator of machine imports for all local firms.
However, these underlying shocks need not be necessarily persistent to cause a prob- lem. If local shocks have effect for over two calendar years, a positive correlation will occur that we would falsely identify with spillovers. In addition, such shocks can be foreseen by managers and they can adjust labor, capital and other firm char- acteristics accordingly.
Second, location-specific unobserved heterogeneity may cause identification problems jointly at the industry levels. These sector specific effects will be captured by sector × time and sector × location × time and sector × machine × time effects.
For example, certain sectors are more eager capital users than others, in which case it is more likely that local firms have already imported the necessary machines.
The number of machines we investigate varies per sector, too. This is especially worrisome, if the sector that depends on the specific machine heavily is concen- trated. Then the region hosting these firms will show correlation between past and present import, without firms actually learning from each other. In addition, the pro- pensity to import machines may differ in various sectors.
Third, to manage various country effects, we add country and country×machine interactions with time. We also add country × location × time fixed effects in Eq. 2.
The purpose of these additional fixed effects is to capture the notion that it is easier to import a machine from Germany than from China because of language barrier
5 The Hungarian corporate tax code (Act LXXXI of 1996), encourages investment in backward and developing regions by facilitating local tax credit schemes. The scheme was especially generous in the pre-2002 era. See Békés and Harasztosi (2012).
and distance. However, this may be correlated with locations: there could be factors that can help local access to certain countries, such as geographical or cultural prox- imity, e.g. presence of embassies or trading houses. These relative differences can vary over time, or even over machines.
3 Data and descriptive statistics
This section gives a detailed description about the compilation of the dataset used to estimate Eqs. 1 and 2. The section describes the main variables and provides a descriptive portrait of the spatial distribution of machine imports.
3.1 Compiling the dataset
The empirical analysis is based primarily on the Customs Statistics (CS) as well as financial information at firm level provided by the Hungarian Statistical Office. It contains the universe of exports and imports by Hungarian economic agents between 1992 and 2003. It gives information on yearly trade aggregated to the 6-digit Har- monized System product level and gives the country of origins and destinations as well. The quantity measurements allow the calculation of unit prices. It is important to point out that while trade data is available after 2003, its structure and classifica- tions change after Hungary’s EU accession in 2004. This hinders the investigation to go beyond that date.6
This dataset is merged with firm level information, a panel of Hungarian man- ufacturing firms between 1992–2003 with very detailed firm-level information on balance sheets. It allows to include the following firm level characteristics into the empirical estimations: firm size defined by the average annual employment, foreign ownership indicating majority foreign share in the subscribed capital of the firm and total factor productivity (TFP).7 The dataset provides sectoral classification of NACE rev. 1. For more details on this data see Békés et al. (2011).
To identify events of machine import we rely on the Standard International Trade Classification (SITC) rev. 3. which we match to CS. No. 7 group of SITC classifica- tion titled Machinery and transport equipment that defines capital products used in sector specific production. As in this study the focus is on manufacturing machines only, transport equipment and vehicles are excluded. Anyway, vehicles are less pro- duction-specific and most widely available via wholesalers in Hungary and import- ing them is less likely than procuring them locally. This leaves us with a range of
6 In the Hungarian trade statistics, the classification of the country of origin was replaced to sender country in 2004. This modification affected import statistics by country considerably. Investigation of the 2004 data, the year where both classifications are available, reveals major changes especially in over- seas trade. For example, share of China in imports drops significantly as products manufactured there are traded through European countries, e.g. Germany. For descriptive statistics, see e.g. Csermely et al.
(2012).
7 To calculate total factor productivity we rely on the control function approach proposed by Levinsohn and Petrin (2003).
machines listed in SITC classification from Power generating machinery and equip- ment (71) to Electrical machinery, apparatus and appliances (77).
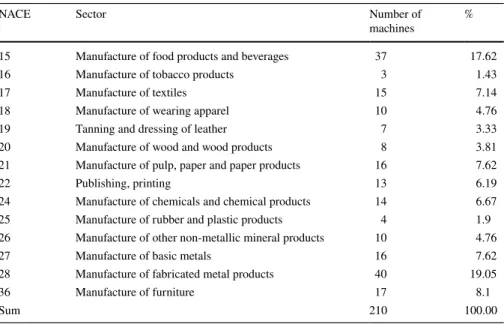
Let us now define a list of machineries that each industrial sector uses by gen- erating it from our import data. As a preliminary step, we consider only a subset of the manufacturing sectors and omit industries where the imported machines can be in fact materials to firms’ final product, i.e. Manufacture of machinery and equipment. See Table 1 for the list of manufacturing sectors considered. We match the set of machines from SITC 71-77 at the 5 digits to each sector by looking at actual machine imports from 1992–2003. A machine is matched to the sector if it is imported by at least 3 firms. Additionally, machines for general industry purposes such as computers or air conditioning units are excluded. We have also checked that the machine is in line with industry activity. That is, matches like Manufacture of textiles (17) and gas-operated metalworking machinery (73742) are not considered for the analysis.
The matching process resulted in allocating 143 individual machines to indus- tries, with Tobacco industry having only 3 and the Fabricated metal products sector having the maximal number of 40 machines. In Table 1 the sum of machines is 210, which implies that we matched one machine to more than one sector. For example industrial sewing machines can be used by both textiles and wearing apparel indus- tries.8 For details on the list of machines, see Table 20 of the Online appendix.
Table 1 Number of machines allocated to manufacturing sectors
NACE Sector Number of
machines %
15 Manufacture of food products and beverages 37 17.62
16 Manufacture of tobacco products 3 1.43
17 Manufacture of textiles 15 7.14
18 Manufacture of wearing apparel 10 4.76
19 Tanning and dressing of leather 7 3.33
20 Manufacture of wood and wood products 8 3.81
21 Manufacture of pulp, paper and paper products 16 7.62
22 Publishing, printing 13 6.19
24 Manufacture of chemicals and chemical products 14 6.67
25 Manufacture of rubber and plastic products 4 1.9
26 Manufacture of other non-metallic mineral products 10 4.76
27 Manufacture of basic metals 16 7.62
28 Manufacture of fabricated metal products 40 19.05
36 Manufacture of furniture 17 8.1
Sum 210 100.00
8 When creating peers we will not concentrate only on within sector peers for two reasons. First, a machine in a related industry can equally inspire imports as within sectors import do. Second, Hungarian sector classification only shows the main activity and not the second and the third product lines of a com- pany. Hence, firms in different but close sectors can actually be in the same sector.
Given the list of machines per sectors we can look at machine importing events at the firm. Only the first import of a machine is considered, subsequent imports afterwards are omitted. To improve reliability of the data and improve economic significance of the research, we omit firms with less than 10 employees on average.
We also make some restrictions on the country dimension. For each machine we consider only the 15 most important trade partners ranked by volume share of imports for that particular machine and only those machines are considered that are imported from at least 3 countries. This restriction ensures that firms have country choices—and only applies when country choice is investigated: when only machine choice is investigated we keep machines from all countries. The partner list con- sist of 35 countries with Germany, Italy and Austria as chief suppliers of imported machines. The list of countries is presented in Table 16.
3.2 Descriptions of machines and machine importers
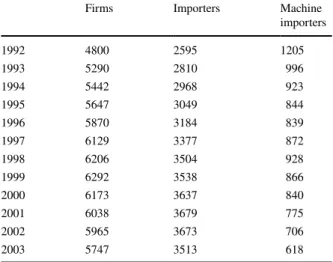
Only a small fraction of manufacturers import machines directly. Table 2 shows the number of firms in the selected manufacturing sample. It shows that only about half of the firms import any goods from abroad, intermediate goods included. Machine importers are even scarcer. Only about fifth of the firms import machines. Note that these are only those firms that import from our industry specific list of machines.
This approach will hence, underestimate their share.
On average, a firm that ever imported (in our period), will on average import 1.7 machines a year. When we look at the firm activity, we observe an importing firm for 6 years on average, and the firm will import a total of 6 different machines. Firms import from 3.2 different countries, on average. The largest number of different machines imported by one firm is 31, and the firm that imports machines from the highest variety of sources imports from 16 countries all together.
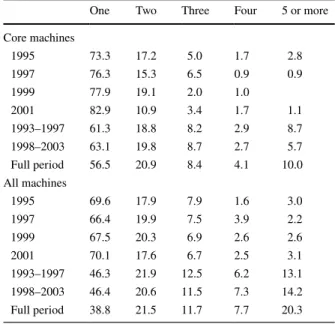
Table 3 provides statistics on importing firms by the number of machines they import. The upper panel concentrates on core machines (used in a single sector)
Table 2 Number of firms by
import activity Firms Importers Machine
importers
1992 4800 2595 1205
1993 5290 2810 996
1994 5442 2968 923
1995 5647 3049 844
1996 5870 3184 839
1997 6129 3377 872
1998 6206 3504 928
1999 6292 3538 866
2000 6173 3637 840
2001 6038 3679 775
2002 5965 3673 706
2003 5747 3513 618
only. We find that while more firms import only one machine, more than 43% of importers are multi-machine importing firms. About 10% of them import 5 or more machines. Looking at imports in shorter period or even in a single year reveals that about 17–27% of the importers import multiple machines in a given year. This pro- vides sufficient within firm variation for our estimation strategy, even when only core machines are considered.
The lower panel shows corresponding statistics for any machine imported.
Patterns are similar to the core machines. As the variety of machines considered increases, consequently the number of firms that import a single machine only decreases. About one third of the importers import more than one machine in a year.
As earlier evidence suggests,9 when we compare importing firms to non- importers, we shall find that these firms are larger and have superior productivity.
Regressing a dummy of being machine importer on firm characteristics, we find that machine importing firms are 110% larger (in terms of the number of employees) and 40% more productive (in terms of total factor productivity)—see details in Table 14 of the Appendix.
The data allows to describe the distribution of the unit prices of the machines firms import. The prices show considerable heterogeneity both across and within the
Table 3 Share of importers by the number of machines imported
The table shows the percentage share of importing firms by the num- ber of machines imported. Statistics are calculated for selected years, periods. The upper panel counts only core machines—imported only by the sector of the firm. Each row totals to 100
One Two Three Four 5 or more
Core machines
1995 73.3 17.2 5.0 1.7 2.8
1997 76.3 15.3 6.5 0.9 0.9
1999 77.9 19.1 2.0 1.0
2001 82.9 10.9 3.4 1.7 1.1
1993–1997 61.3 18.8 8.2 2.9 8.7
1998–2003 63.1 19.8 8.7 2.7 5.7
Full period 56.5 20.9 8.4 4.1 10.0
All machines
1995 69.6 17.9 7.9 1.6 3.0
1997 66.4 19.9 7.5 3.9 2.2
1999 67.5 20.3 6.9 2.6 2.6
2001 70.1 17.6 6.7 2.5 3.1
1993–1997 46.3 21.9 12.5 6.2 13.1
1998–2003 46.4 20.6 11.5 7.3 14.2
Full period 38.8 21.5 11.7 7.7 20.3
9 See, e.g., Castellani et al. (2010), Mayer and Ottaviano (2008) for a broader take, and (Békés et al.
2011) for previous estimations on Hungarian firm level data.
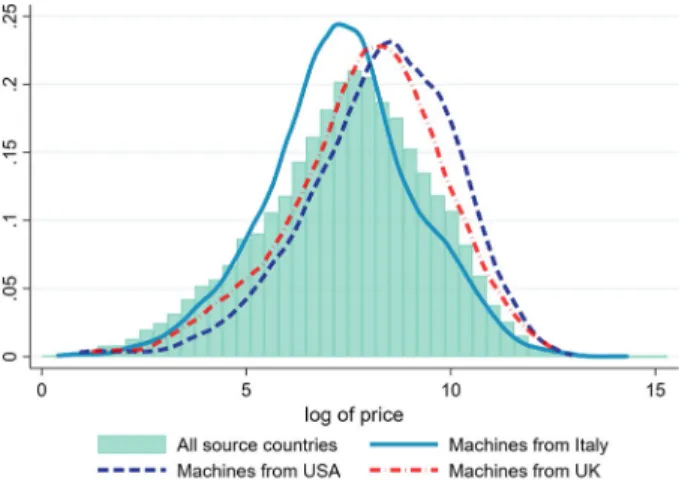
machine category. Average within machine category standard deviation of log price equals standard deviation of all the prices. They vary considerably across countries as well, for at least two reasons. Import prices are recorded including cost, insur- ance and freight (CiF) which suggest that duties and distance increase the price of the machines. Also, prices vary due to the value added and the price of technol- ogy embedded in the machines. Figure 1 illustrates this showing the difference in the price distribution of machines from Italy, USA and UK. Differences may be explained by both differences in shipping costs as well as differences in quality of products shipped from different countries.
3.3 Location of peers
Investigating the effect of peers on importing activity requires heterogeneity across space. If machine imports exhibit stickiness in space, that is, a new machine importer is influenced by previous importers, new importers should be relatively close to previous ones.
The data also includes the location of the firm’s headquarter at the municipality level including postcode.10 Using this information we geo-code the location infor- mation and assign geographical coordinates to each firm at the level of postcode using Geonames.org dataset and using Google Earth. In Hungary most settlements have single post-codes, here the coordinates refer to the center of the settlement.
Most larger cities and agglomerations, however have multiple post codes.11 Also
Fig. 1 Distribution of machine unit prices (in logs and 1992 terms)
10 To identify firms’ location by their headquarters can be problematic in the case of multiple-site firms.
This possibility is investigated in Békés and Harasztosi (2013). They find that in the manufacturing sec- tor the share of multi-site firms in Hungary is negligible.
11 Budapest, the capital city has 160 post codes, Miskolc has 21, Debrecen has 17, Szeged has 15, Győr has 13 and Pécs has 20.
there is a small share of settlements that share the same postcode, hence it is impor- tant to define location by both postcode and settlement. We will call these spatial units postal districts. Geo-coding firms this way enables measuring the shortest dis- tance between them.12 Each such district can be aggregated into larger geographical administrative units: to municipalities, micro-regions or counties. Hungary has 20 counties representing the European Union’s NUTS3 classification (see Table 15 in the Appendix).
Machine importing activity is observed in 2329 postal districts, which is 63% per- cent of all 3658 districts where any production activity in the selected manufacturing sectors can be detected. This is illustrated in Fig. 2 which displays the map of Hun- gary and shows the distribution of the total number of machines imported in each location over the sample period. In over forty districts more than 50 machines get imported. These are predominantly located in larger townships in Hungary. About 100 districts, we see imports between more than 25 but less than 50 machines, over 670 districts have firms importing less than 25 but more than 5 machines. The remaining districts, a bit more than 1500, local firms import 5 machines or less.
As a next step, we look at machine import instances and categorize them according to the existence of previous activities. We use threshold values starting from 1 to 50 km with 5 km steps to investigate within what distances peers are
Fig. 2 Number of imported machines
12 We kept only firms in the sample that do not change location over the period: only 3% of all firms have two or more locations.
most likely to locate. Figure 3 shows the share of imported machines in selected years that do not have peers within a specific distance. As distance of peers can be dependent on the size of a given agglomeration, we show results by three size categories: for firms in the capital, for firms in larger cities (20 county capitals) and all locations smaller.
Take the results for firms in Budapest, the capital city (denoted by the red line with solid dots) and consider the mid-point of 1997. We see that 80% of the machine imports took place without the same machine being imported by peers within 1 km.
This ratio drops sharply to about 20% when we consider peers within a 5 km radius, decreases to a close to zero level around 10–15 km. The red shaded area shows the corresponding ratios for 1993 and 2003 for the beginning and the end of our sample;
the count of peers being cumulative the peerless ratios are always lower for a later point in time.
The statistics for larger cities are presented in yellow (line with hollow circle).
Here, in 1997, about 70% of the machine imports without same machine peers within 1 km, and then drops to about just 45% within 5 km before decreasing gradu- ally to 20% within the 50 km radius. Interestingly, the band around the 1997 value is rather wide in Fig. 3 for larger cities, which suggest a significant variation in the presence of peers over time. For smaller cities and settlement (green line marked with cross), results show the highest share of firms without peers, over 85% in any year. This ratio gradually decreases with the distance and statistics become similar to those calculated for larger cities when distance exceeds the 30 km radius.
The figure suggests that firms located in different types of districts will have to face different amount of difficulties to find another firm who had imported relevant
Fig. 3 The share of machine imports without peers at various km distances. This figure shows the share of machine imports that happen without peer presence separately three groups of firms based on their location: firms in the capital city, Budapest, firms in larger and firms in smaller cities. This share is shown for various distance measures
machines. In the capital city, 80% machine imports have had a peer within 5 km, while small cities this around 20%.
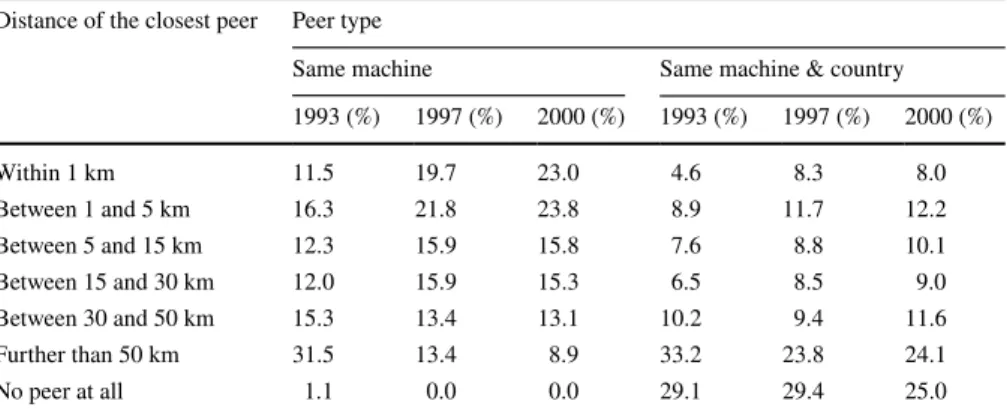
While the findings from Fig. 3 already give motivation to use distance thresh- olds 1 km, 5 km, 15 km and 30 km for the analysis, it is still worth looking at the distribution of peers from a different perspective. Instead of the share of peerless imports within a distance Table 4 looks at the distance of the closest peer for the same three time periods. The table has two panels, the left one shows the distribu- tion of machine imports by closest same-machine peers, while the right panel looks at imports by the spatial distribution of same machine-same country peers.
Even in the second year of our sample, in 1993, 11.5% of the importing events are involving machines that have been imported in the previous year by other firms within the 1 km vicinity and more than half of them have peers within the 30 km radius. As time advances the chance of not having any peer diminishes, and more and more firms have local peers when they import machines. By 2000, half of the imports take place in locations where there was previous import in the 5 km radius.
Additionally, Table 4 shows that even in 1993, at least 70% of the machine imports had same-country peers. About 5% of the imports have peers within 1 km, while 27% of them within 30 km. We find an accumulation of peers with the 1–15 km range. By the year 2000, the share of imports with immediate (1 km) same- country peers increases to 8%, those with peers within 15 km, increases to 30%.
3.4 Timing of imports
Investigating the effect of peers on importing activity requires an additional hetero- geneity: across time. If a new machine importer is influenced by previous importers, those who import earlier should be closer to peers than those who import later.
To investigate the timing of machine imports, let us look at adoption—importing a machine that had been imported before. In any given postal district and machine, we calculate the number of years it took for the second importing activity to follow
Table 4 Share of imports with and without previous importers in selected years
The table categorizes country-machine firm level imports by the existence of peers by distance. The panel on the left looks at machine import, while the panel on the right looks peers by importing country.
Each column adds up to 100%
Distance of the closest peer Peer type
Same machine Same machine & country
1993 (%) 1997 (%) 2000 (%) 1993 (%) 1997 (%) 2000 (%)
Within 1 km 11.5 19.7 23.0 4.6 8.3 8.0
Between 1 and 5 km 16.3 21.8 23.8 8.9 11.7 12.2
Between 5 and 15 km 12.3 15.9 15.8 7.6 8.8 10.1
Between 15 and 30 km 12.0 15.9 15.3 6.5 8.5 9.0
Between 30 and 50 km 15.3 13.4 13.1 10.2 9.4 11.6
Further than 50 km 31.5 13.4 8.9 33.2 23.8 24.1
No peer at all 1.1 0.0 0.0 29.1 29.4 25.0
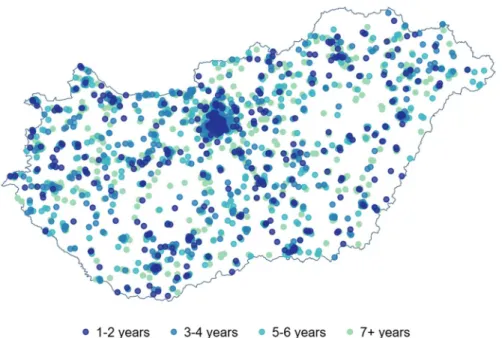
Fig. 4 Time average machine being imported after the pioneer. This figure shows the average number of years between first and second importing of a machine, averaged at district level
Fig. 5 The average distance a machine travels a year after the first import. The figure shows the average kilometer distance of a new machine import from the first imports of that machine in Hungary. Stand- ard errors are gained from regressing distance from pioneer importer on time dummies indicating time elapsed from pioneer importer of the product at import observation level
the first one. We can take a district level average across machines imported, and we plot it in Fig. 4. The distribution of timing shows considerable variation in adoption rate. It shows that, on average, timing is negatively correlated with city size: average early adoption (1–2) years is concentrated around agglomerations such as the capi- tal city and important manufacturing centers. At the same time, late adoption (7+
years) is found in smaller settlements and in the greater vicinity of agglomeration.
That is, foreign machines are adopted in smaller municipalities later than in larger cities. In fact, in major cities the imported machine arrives first, in 1992 or 1993.
New machines get imported in smaller settlements much later.
We examine the possible spatial dependence of imports by looking at average distances between importers in kilometers over time. Figure 5 investigates how far technology—as embodied by machines—travels in time. The distance is calculated in the following manner. Assume that at time zero (1992 in our case) a set of K firms k=1…K firms import machine m. The next year new firms import the same machine m. We measure their distance to the closest firm of the existing set of k firms. If the new importers are in the same district as any of the previous k import- ers the distance can be assumed to be zero. An average of the distances calculated in this fashion will tell us how much a machine “travels” a year.
The distance is calculated for each year after the first import of a given machine m, always with respect to the original k firm. If the locations of the successive waves of imports are independent of the location of the pioneer importers distance should be uniform over time. Figure 5 shows that in years immediately after the first import followers are located closer on average than in later years. It shows that if new machine imports tend to be close to old ones within 3–4 years of the first import.
Additionally, it also shows that investigation should cover the 15–30 km radius in addition to the very close peers. The 15–30 km radius can be considered to cover a group of settlements (an urbanized center) or a micro-region.
All-in-all, these results are consistent with the idea that machine imports exhibit peer effects and learning takes place in a rather limited geography, even allowing time for information spillover.
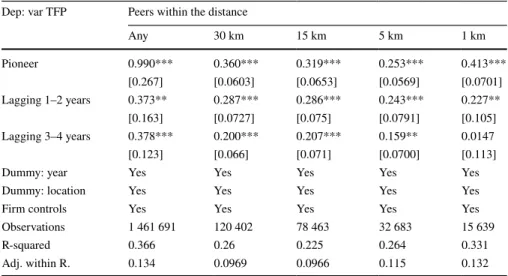
One idea behind the spillover effects, as mentioned above, is that peer effects can lower the fixed cost of importing for following firms and as a consequence relatively lower productivity firms can catch-up. This would suggest that firms that import are more productive than the ones that follow. Table 5 tests this idea and compares firm productivity by the relative timing of the machine imports. The baseline group con- sists of firms that import machine 5 years or later than the pioneer. The pioneer is the firm that imports a given machine within a given distance first. The first column compares importer firm to national pioneers. The remaining columns make com- parison between the firm and local pioneers: pioneers within 30 km distance, within 15 km distance and within the 1 km neighborhood. Consequently, the initial sample size containing all firm-pairs decreases as the size of the neighborhood shrinks.
Results show that pioneer importers are always more productive than followers, especially more than those that import 5 years or later. This is a common finding across all distances we look at, but in some cases results are more pronounced. For example, in the first column, where firms are compared in productivity with respect to their time lag to the country level pioneer, pioneers are 170% more productive
than firms that follow tem five or more years later. Even firms that follow 1 or 2 years later or firms that follow 3–4 years later are more productive, by about 45%
each.
Let us consider local pioneers only—firms that are pioneer (imports a machine m first) within a certain distance. When the analysis is restricted to comparing fol- lower firms to local pioneers, the differences are smaller but still robust, even in the case of the smallest distance examined. When firms within 1 km of each other are compared, the productivity premium of the pioneers is 51% that of the firms lagging behind by 1 or 2 years has only 25% productivity advantage over the base group.
Eventually, there does not seem to be significant productivity difference across firms that import the machine 3–4 years or 5 or more years later than the local pioneer.
3.5 Peer effects in import decision
This work focuses on understanding the drivers of machine selection—comparing choices within the firm. Before we turn to our main results, we take a look at the basic question of how local spillovers could affect the choice to become a machine importer at all—whether firms with local experienced peers are more likely to import machines.
In Table 6 we look at the probability that a firm imports any machine from its choice set depending on the local presence of past importers. We focus only on
Table 5 Relative productivity advantage of machine importer pioneers
This table compares the productivity of the importer to the firm who imported a given machine first within a given distance. The first column compares firms to a pioneer at any distance (national level), the second compares firms to pioneers within 30 km distance to each other, the third uses 15 km distance.
The last column looks at firms within the 1 km neighborhood. Firm controls include firm age, firm size and foreign ownership dummy. The baseline group consist of firms that import machine 5 years or later than the pioneer. Regressions are of log-dummy type, hence 0.99 coefficient (column 1) implies that pio- neers are 170=100∗ (exp(0.99) −1) percent more productive than firms following 5 or more years later Dep: var TFP Peers within the distance
Any 30 km 15 km 5 km 1 km
Pioneer 0.990*** 0.360*** 0.319*** 0.253*** 0.413***
[0.267] [0.0603] [0.0653] [0.0569] [0.0701]
Lagging 1–2 years 0.373** 0.287*** 0.286*** 0.243*** 0.227**
[0.163] [0.0727] [0.075] [0.0791] [0.105]
Lagging 3–4 years 0.378*** 0.200*** 0.207*** 0.159** 0.0147
[0.123] [0.066] [0.071] [0.0700] [0.113]
Dummy: year Yes Yes Yes Yes Yes
Dummy: location Yes Yes Yes Yes Yes
Firm controls Yes Yes Yes Yes Yes
Observations 1 461 691 120 402 78 463 32 683 15 639
R-squared 0.366 0.26 0.225 0.264 0.331
Adj. within R. 0.134 0.0969 0.0966 0.115 0.132
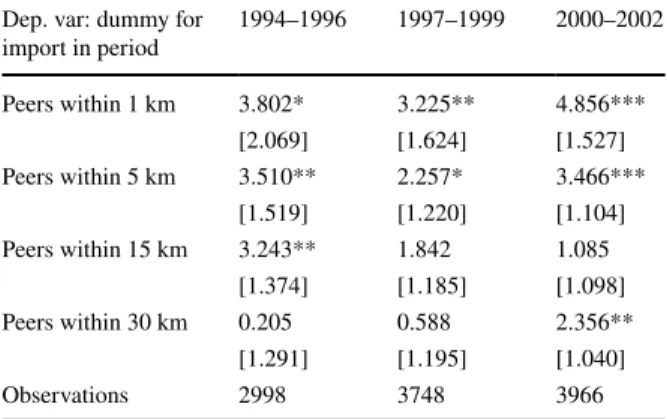
core machines, which specifies the peers to be same sector importers. We look at three cross-sections and allow the dependent variable to take on the value one if the firm imports for the first time during a period of 3 years (1994–1996, 1997–1999 or 2000–2002). In each period we regress the import dummy on four indicator vari- ables separately which measure the existence of past imports at various distances.
Results in Table 6 suggest that firms with local peers are more likely to import a core machine. Compared to the baseline probability of machine import, an average of 11% in the examined years, peer presence suggests an over 30% increase. We also find that the correlation is higher the smaller the distance at which peer presence is measured.
In this specification peer presence means the existence of previous firms that have imported any core machines. Past importer could have not actually imported machine m, but another one from the set. Hence, these findings are more of an indic- ative nature.
4 Results
This section presents the results of our empirical investigation on machine specific spillovers. The first subsection will discuss results regarding the effect of previous importers of the machine m on present import decisions about m. The second sub- section collects results from exploring the effect of country choice of peers on the country choice of new machine importers.
Table 6 Propensity to import any machine
The table shows results from 12 separate linear probability regres- sions, where import dummy is regressed on a single peer indica- tor. Regressions include sector fixed effects. The coefficients are multiplied by 100 to express percentage points. The 3-year periods are chosen to obtain an increase in cross-sectional variation for the descriptive statistics, this restriction does not apply to further analy- sis
***p<0.01 , **p<0.05 , * p<0.1 . Standard errors, clustered at dis- trict level, are in parentheses
Dep. var: dummy for
import in period 1994–1996 1997–1999 2000–2002
Peers within 1 km 3.802* 3.225** 4.856***
[2.069] [1.624] [1.527]
Peers within 5 km 3.510** 2.257* 3.466***
[1.519] [1.220] [1.104]
Peers within 15 km 3.243** 1.842 1.085
[1.374] [1.185] [1.098]
Peers within 30 km 0.205 0.588 2.356**
[1.291] [1.195] [1.040]
Observations 2998 3748 3966
4.1 Evidence on the extent of spillovers
Now we look at the effect of peers on machine imports. We estimate multiple variants of Eq. 1. These results are collected in Table 7.
First, we employ a single dummy variable indicating peer presence within 1 km of the firm related to core machine imports only. We find a positive cor- relation between importing a specific machine and the presence of past importers within close range.
To capture the meaning of the estimated coefficient, let us compare two machine import options for a firm in a given sector offering a set of core machine import possibilities. Controlling for machine and time characteristics, we find that importing a machine that was previously imported by a peer has 0.308 percent- age points greater chance, on average. Note that in the tables, we present coeffi- cients as multiplied by 100 to express percentage points for the ease of interpreta- tion. Compared to the average hazard of importing a machine which is about 1%,
Table 7 Machine import spillover estimation
Linear probability models in all column. Peer variables are measured with binary variables. Columns (1) and (2) include fixed effects: firm*year, machine*year, sector*year, location*year. Columns (3)–(4) include additionally fixed effects: machine*sector*year and location*sector*year. Coefficients are multi- plied by 100 to express percentage points. Core machines are those imported by firms in a single sector only
***p<0.01 , **p<0.05 , * p<0.1 . Standard errors, clustered at district level, are in parentheses
Dep. var: import dummy Core machines All machines
(1) (2) (3) (4)
Same machine peers
Within 1 km 0.308*** 0.301*** 0.389*** 0.382***
[0.099] [0.098] [0.069] [0.069]
Between 1 and 5 km 0.196*** 0.175***
[0.066] [0.052]
Between 5 and 15 km 0.156** 0.082*
[0.065] [0.048]
Between 15 and 30 km 0.056 0.071**
[0.043] [0.033]
Between 30 and 50 km 0.027 0.012
[0.033] [0.028]
Further than 50 km − 0.018 0.039
[0.048] [0.041]
Observations 402,765 402,765 917,803 917,803
R-squared 0.156 0.156 0.134 0.134
our result means a 30% increase in the probability of machine import in a given year.13
Column (2) includes additional variables to extend the distance at which peers are considered. In addition to peers within 1 km, we add indicators for peer presence in the distance ranges between 1 and 5 km, between 5 and 15 km and so on. Results show that peer presence is positively related to machine imports even at higher distances up to 15 km, however, the size of the estimated coefficients decrease as distance increases. The coefficient on the presence of past importers of machine m within 1 and 5 km range imply 19 percentage point increase in the probability to import the same machine. Peer presence within 5 and 15 km implies only 15 per- centage point increase. Note that coefficients may be combined to learn the cumula- tive effect. For firms with peer(s) within 1 km as well as within 5 km, the cumulative spillover effect is 0.301+0.196=0.497.
Table 8 Machine import spillover estimations: binary to continous
Linear probability models in all columns with fixed effects: firm*year, machine*year, sector*year, location*year, machine*sector*year and location*sector*year. Peer variables are measured with binary varia- bles in columns (1) and (2), while in column (3) peer variables capture the count of peers. Variables for peers located further than 1 km are included in the regressions but results are omitted for brevity. Coef- ficients are multiplied by 100 to express percentage points
***p<0.01 , **p<0.05 , * p<0.1.
Standard errors, clustered at district level, are in parentheses
Dep. var: import dummy (1) (2) (3)
Peer measure Binary Binary Continuous
Same machine
peers within 1 km 0.382*** 0.269***
[0.069] [0.065]
1 peer within 1 km 0.318***
[0.066]
2 peers within 1 km 0.657***
[0.177]
3 peers within 1 km 0.886***
[0.338]
4+ peers within 1 km 1.124**
[0.450]
Observations 917,803 917,803 917,803
R-squared 0.134 0.134 0.134
13 Same machine peer variables indicate previous imports independently how many years ago it hap- pened. In Table 18 of the Online appendix we look at how results change when peers are differentiated by the time of imports. We do not detect a clear over-time pattern.
Columns (3) and (4) show estimates on an enlarged sample that also includes non-core machines. The specifications are analogous to columns (2) and (3) respec- tively, including additional controls for machine-sector and location-sector interac- tions with time. The results are similar to those of core machines: the coefficients imply that peer presence within 1 km distance of the firm increases import prob- ability of a non-core machine by 0.38 percentage points, peer presence between 1 and 5 km increases the import probability of the same machine by 0.17 percent- age points. Presence of previous importers of machine m within the 5–30 km range increases import probability by 0.07–0.08 percentage points.14
In the presence of spillover, having more peers would imply a higher effect on import probability. This is investigated by Table 8. Column (1) replicates column (4) of Table 8 for the ease of comparison. For brevity only the results on peers within 1 km are shown. Next, in column (2) we introduce four dummy variables for number of peer categories: one, two, three and four or more. Results illustrate how the peer effects increase by the number of peers present. This relationship is fairly linear:
having three peers increase the probability three times a single peer would. Finally, column (3) shows regression results when instead of dummies, peer variables count
Table 9 Regressions for country choices
Standard errors, clustered at district level, are in parentheses Linear probability models in all columns with fixed effects: firm*year, machine*year, sector*year, location*year, machine*sector*year and location*sector*year. Peer variables are measured with binary vari- ables. Coefficients are multiplied by 100 to express percentage points
***p<0.01 , **p<0.05 , * p<0.1
Dep. var: import dummy (1) (2) (3)
Same country and machine peers
Within 1 km 2.687*** 0.938*** 0.660***
[0.201] [0.182] [0.181]
Between 1 and 5 km 1.614*** 0.342*** 0.354***
[0.126] [0.112] [0.104]
Between 5 and 15 km 1.072*** 0.129 0.206**
[0.087] [0.087] [0.084]
Between 15 and 30 km 1.634*** 0.0506 0.0284 [0.089] [0.086] [0.079]
Dummy: c×t Yes Yes
Dummy: m×c×t Yes Yes
Dummy: l×c×t Yes
Observations 1,349,414 1,349,414 1,349,414
R-squared 0.046 0.083 0.149
14 The positive impact of peer presence is still detected when we exclude firms located in Budapest.
(Table 17 in the Online appendix).