https://doi.org/10.1007/s00148-021-00875-w ORIGINAL PAPER
Social Mobility and Political Regimes:
Intergenerational Mobility in Hungary, 1949–2017
Paweł Bukowski1,2·Gregory Clark3,4·Attila G ´asp ´ar5,6 ·Rita Pet ˝o6
Received: 7 October 2020 / Accepted: 20 August 2021 /
©The Author(s) 2021
Abstract
This paper measures social mobility rates in Hungary during the period 1949 to 2017, using surnames to measure social status. In those years, there were two very different social regimes. The first was the Hungarian People’s Republic (1949–1989), which was a communist regime with an avowed aim of favouring the working class. The sec- ond is the modern liberal democracy (1989–2017), which is a free-market economy.
We find five surprising things. First, social mobility rates were low for both upper- and lower-class families during 1949–2017, with an underlying intergenerational sta- tus correlation of 0.6–0.8. Second, social mobility rates under communism were the same as in the subsequent capitalist regime. Third, the Romani minority throughout both periods showed even lower social mobility rates. Fourth, the descendants of the eighteenth-century noble class in Hungary were still significantly privileged in 1949 and later. And fifth, although social mobility rates did not change measurably during the transition, the composition of the political elite changed rapidly and sharply.
Keywords Social mobility·Status inheritance·Institutions·Transition JEL Classification J62·N34·P36
1 Introduction
Concerns about free-market capitalism in recent years include limited economic opportunity for the lower class and low rates of intergenerational social mobility (Aaronson and Mazumder2008; Lee and Solon2009; Olivetti and Paserman2015;
Responsible editor: Klaus F. Zimmermann
Attila G´asp´ar attila.gaspar@unipd.it
Extended author information available on the last page of the article.
OECD2018; Elliot Major and Machin2018; Piketty2020). Calls for institutional change have intensified during the COVID-19 pandemic, which has disproportion- ately affected less-affluent people and likely impaired the future prosperity of their children (Elliot Major and Machin2020; Blundell et al. 2020; Adams-Prassl et al.
2020). However, evidence that social and economic institutions significantly influ- ence social mobility rates is limited.1Measured social mobility rates differ across countries, but is this a function of differences in social and economic institutions, in population composition or in the many other ways in which countries vary?
In this paper we look at Hungary, where a fairly homogeneous population expe- rienced two very different political, economic and social regimes between 1949 and 2017 — communism (1949–1989) and free-market capitalism (1989–2017) — and measure whether the regimes had any effect on rates of social mobility. We measure the social status of different groups within each regime by looking at the status of classes of surnames. We identify four sets of surnames in Hungary, two of high-status and two of low. The high-status surnames are first those ending in..y, which was a traditional upper-class surname type in Hungary as far back as the eighteenth century.
These are the names associated with the traditional Hungarian noble classes (though the association is not deterministic). Additionally, we identify any surname that was highly over-represented among high school graduates between 1920 and 1939 com- pared with its estimated population share. The low-status surnames are the 20 most common surnames in Hungary and the surnames that were under-represented in high school education between 1920 and 1939 relative to their population share.
We then calculate the estimated average status of these surnames during the years 1949–2017 by comparing their representation among various elites (education, gen- eral and political) relative to their share in the general population. From this, we obtain decadal estimates of social mobility, with those for 1950–1989 showing mobil- ity during the communist era, and those for 1990–2017 showing mobility during post-communist free market capitalism.
We find that social mobility rates throughout were low for both upper- and lower- class families, with an underlying intergenerational correlation of status in the range of 0.6–0.8.2Second, there was no greater rate of social mobility in the communist era than in the subsequent free-market regime.3Third, surnames associated with the Romani minority throughout this period showed even lower social mobility rates, and indeed we see divergence towards lower social status over time, even during the
1Recent studies looking at within-country cross-regional determinants of social mobility point to a positive effect of social capital, education and economic activity, and a negative effect of inequality (Chetty et al.
2014; Chetty et al.2014; Corak2013; G¨uell et al.2018).
2Individual-level estimates usually show a correlation around 0.2–0.3 across generations (Corak2013), while group-level estimates are in the 0.7–0.8 range (Clark2015), implying stronger persistence of status.
This is not a contradiction, as individual- and group-level social mobility are related but distinct concepts (Solon2018). See Section4.1for more detail on this, and Mazumder (2005) for a discussion on how measurement error might affect the individual-level estimates. Finally, in Appendix B of the working paper version of this article (page 65 in Bukowski et al.2021) we show benchmark estimates of Hungarian social mobility from earlier sociological papers.
3Low rates of social mobility during communism are also reported for China by Hao and Clark (2012).
The authors interpret it as the importance of kin networks in the intergenerational transmission of status.
communist era. Fourth, the descendants of the eighteenth century upper classes in Hungary were still significantly privileged during the period 1949 to 2017. Finally, we find that the political representation of the surname groups changed starkly with regime changes, which makes the apparent lack of effect of the transition to democracy in 1989 more striking.
2 Historical context
Hungary suffered a devastating loss in World War II. The Red Army crossed its bor- der in late 1944 and started what would become an almost 47-year-long occupation.
The Soviets, as they did in the rest of occupied Central and Eastern Europe, soon installed a communist puppet government. As the Iron Curtain came down, Hungary became a founding member of Comecon and later the Warsaw Pact, the respective economic and defense organizations of the Eastern Bloc.
Countries under Soviet occupation followed a remarkably similar political and economic path over the following decades (Fowkes1993). In all of them the left- wing parties became united under the leadership of the Stalinist hardliners during the year 1948. Centrist, agrarian and moderate right-wing parties were either abolished (as in Hungary) or were reduced to a satellite status (as in East Germany). Political events followed very similar patterns with show trials of non-communists and com- munists alike; persecution of any dissent; setting up all-knowing secret police; harsh repression that in almost all countries triggered a revolutionary response from soci- ety at one point. The communist parties themselves, despite having rather different organizational and sociological origins (Seton-Watson1958), evolved quite similarly later on (Hanley2003).
Communist countries of the Eastern Bloc undertook similar, transformative eco- nomic and social policies. Some form of land reform took place everywhere as early as 1945, followed by forced collectivization from around the year 1948, which went on full-swing until the mid 1950s, and was completed by the 1960s. Industry was gradually nationalized as part of a switch from a free-market to a planned econ- omy, starting from the biggest manufacturing firms and banks, then proceeding to the middle-sized enterprises, down to the small family-owned businesses. By 1952, the share of the socialized sector was between 77% and 100% in industrial output. In the trade sector the range was 54% to 98% (Swain and Swain2017). In both dimensions East Germany represented the least collectivized end of the spectrum, while Bul- garia was the opposite, and Hungary was around the median (exactly the median with 97% rate of industrial collectivization, and close to the median of 88% with its own 82% in terms of trade collectivization). Nationalization of private property (land, real estate, businesses, assets) thus took place everywhere with some local differences;
Hungarians were more likely to keep their residential real estate, while agricultural collectivization was much less intense in Poland (Hanley and Treiman2004).
Besides the fundamental change in the ownership structure of the means of pro- duction, all Eastern Bloc countries started forced industrialization, with around 50%
rates of investment into industry and around a mere 10% into agriculture (Swain and Swain2017).
Communist countries reformed education as well. Enrollment in secondary edu- cation expanded rapidly everywhere, and became almost universal; the expansion of tertiary education was less steep, but enrollment rates increased and reached double digits. This facilitated access, but parental education’s role in explaining children’s educational attainment even increased over time (Nieuwbeerta and Rijken1996).
Social mobility studies that looked at occupation category correlations of parents and children under communism found that social mobility rates across Eastern Bloc countries were similar to one another throughout the whole period (Doma´nski1998;
1999). The wage structure in all communist countries (including Hungary) was com- pressed; returns to skills were much smaller compared to Western countries or to returns after transition to capitalism later on, which brought a large and rapid increase in income inequality (Matvejuu and Lim1995; Chase1998; Brainerd1998; Kertesi and K¨oll˝o1999; M¨unich et al.2005). Milanovic (1999) finds that Gini coefficients of income were rather similar (between 19.8 and 25) before transition in six Eastern European countries (Bulgaria, Hungary, Latvia, Poland, Russia and Slovenia), and increased everywhere later on, with Hungary experiencing less increase than most other countries, but still very close to Poland, Slovenia and Latvia.
Besides the explosion of the rigid wage structure, the other major change of transition was the restitution of confiscated property. Hungary chose voucher com- pensation (with a cap on value); major industrial companies were sold off for cash rather than returned to their former owners (Kozminski1997). Hanley and Treiman (2004) find similar rates of property ownership in Hungary compared to other former communist countries in the early 1990s.
3 Social mobility and institutional change
The most popular formal economic model of social mobility is Becker and Tomes (1979). The authors argue that social status for any individual has two components:
a transitory component, which is not transmitted to subsequent generations, and a persistent component that is strongly transmitted. As explicated by Solon (1999) the model assumes a parent (generationt −1) and one child (generationt), where the parent allocates their lifetime earningsyt−1between their own consumptionCt−1and investmentHt−1in the child’s earnings capacity. Parents cannot borrow on behalf of their children to invest in their human capital because of imperfect capital markets.
With this specification:
yt =(1+r)Ht−1+Et (1) wherer is the return to human capital investment, andEt is child ability. It is also assumed that ability is inherited from the parent, but with random components:
Et =et+ut =λet−1+vt+ut (2) Suppose that the parent has a Cobb-Douglas utility function in Ct−1 and yt, with weightαon their own consumption. Equating the marginal utilities from own
consumption with child’s income under the budget constraint yields the following optimal level of investment in child’s human capital:
Ht∗−1= 1−α
1+αryt−1− α
1+αr(λet−1+vt +ut) (3) It is clear from this equation that parents with higher income invest more in their child’s human capital. The effect of ability, however, is ambiguous. On the one hand, parents with high ability have higher income and thus can invest more. On the other hand, high ability parents expect that their children will also be of high ability, so cur- rent consumption yields relatively higher utility for them. The overall effect of ability is positive when the weight on own consumption and/or the rate of intergenerational transmission of ability are low.4
The correlation between parents’ and child’s lifetime income in the steady state is:
ρ =δβ+(1−δ)β+λ
1+βλ (4)
whereβ =(1+r)α, andδ= (1−α2βσ2u2)σy2.
This model has few predictions about the effects of different social and politi- cal regimes on social mobility. The communist takeover brought almost a complete elimination of income from private capital and a substantial compression of wages through centralization of wage-setting process (Atkinson and Micklewright1992).
This can be conceptualized in the Becker and Tomes model as a reduction in the return to human capital investment r. A falling return reduces the dispersion of incomeσy2 (Mavridis and Mosberger 2017), without influencing the dispersion of abilityσu2.
The fall of the rate of return to human capital investment reduces the intergener- ational correlation of income through two channels. First, by directly changing the relative prices of consumption and children’s lifetime earnings in the parents’ utility maximization problem. That is, the lower rate of return makes investment in chil- dren’s earnings relatively less attractive compared to consumption. Second, indirectly through reduced dispersion of income. Since the investment in children’s human cap- ital increases with parental income, compression of the distribution of income also reduces the dispersion of parental investment.
Conversely, the transition from communism to capitalism signified a substantial rise in the return to human capital investment (Campos and Jolliffe2003; Keane and Prasad2002), leading to a rise in the dispersion of income (Mavridis and Mosberger 2017) without altering the dispersion of ability. The growingr should thus increase the intergenerational correlation of income directly and through the increase in the dispersion of income.
Many other arguments on the potential negative effect of switching from com- munism to capitalism on social mobility have been articulated in the voluminous economic and sociology literature on socio-economic inequalities under commu- nism (Bergson1944; Morrisson1984; Atkinson and Micklewright1992; Hanley and
4That is, whenα(1+λ) <1.
Treiman2004). A large portion of all wealth was nationalized under communism, and in all countries some form of restitution took place after transition to capital- ism; under communism, downward job mobility of former elites was enforced in some areas; policies aimed at equalizing opportunities and enhancing mobility were implemented upon communist takeovers, which were later lifted etc.5
There are, however, several arguments on why social mobility might not necessar- ily be different under communism and capitalism. The Becker and Tomes model is a model of the transmission of permanent income across generations, where human capital plays a significant role, but the transmission of human capital itself is not explicitly modeled. Parental investment in the human capital of the child can take the form of a transfer of physical or financial assets, or the investment of parental productive time (which could have been used for generating income). Therefore, par- ents face a trade-off between their own consumption and the future earnings of their children. In reality, however, parents might influence the latter without sacrificing own consumption, for instance, by choosing residential location, providing access to social networks or sharing books and knowledge (Chetty et al.2014; Chetty and Hendren2018a; 2018b; Bell et al.2019). If this is the case, the differences in the dispersion of income across social regimes might not matter for the intergenerational correlation of status.
The simple version of the model does not consider the existence of capital mar- kets, which weakens the connection between parental income and investment in human capital of the offspring. The introduction of capitalism after 1989 brought a development of the capital market in Hungary. Although low-income individuals were still facing significant credit constraints (Popov2014), the financial market pro- vided options, which were not available under communism. The positive effect of the broadening access to credit on the intergenerational social mobility could thus partially offset the negative effect of higher income inequality.
Well-known features of socialism, such as shortages, queuing, or preferential access to closed shops or certain services by the nomenklatura (Bergson 1984;
Atkinson and Micklewright1992) could imply an existence of an informal cap on consumption. Therefore, high-income parents might invest relatively more in the human capital of children compared to a regime with the same level of income inequality, but no constraints on consumption. Consequently, social mobility rates under communism might be relatively low despite the significant reduction in the dispersion of income. However, the general consensus in the literature is that the non-monetary aspects of consumption and earnings under communism did not sys- tematically favour low- vs. high-income families (Bergson1944; Morrisson1984;
Atkinson and Micklewright1992; Milanovic1998).
Finally, others have argued that we should not necessarily see an abrupt change in social stratification (and as a consequence, mobility) upon transition to capital- ism, because status transmission is mostly governed by education in all industrialized countries (communist and capitalist alike); or because the skills (or connections) that
5Gerber and Hout (2004) find that workers who experienced upward mobility during the Soviet era regressed to lower occupational status after transition; Betth¨auser (2019) shows that East German educational inequality quickly caught up to higher West German levels upon re-unification.
determined elite status in communism were readily usable, or convertible to capital under capitalism (Hanley and Treiman2004).
4 Measurement of social mobility 4.1 Empirical model
We follow studies of social mobility rates at the group level (G¨uell et al. 2007;
Collado et al.2012; Clark and Cummins2014; Clark et al.2015). We implement the methodology in Clark and Cummins (2014) and model observed status for any individual as a function of a persistent, group level component, that is strongly trans- mitted across generations, and a transitory, individual level component, which is not transmitted. Our measure of social mobility is the intergenerational correlation of the group level component of social status. We chose this method because it uses data that is relatively easily accessible, the general surname distribution of the population and name lists of members of the elite groups. Torche and Corvalan (2018) show analytically that total social mobility (i.e. the persistence of an outcome between a pair of an adult child and their parent) is a weighted average of the persistence of the individual level components and the persistence of the group averages, where the weights are given by the respective variance share of the individual and the group level components. Accordingly, our findings could be interpreted as between-group estimates of social mobility.
In this framework, the statusyof each individualifrom groupgin each generationt is composed of an underlying group-level componentxand a transitory componentu:
yitg =xtg+ugit (5) Group level status is inherited strongly at the rateρwith non-negative multiplica- tive erroreit, so that the latent status of groupgat timetis:
xtg=ρxtg−1·eit. (6) In order to estimate the social mobility rate in Hungary (i.e. the intergenerational correlationρ), we need to construct a measure of the latent mean social statusxtg. In what follows, we present a methodology of estimatingxtgusing the data on mem- bership in various elites: education, general and political. The educational elites are graduates from medical and technical universities. The general elites are captured by patenting inventors and people listed in “Who is Who” books. The political elites consist of members of the Hungarian Parliament and members of the Hungarian Academy of Sciences.
We define social groupsg as groups of individuals with surnames of particular origin. In particular, we identify traditional upper- and underclass surnames in Hun- gary (we discuss this in detail in the next subsection) and we treat all individuals with such surnames as members of either upper or lower class.
The idea is to infer the latent mean social status of certain surname groups from their membership in elites. This approach requires two types of data. The first is the population shares in Hungary of traditional upper- and underclass surnames. The
second is the shares of these surnames in various elites. In addition, we must make the following three assumptions:
(a) Social status in Hungary is normally distributed with constant variance across generations (ugit ∼N (0, σg2)).
(b) The target surname groups had the same variance of social status as the population as a whole among their members (σg=σ for allg).
(c) Members of the elite represent some portion (αt%) of the top of the social status distribution in Hungary.
We specifyαt% in a way that it tracks potential changes in the relative “eliteness”
of the occupation (the exact method is somewhat different across elite groups, so we discuss it in detail in Section4.3below). In the Appendix of Bukowski et al. (2021) we show that the results are virtually unchanged if we assume thatαt%=1% across all elites, which is the approach taken by Clark (2015).6
Suppose an individual enters the elite if her status is above a time-variant threshold (which is common across groups):
yitg > yt.
The probability that a current member from groupgenters the elite is:
Peliteg =P (xtg+ugit > yt)=1−P (ugit < yt−xtg)=1−Φ
y
t−xtg σg
, whereΦ is the cumulative distribution function of the standard normal distribution.
We can express the same equation in the following way:
yt−xtg
σg =Φ−1
1−Peliteg
(7) This relationship holds also for the entire population. Without a loss of generality, assuming thatxt =0 (which means thatxgt is defined relative to the social mean) the equation in this case becomes:
yt
σ =Φ−1(1−Pelite) , (8)
wherePeliteis the overall exclusiveness of the elite. This shows that the threshold for entering the elite is implicitly pinned down byPelite andσ. Subtracting7from8:
Φ−1(1−Pelite)−Φ−1
1−Peliteg
=xtg σg −yt
1
σg − 1 σ
(9) The first term on the left hand side is the same asαt% from assumption (c).
How we calculate exclusivity differs across data sources, so we deal with this in Section4.3.
6Figures A10 to A15 on pages 70 to 73 in Bukowski et al. (2021).
The second term we can calculate from the relative representation of groupgin the elite. The relative representation is the ratio of the group’s share in the elite and its population share.7
Given assumption (b), the second term of the right hand side of Equation9dis- appears (i.e. the estimated social status does not depend on the threshold yt). In Appendix A (page 56) of Bukowski et al. (2021), we illustrate the potential bias resulting from the violation of this assumption, but we also show that assuming dif- ferent variances has a relatively small effect on the estimates empirically, and that it converges to zero over time.8
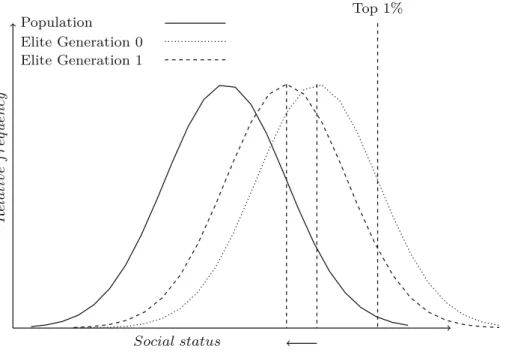
Figure1illustrates the intuition on how we attribute to each surname group in each period an implied average social status. If we know how over or under-represented a group is among the elite we can then estimate its mean social status. Assuming medi- cal graduates, for example, represent the top 1% of the distribution, if we observe that a particular surname type has 3% of its members found among medical graduates, then this will translate into that group having an average status that is 0.45 standard deviations above the social mean.
Having estimated the implied mean of status for an upper- or underclass surname type in each decade during 1949–2017, we can then calculate for each decade the implied correlation of statusbg10with the previous decade. From5and6:
lnxtg=lnx0g+lnbg10×t+ln tg (10) where tgis an error term corresponding to mis-measurements, andb10g is the correla- tion of status across a decade. We can estimate lnbg10by regressing the logarithm of the calculated latent status on a constant and a time trend using OLS. Then, assuming that a generation is 30 years, the implied intergenerational correlation of underlying status for groupgis given by
ρg=(bg10)3 (11)
4.2 High and low-status surnames
The first high-status surname group we focus on are surnames ending in..y, which in our study period constituted typically 2% of the population.9In pre-modern Hungary,
7Define the relative representation of group g asRRg = #g in elit e
#elit e /#pop#g . The relative representation is informative in itself, as it shows how over-represented (or under-represented) is group g in the elite compared to its population share. Theoretically we can think of the relative representation as follows:
RRg = P (group=g|elit e)
P (group=g) . We can calculate the share of population in certain eliteP (elite)= #elit e#pop (or assume that they represent a top portion of the population). Multiplying the relative representation with P (elite)we obtain:
P (group=g|elite)P (elite)
P (group=g) =P (group=g∩elite)
P (group=g) =P (elite|group=g)=Pelit eg
8In particular, we carry out robustness checks where we set the educational status threshold for doctors at 0.5% and 2%, and where we allow the upper- and underclass surname groups to have a variance of status that is 0.8 or 1.2 times that of the population as a whole.
9With the exception of names ending in..gy,..ly,..nyand..ty, which are not..yending names, as these letter pairs form single consonants in the Hungarian language.
Fig. 1 Illustration of estimating social mobility rates from surname distributions. The figure shows how we infer latent social statusxtof a certain group from its observed shares in the elite. The solid line represents the status distribution of the population. We assume that 1% of the whole population makes it into the elite, which defines the cutoff level of social status needed to join the elite (represented by the Top 1% vertical dashed line). Next we turn to the dotted curve, which is the status distribution of the group in the 0t hgeneration. Knowing the share of the group who made it to the elite (the mass of individuals beyond the cutoff of Top 1%) and assuming that the variance of the group’s distribution is the same as the population, we can infer its mean relative to the population mean. Doing the same with the next generation data, we can infer the speed of convergence to the mean over a generation for the group
there was a set of surnames that could be written with either an..ior..yending. These surnames supposedly signified a location from which the family is originally from, or where their family estates were located. The..yspelling was considered more archaic and elegant very early on, and became widely associated with the nobility.
Perhaps the most famous example for this class of surnames is former French pres- ident Nicolas Sarkozy, whose father (P´al Istv´an Ern˝o S´ark¨ozy de Nagy-B´ocsa) was born to a family of the Hungarian lesser nobility that gained its title in the seven- teenth century fighting the Ottoman Empire. 29% of all Hungarian prime ministers since 1848 came from a..ynamed family, which corresponds to an average rate of over-representation of a factor of 15 compared to the current population share of such names. We see large variation across political regimes (9 out of 21 PMs of Austria- Hungary, 4 of 14 PMs of the interwar far-right regime, exactly 0 communist PMs and 1 out of 7 PMs elected after 1990 belonged to the..ynamed group). The over- representation of..y names is not limited to politics, as two of the ten Hungarian Nobel-laureates had a..yending family name (Gy¨orgy B´ek´esy and Gy¨orgy Hevesy).
Although there is no deterministic relationship between being a noble and hav- ing a..y ending family name, we are able to demonstrate the elite status of these
names as far back as the eighteenth century in a number of ways. In the 1720 cen- sus of the taxpayer population (which excluded high nobility), a member of the petty nobility was three times more likely to have a..yending name than non-nobles (14% vs. 5%). In the conscription of the nobility of 1755, which was a list of tax- exempt nobles who were not part of the high aristocracy, the..yname share was even higher, at 25%. Finally in the complete list of the land-owning aristocracy in 1767, the..yending covered a full 40% of the high aristocracy. Thus in eighteenth-century Hungary the higher was the status of a given subset of society, the greater was the over-representation of..ysurnames in it.10
At the dawn of the revolution of 1848, some members of the progressive elite with noble backgrounds voluntarily and demonstratively changed their names to the more plebeian..iending. Nevertheless, having a..y ending name was closely cor- related with military rank even in the revolutionary army (“Honv´eds´eg”). In 1848 non-commissioned officers were twice as likely to have..yending name than privates, while commissioned officers were five times more likely (Mik´ar1891).
Surnames ending in..ywere still considered a mark of privilege in the late nine- teenth century, and were put under protection when many thousands “Hungarianized”
family names which suggested foreign origin.11 Consequently, it has been legally impossible to adopt such a name since the 1880s (Kar´ady and Kozma2002, p.61).
In the few cases that a..yname was adopted, it was mostly because the family was ennobled at the same time.12 Notably, names of archaic orthography, such as those ending in..y, are still legally protected in Hungary. The 2010 Law on Civil Procedure states that “historic” (article 4/B of §49) and “archaic” (article 4/C of §49) names cannot be adopted. Thus the majority of holders of..ysurnames 1945 and later were the descendants of the upper classes of the nineteenth century.
The second elite group is defined based on over-representation in secondary education between 1920 and 1939. We divided the relative frequency of each name among high school graduates by its population share. Then we tagged the names in the upper quartile of the resulting distribution as elite. We also counted as elite those names that appeared among high school graduates, but were too rare to appear in our sample of the general surname distribution.13 High school graduates during the period 1920 to 1939 were still only an estimated 2–5% of each cohort, depending on the year.
10The 1720 census is available athttps://adatbazisokonline.hu/adatbazis/az-1720 -evi-orszagos-osszeiras;
we digitalized the 1755 census of the nobility from Ill´esy (1902); the list of the land owners in 1767 is from the Urbarium of 1767, available athttps://archives.hungaricana.hu/en/urberi/.
11See Chapter 3 of G´asp´ar (2019) for a more detailed description.
12As was the family of the Nobel-laurate Gy¨orgy Hevesy. Another, similar avenue of getting a..yname was the admission to the Knightly Order of the Vit´ez during the Horthy regime. As the head of state was legally just regent of the Kingdom of Hungary, he had no constitutional authority to make noblemen. The Order of the Vit´ez filled the same purpose.
13We have access to a list of high school graduates compiled by historians Zsuzsa B´ır´o, Viktor Kar´ady, and P´eter Tibor Nagy. The data set is the one presented in Kar´ady (2012). We owe gratitude to Viktor Kar´ady and P´eter Tibor Nagy for allowing us to use their data on high school graduates. We estimate population shares of names from a large sample of wedding records between 1895 and 1939. We are grateful to the Hungarian Association for Family History Research for giving us access to this data set.
The first underclass group consists of those with the 20 most common surnames in Hungary in the twentieth century.14These surnames, which are held by 20–25% of the population from 1945 onward, were under-represented among Hungarian educa- tional and occupational elites, including high school graduates, in all periods before 1945. To see why this is the case, we need to look at the history of surname use.
Hungarian society adopted surnames during the high to late middle ages; the nobles were the first to do so, town-dwelling commoners the next, and serfs the last (Kar´ady and Kozma2002). As keeping track of the lineage was of vital impor- tance to the land holding class, they chose distinctive surnames based on the area they owned (which is the origin of the..yending names), or the name of an ances- tor (which is the origin of the ..fi ending names, the Hungarian equivalent of the ..son/..senending in Germanic languages). Distinction was less important for com- moners, so their family names started out simply as nicknames, which bore reference to the owners’ profession, social status, ethnic origin, or physical appearance. In our group of the most common Hungarian surnames we find 8 (or 9) surnames indicating professions, 6 (or 7) surnames referring to physical characteristics, 5 sur- names referring to ethnicity or country of origin (or likeness of such), and one referring to social status.15 Surnames (especially those of the common people) at first were not inherited, just used for distinguishing between two people having the same first name; having an inherited, patrilineal surname only became com- monplace by the start of the seventeenth century. However, feudalism in Hungary persisted well into the middle of the nineteenth century, so the status of the holders of these names could only have started to regress to the mean three generations prior to our analysis.
The second low-status surname set consists of the surnames that occur at least twenty times more frequently among marriages than among high school graduates during 1920–1939.
The third underclass group is a set of surnames associated with the Romani minority. These were identified first as names that the Hungarian Encyclopedia of Surnames recognizes as Romani surnames. Most of the Romani, however, have com- mon Magyar surnames, so the names we found in this way represent a very small percentage of the population (less than 0.1%). The Romani minority is associated with much higher fertility than the rest of the Hungarian population in recent decades (P´enzes et al.2018). Thus, we identified also as Romani-associated surnames those
14As we consider any surname that was in the top 20 in any of our twentieth century data points, the list actually has 23 surnames.
15Professions: Juh´asz — shepherd, Kov´acs — smith, Lakatos - locksmith, M´esz´aros — butcher, Moln´ar
— miller, Szab´o — taylor, Tak´acs- weaver, Varga — leatherworker;
Physical characteristics: Farkas — wolf (hunter, or has the physical properties of a wolf), Feh´er — white, Fekete — black, Kis — little, Nagy — big, Balogh — left-handed, unlucky
Ethnicity or culture: T´ot — Slovak, generic term for anyone of Slavic origin in the middle ages, N´emet — German, Ol´ah — Romanian, R´acz — Serbian or anyone from the south, T¨or¨ok — Turkish
The rest: Pap — priest (serf belonging to a church property), Simon — Biblical origin, Szil´agyi — “from Szil´agy”; Szil´agy is a common settlement name and later the name of a county. Source: Hajd´u (2010)
with a growth rate of more than 10% between their respective population counts in 1998 and in 2016.16
4.3 Data
The estimation of surname-based social mobility measures requires two types of data.
The first is the population shares of traditional upper- and underclass surnames. The second is the shares of these surnames in various elites.
4.3.1 Population shares
We estimate population shares of surname groups from a sample of marriage records from 1940 to 1951 and the complete population registers of 1998 and 2016, interpolating for the years between 1951 and 1998, and between 1998 and 2016.
The sample of marriages contains 842,000 people, and it was digitalized by the Hungarian Society for Family History Research.17As the goal of the compilers is to digitalize all available records, we assume that the data represent a random sample of all marriages in this period. Before World War II, the average annual number of marriages was 16,672, but after the number dropped to 6,774 marriages annually. The coverage rate as a share of all marriages is 9.5% in 1938, and 2.5% in 1949 (Bal´azs 1993).
We obtained the complete surname distribution of Hungary in 1998 and 2016 from the Ministry of the Interior. The data includes the list of all surnames and the exact number of people having them, excluding (for privacy reasons) surnames held by a single person.
4.3.2 Elite groups
Educational elites. We consider three different sets of elite groups: educational, gen- eral and political. We capture educational elites from three data sources. The first and most comprehensive is the distribution of surnames of Hungarian medical school graduates. We have records of all medical graduates from Hungarian universities from 1940 to 2017.18The list of graduates was provided by the State Healthcare Ser- vice Center. In order to measure the change in the relative “eliteness” of the medical profession (αt%) we calculate the share of all medical graduates as a percentage of the cohort of the 25 years old in every year. The latter information is available at
16The average growth rate identified as Romani by the Encyclopedia of Surnames between 1998 and 2016 was 17%. The names that had the highest growth rates between 1998 and 2016 were those potentially attributable to recent immigration (e.g. Asian and Middle Eastern names). To avoid confounding these with Romani names, we also imposed a requirement that a name included in our set had to have at least as many occurrences in 1998 as the least common name that was associated with the Romani in the Encyclopedia.
17The records were digitized by the Hungarian Society for Family History Research, who kindly shared the yearly surname distribution. The dataset is athttp://www.macse.hu/databases/en/default.aspx.
18Physician are trained at four different Hungarian universities. See Kapronczay (2013) and Kiss (2018) and P´eterffy (2016) for a brief history.
the web page of the Hungarian Central Statistical Office (KSH).19During the whole study period the share of medical graduates remains remarkably stable at around 1%
of the respective cohort. Quantitative evidence shows that the medical profession still attracted the best students in the period of 2008 to 2015 (F´abri2016).
The next educational elite are the PhD graduates of Budapest University of Tech- nology and Economics, whose names we collected from the Millennium Yearbook issued by the university in 2000 (Kiss2000). It allows us to estimate social mobility rates from 1960 to 2000. In the case of PhD graduates we keep track of the relative
“eliteness” by assuming that the group represented the top 1% in the 1960s, and then its exclusivity changed proportionally to the total number of PhD graduates (i.e. dur- ing the seventies the number of graduates increased by 46% relative to the sixties, so we assumed anαtof 1.46%).
Finally, we constructed the list of those who earned a (non-doctoral) university diploma using the university yearbooks that were published on the university website from 1962 to 1999.20 Non-medical degree programmes at universities were uni- formly 5 years long in the period covered by our data. Because of this, we will refer this group as “masters” (as they earned the equivalent of a combination of a Bache- lor of Sciences and a Master of Sciences degree). In their case the relative “eliteness”
measure is the share of people with any university degree in the young adult cohort.
This way we account for a general university diploma inflation that took place over time.
General elites. We capture general elites by looking at inventors and people men- tioned in the Hungarian edition of “Who is Who”. The data on Hungarian inventors come from the worldwide patent statistical database PATSTAT. We create a list of unique inventor-decade-application observations starting from 1970, the year when Hungary joined the World Intellectual Property Organisation. We look at appli- cations instead of granted patents; we do not distinguish between Hungarian and international applications.21
The second general elite name set is based on the scanned version of the Hungarian edition of H¨ubners Who is Who, a collection of biographies of famous people (G´abor et al.2011).22 The Who is Who reflects a general idea of “being famous” for any reason. Unfortunately, we do not know which year a person entered Who is Who, just their year of birth. Because of this, we created a panel of synthetic cohorts where every individual is assigned to the cohort when they turned 23.
In case of the general elites we assumed that in the first decade their relative exclu- sivity wasα1 =1%, and then adjusted it according to the number of inventors and Who is Who items per decade. So 7265 individuals applied for patents in our sam- ple in the 1970s, and we assign 1% eliteness to this value; if this number increased
19Source:https://www.ksh.hu/interaktiv/korfak/orszag.html
20The yearbooks are available at https://library.hungaricana.hu/hu/collection/egyetemi jegyzokonyvek bme evkonyv/
21Usually patenting an invention is connected with several applications, called afamily. We collapse the data to families instead of individual patents.
22We thank Mikl´os Koren, ´Ad´am Szeidl and Andr´as Vereckei for letting us use these data.
to 14530 in a subsequent decade, we would adjust the exclusiveness of the inventor group to 2%.
Political elites. Finally, we also look at political elites. We include in this group two sets of names, first is the Members of Parliament, the second is the members of the Hungarian Academy of Sciences.
The first democratic elections after World War II were held in November 1945;
parties were free to participate except for prominent parties of the preceding right- wing regime. The subsequent 1947 elections were marked by voter fraud by the Hungarian Communist Party, who won the plurality of the votes, but were still very far from commanding a majority in the National Assembly. They merged with the Social Democrats and took power nevertheless, and between 1949 and 1980 par- liamentary “elections” featured a single candidate of what was by then called the Hungarian Working People’s Party (later the Hungarian Socialist Workers’ Party) in each electoral district. The first multi-candidate election took place in 1985, but still the overwhelming majority of candidates were communist party members. After the transition to democracy, the first free and fair election took place in 1990.
We manually collected the list of all members of the Hungarian Parliament since it first convened as an elected, representative legislature in 1848. For the pre-1990 cycles we used three main sources. The primary sources were the Almanacs of the Hungarian National Assembly and the address books of the Hungarian National Assembly. For electoral cycles where these did not provide name lists of the repre- sentatives, we used the verbatim records of the first session following the election where the credentials were passed to all newly elected members.23The data source for the post-communist period is the current home page of the Hungarian National Elections.24
We complement the picture of political elites with the data on the members of the Hungarian Academy of Sciences.25The Hungarian Academy of Sciences was estab- lished from private donations in 1825 as a body of scholars deemed best at their fields whose goal was to preserve and promote Hungarian culture and science. In its present form, new members are elected by current members, and the maximum number of members under the age of 70 is fixed by law at 200 (Act XL of 1994 on the Hungar- ian Academy of Sciences). Although this recruitment procedure lends a great degree of formal independence to the body, because of the high standing and authority of the members and the body as a whole, the Hungarian Academy of Sciences has always had political importance. Communists in 1949 purged members who were deemed ideologically unfit, whose membership was restored after the democratic transition.
23All of these are available online as PDF-s at the Hungaricana Hungarian Cultural Heritage Portal:
Almanacs:https://library.hungaricana.hu/hu/collection/ogyk almanach/
Address books:https://library.hungaricana.hu/hu/collection/ogyk lakaskonyv/
Session records:https://library.hungaricana.hu/hu/collection/orszaggyulesi dokumentumok/
24https://www.parlament.hu/web/guest/kepviselok-elozo-ciklusbeli-adatai
25Available from Mark´o et al. (2003); more recent appointments can be found on the homepage, seehttps://
mta.hu/mta tagjai.
Before turning to the analysis we make three further adjustments. First, to have an overall picture of Hungarian society we exclude foreigners whenever their presence in the data would be an issue. In the case of the medical graduates the State Health- care Center data lets us directly exclude foreign medical students. In the case of the graduates of Budapest University of Technology and Economics, if the nationalities of the students were listed we used this information to detect foreigners, otherwise, we detected foreign students based on their names. We do not face this problem neither with the general elite data, nor with the political elite data.26
Second, as all our sample included women as well, we have to overcome the issue of changing surnames upon marriage. In Hungary, the most common way of changing surname upon marriage is to chose the surname of the husband and augment it with a special ending (“-n´e”) and either keeping the maiden name as a second surname or drop the maiden name entirely. Due to this rule, we can tag married women based on their name, and for most of them, we can recover their maiden name as well. We used the maiden name in the analysis whenever it was possible. We handled this issue in the same way in all the data sources. As a robustness check, we carried out the analysis separately by genders using the medical data (where this information was given), and we found no significant differences in social mobility rates.
Third, the political elites contain very limited number of individuals, even com- pared to the other elite groups. Elections take place only every 4 to 5 years, and there is a large continuity in membership from one cycle to the next. The composition of the Academy changes even more slowly (most of the time). Also, we cannot make the assumption that people become members of these bodies at a certain age. Con- sequently, we can only work with relative representation ratios with these data, as our model of latent social status is not applicable in their case. For the Parliament we calculate relative representation ratios over time for each election cycle. For the Academy of Sciences we create a yearly pseudo-panel where the observations reflect the name structure in any given year, and we calculate relative representation figures from this data.
4.4 Descriptive statistics
Table1shows the observation counts from each set of elite names. Table2, Panel A shows the estimated population share of each surname group between 1940 and 2017.
We see significant differences between the 1940s and the 1950s due to World War II and its aftermath, which dramatically reshaped Hungarian society and its surname distribution.27Two important features of the data are the gradual decrease in the share
26The general elite data includes only Hungarian nationals, we did not have to adjust it. Members of Parliament are also Hungarian nationals. While the Hungarian Academy of Sciences confers honorary memberships to scholars in other countries, we limit our attention to full and corresponding members, who are all Hungarian nationals as well.
27The Hungarian Jewry was among those Jewish communities of Europe that suffered the highest loss of life both in absolute and relative terms during the Holocaust (Braham1981). After the war, hundreds of thousands of ethnic Germans fled or were driven out of Hungary. At the same time, neighboring coun- tries, such as Czechoslovakia, expelled large chunks of the ethnic Hungarian population. In the meantime, many people from the Slavic minorities in Hungary decided to emigrate to neighboring Slavic-majority
Table1Numberofobservations DecadeMedicaldoctorsTechnicalPhDTechnicalmasterInventorsWhoisWhoParliamentMembersoftheHAS 1950101152563649 196013313119816174352468961 197010950174728192726511692704123 198010604231919836242231817973888 1990974517501529412522136241212157 200010770868311221818117 2010126636836829117 Total7816070397949659529582405626712 Notes:Thetableshowsthenumberofpeopleinalleliteoccupationsavailabletoouranalysisaggregatedtodecades.MedicaldoctorscorrespondtothesumofHungarian nationalswhograduatefromoneofthefourHungarianmedicalfaculties(SemmelweisinBudapest,andtheuniversitiesinthetownsofDebrecen,P´ecsandSzeged). TechnicalPhDsandTechnicalmasterscorrespondtograduatesofBudapestUniversityofTechnology.InventorsarecollectedfromthePATSTATdatabase.WhoisWho correspondstonamesinH¨ubnersWhoisWho(G´aboretal.2011).MembersofParliamentarecountedinelectionyearsandincludeeveryonewhowinsaparliamentary seatduringtheelectioncycle(specialelectionsincludedafter1990).MembersoftheHungarianAcademyofSciences(HAS)inthistablearenewlyelectedfullmembersor correspondingmembersineachdecade
Table2Socialstatusofsurnametypes,1940–2017—medicalgraduates Decade..ysurnamesHigh-status20mostLow-statusRomani- surnames1920–39commonsurnamessurnames1920–39associatedsurnames PanelA:Populationshares 1940–490.0250.0050.2320.0740.012 1950–590.0240.0050.2550.0710.013 1960–690.0220.0050.2490.0700.016 1970–790.0210.0050.2430.0700.020 1980–890.0200.0060.2370.0690.023 1990–990.0190.0060.2310.0680.026 2000–090.0180.0060.2290.0680.029 2010–190.0180.0060.2290.0680.032 PanelB:Relativerepresentationamongdoctors,vstotalpopulation 1940–494.575.800.520.050.81 1950–594.012.930.570.670.56 1960–693.723.340.660.680.49 1970–793.222.570.700.600.43 1980–892.502.110.770.620.36 1990–992.862.160.800.640.33 2000–092.692.050.860.800.31 2010–192.642.080.910.790.33
Table2(continued) Decade..ysurnamesHigh-status20mostLow-statusRomani- surnames1920–39commonsurnamessurnames1920–39associatedsurnames PanelC:Impliedmeansocialstatus 1940–490.570.68-0.20-0.23-0.07 1950–590.510.40-0.18-0.14-0.18 1960–690.490.44-0.14-0.12-0.23 1970–790.430.34-0.11-0.17-0.28 1980–890.340.27-0.07-0.15-0.33 1990–990.380.28-0.07-0.14-0.36 2000–090.360.25-0.05-0.07-0.37 2010–190.360.27-0.02-0.07-0.36 Notes:PanelAshowsthepopulationsharesofthegroupsdefinedbysurnametype(seethetextfordefinitions).PanelBshowstherelativerepresentationofthesurname groupsamonggraduatesofmedicaluniversitiesinHungary.Therelativerepresentationisdefinedastheratiooftheshareamonggraduatestothepopulationshare.PanelC showsestimatesofmeanstatusexpressedasstandarddeviationunitsdifferenceaboveorbelowthesocialmean.Themeanstatusisestimatedfromrelativerepresentations (seethetextformoredetails).AppendixTableA4onpage75ofBukowskietal.(2021)showsthesamemeasurementsusingthenon-Romanipopulation
of the..ysurnames (by about 25%) over two generations and the more than two-fold increase of the share of the Romani-associated surnames over the same period. As we show in Section5.2, the estimates of the actual Romani population share (which are scarce) show a similar trend. Otherwise, the name distribution is very similar in the 1950s as in the 1990s and 2010s.
5 Social mobility, 1949–2017 5.1 Educational elites
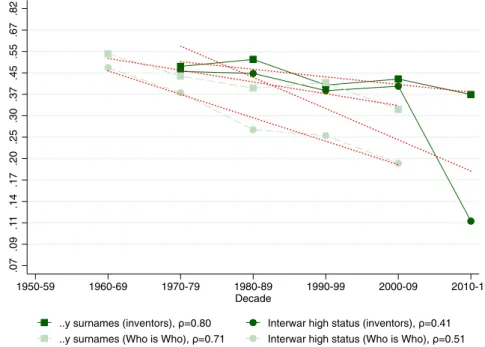
Our first set of results concerns the estimates of social mobility using data on medical school graduates. For reasons explained below, we estimate the status of the two high- status social groups (the..yending surnames and the interwar high-status group) and the two low-status social groups (the top 20 most frequent surnames and the interwar low-status group) relative to the non-Romani population. In Table A3 on page 74 of Bukowski et al. (2021) we show the re-calculated population shares and the estimated share of the Romani population over time.
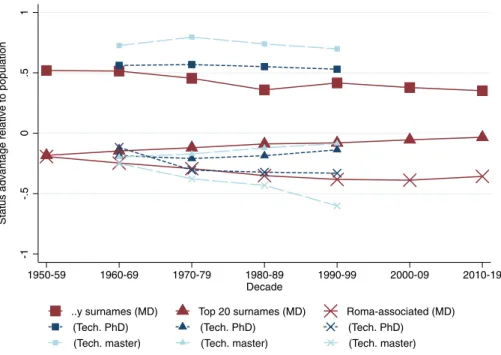
The relative representation of the five surname groups among Hungarian medical graduates in 1940–2017 is shown in Table2, Panel B. Using these data we calculate the implied mean status for each surname group in each decade shown in Table2, Panel C.28 Figures2,3,4,5and6show the implied mean status by decade com- pared to the non-Romani population and the implied intergenerational correlation of educational status, assuming a generation is 30 years.
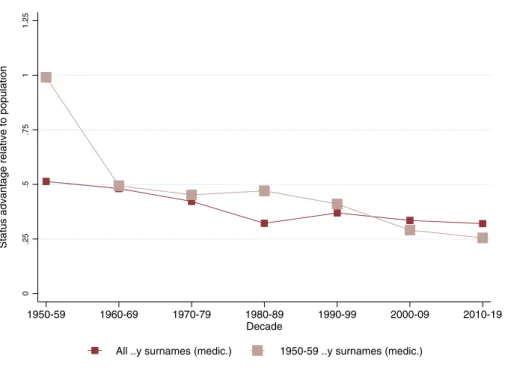
Figure2shows the status advantage of high-status names over the study period.
We document an intergenerational correlation ofρ = 0.78 for the..yending sur- names, andρ=0.72 for the interwar high-status group. The figure shows that at the onset of the communist period the average..yending named individual was about 50% of a standard deviation above the average person in society, and this advantage has only diminished to about 30% of a standard deviation by present times, showing considerable persistence over two generations. The interwar high-status group has a lower status advantage to begin with, but progresses towards the mean by an almost identical (slow) pace. There is also no visible deviation from previous trends after transitioning to capitalism.
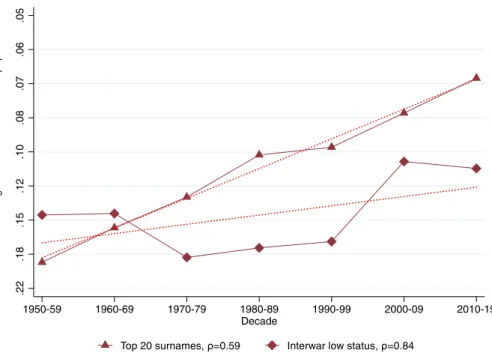
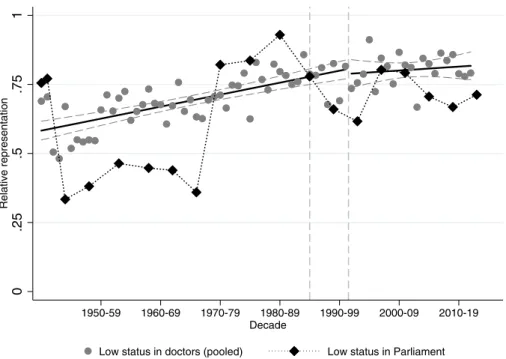
Figure 3shows the status advantage estimates for low-status surnames among medical doctors. The group of the top 20 most frequent surnames progresses to the mean more rapidly, reducing its disadvantage from 18% of a standard deviation below the mean in the 1950s to 7% below the mean in the 2010s. The intergenerational cor- relation coefficient in their case isρ =0.59. The interwar low-status group shows a more persistent social status with a correlation coefficient ofρ=0.84.
countries. Many of those who had Jewish, German or Slavic backgrounds and decided to remain chose to adopt a Hungarian surname. This movement lost intensity by the 1950s (Kar´ady and Kozma2002)
28The tables show the raw data; the adjusted data is shown in Table A4 of Bukowski et al. (2021) (page 75).