Reduced Inflammatory Threshold Indicates Skin
Barrier Defect in Transglutaminase 3 Knockout Mice
Peter Bognar1, Ilona Nemeth1, Balazs Mayer1, Dora Haluszka1, Norbert Wikonkal1, Eszter Ostorhazi1, Susan John2, Mats Paulsson2, Neil Smyth3, Maria Pasztoi4, Edit I. Buzas4, Robert Szipocs5, Attila Kolonics5, Erzsebet Temesvari1and Sarolta Karpati1
Recently, a transglutaminase 3 knockout (TGM3/KO) mouse was generated that showed impaired hair development, but no gross defects in the epidermal barrier, although increased fragility of isolated corneocytes was demonstrated. Here we investigated the functionality of skin barrierin vivoby percutaneous sensitization to FITC in TGM3/KO (n¼64) and C57BL/6 wild-type (WT) mice (n¼36). Cutaneous inflammation was evaluated by mouse ear swelling test (MEST), histology, serum IgE levels, and by flow cytometry from draining lymph nodes. Inflammation-induced significant MEST difference (Po0.0001) was detected between KO and WT mice and was supported also by histopathology. A significant increase of CD4þ CD25þ-activated T cells (Po0.01) and elevated serum IgE levels (Po0.05) in KO mice indicated more the development of FITC sensitization than an irritative reaction. Propionibacter acnes–induced intracutaneous inflammation showed no difference (P¼0.2254) between the reactivity of WT and KO immune system. As in vivo tracer, FITC penetration from skin surface followed by two-photon microscopy demonstrated a more invasive percutaneous penetration in KO mice. The clinically uninvolved skin in TGM3/KO mice showed impaired barrier function and higher susceptibility to FITC sensitization indicating that TGM3 has a significant contribution to the functionally intact cutaneous barrier.
Journal of Investigative Dermatology(2014)134,105–111; doi:10.1038/jid.2013.307; published online 29 August 2013
INTRODUCTION
Our knowledge on epidermal differentiation and keratiniza- tion has significantly grown within the last decade. Recent studies provide a large amount of information on proteins and enzymes of the skin barrier; however, their significance in the clinical setting is only partially understood.
The epidermal barrier has a key role in skin homeostasis and mostly environmental antigens penetrating this barrier are able to induce reactions in the skin-associated adoptive and/or innate immune system and promote irritative or allergic contact dermatitis.
Transglutaminases (TG) are a group of Ca 2þ-dependent enzymes, which catalyze formation of covalent isopeptide bonds and produce stabilizing cross-links between protein networks. Some of these structures contribute to an effective barrier in the skin and mucosa. TGs were first described in 1959 (Clarkeet al., 1959), but the exact biological function of a TG enzyme, Factor XIIIa, in the process of blood coagulation was only discovered in 1968 (Pisano et al., 1968). So far, eight TGs have been identified (Hitomiet al., 2001; Griffin et al., 2002; Eckert et al., 2005). In the outer layers of the skin and hair follicle, mainly keratinocyte-type TG (TG1) and epidermal-type TG (TG3) are expressed.
Defective cross-linking of the cell envelope because of mutations in the TGM1 gene has been found in patients suffering from lammelar ichthyosis (Huberet al., 1995; Russel et al., 1995). Accordingly, TGM1 knockout mice develop an erythrodermic skin with impaired barrier function (Matsuki et al., 1998). Although no in vivo role for TG3 has been described, it is highly expressed in the late differentiating keratinocytes, corneocytes, and the hair follicles. TG3 is also a major antigen in dermatitis herpetiformis where TG3-IgA immune complexes are deposited in the papillary dermis (Sardyet al.,2002).
Recently, a transglutaminase 3 knockout (TGM3/KO) mouse was generated that showed impaired hair development, but no gross defects in the epidermal barrier (Johnet al., 2012). Here we further investigated in these mice the functionality of the skin barrier by a generally accepted and widely used Th2
1Department of Dermatology, Venereology and Dermato-oncology, Semmelweis University, Budapest, Hungary;2Center for Biochemistry, Medical Faculty, Center for Molecular Medicine and Cologne Excellence Cluster on Cellular Stress Responses in Aging-Associated Diseases, University of Cologne, Cologne, Germany;3Centre for Biosciences, University of Southampton, Southampton, UK;4Department of Genetics, Cell- and Immune Biology, Semmelweis University, Budapest, Hungary and5Institute for Solid State Physics and Optics, Wigner RCP, Laser Applications, Budapest, Hungary Correspondence: Sarolta Karpati, Department of Dermatology, Venereology and Dermato-oncology, Semmelweis University, Ma´ria Utca 41, Budapest 1085, Hungary. E-mail: skarpati@t-online.hu
Received 2 May 2012; revised 24 April 2013; accepted 16 May 2013;
accepted article preview online 24 July 2013; published online 29 August 2013
Abbreviations: CH, contact hypersensitivity; DBP, dibutyl-phtalate; ET, ear thickness; KO, knockout; LN, lymph node; MEST, mouse ear swelling test;
PBS, phosphate-buffered saline; SPINK5, serine protease inhibitor Kazal-type 5;
TG, transglutaminase (protein); TGM, transglutaminase (gene); TGM3/KO, transglutaminase 3 knockout; WT, wild type
mouse model of contact hypersensitivity (CH) induced by the hapten FITC solved in aceton and dibutyl-phtalate (DBP). We found a significantly larger and more progressive cutaneous inflammation at the site of FITC re-exposition in 24 and 48 hours in KO mice when compared with the C57BL/6 wild-type (WT) animals. In the current study, we used the FITC–DBP system (Kripkeet al., 1990; Satoet al.,1998; Imai et al., 2006; Maruyamaet al.,2007) with some modifications and demonstrated, to our knowledge, a previously unreported functional damage of the skin barrier in mice with genetic absence of TG3.
RESULTS
TGM3/KO mice skin allows significantly stronger FITC penetrationin vivoby two-photon microscopy
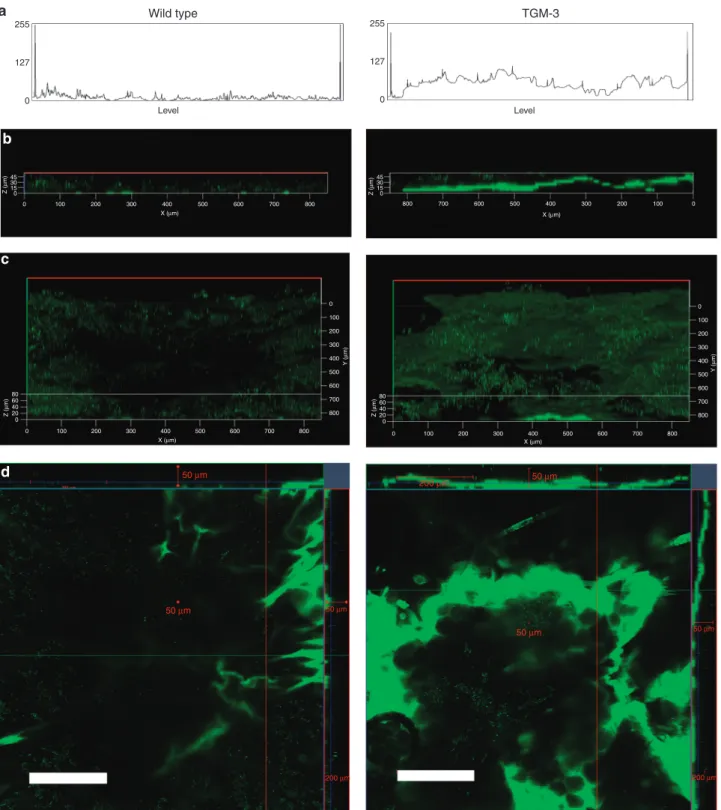
We assessed the penetration pattern of FITC (solved in dimethyl sulfoxide-distilled water) on the dorsal skin surface of earlobes in anesthetized TGM3/KO and WT mice (n¼3 per group) in vivo by two-photon microscopy. The penetration pattern was different between KO and WT animals. In WT mice, FITC showed a rather faint, scattered, and blurred front of fluorescence during penetration through the epidermis, in contrast to TGM3/KO mice in which a wide, sharp, 20mm deep band-like fluorescence-front was detec- table (Figure 1a and b) at 30 minutes. Quantification data based on different representative orthogonal cuts of layers captured at 30 minutes revealed significant 4.5±0.5-fold increase of FITC fluorescence in TGM3/KO skin compared with control WT skin.
By a two-photon imaging of the stained skin surface, the stratum corneum presented distinctive fluorescence patterns labeling more intensively the cornified cell envelope and some corneocytes in KO than in WT animals, indicating different penetration pattern through the barrier (Figure 1d).
TGM3 KO mice show significantly increased ear swelling in response to FITC sensitization
First, we analyzed the increase in ear thickness (ET) in each group 24 and 48 hours after FITC or vehicle re-exposure, and analyzed the data for genders separately.
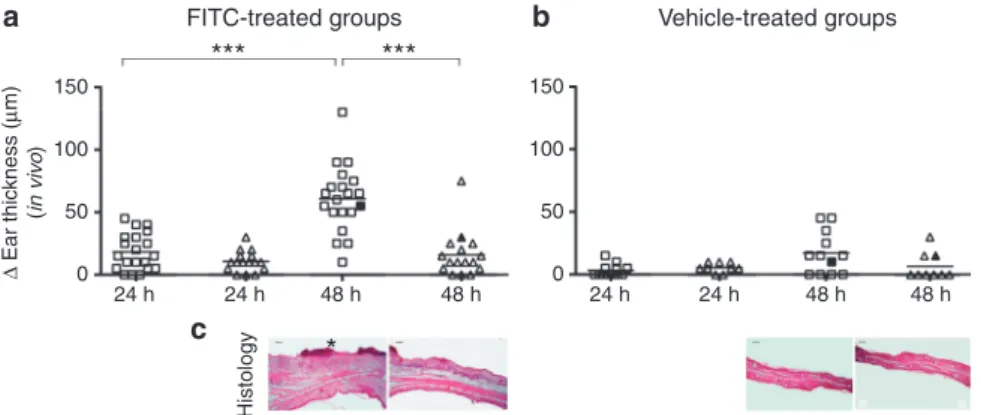
The average increase in ET (DET) among the FITC-treated female TGM3/KO mice (n¼20) was 18±13mm at 24 hours, and 61±19mm at 48 hours. In the group of WT female ani- mals (n¼16),DET was 11±6mm at 24 hours and 16±12mm at 48 hours, showing highly significant difference at 48 hours, compared with KO animals (Po0.0001, Mann–Whitney test;
Figure 2a).
In the vehicle-treated female TGM3/KO group (n¼12), the average extent ofDET was 3±4mm at 24 hours and 17±14mm at 48 hours, whereas in the vehicle-treated WT female group (n¼9) this value was 6±3mm at 24 hours, and 7±9mm at 48 hours, respectively, showing no significant difference (Figure 2b).
In the group of male mice, similar data were found.
The averageDET in the group of FITC-treated male TGM/KO mice (n¼18) was 19±16mm at 24 hours and 68±29mm at 48 hours. The FITC-treated WT male animals (n¼6) exhibited an average DET of 10±7mm at 24 hours and 33±15mm at
48 hours, and these data were also significantly different (Po0.0001, Mann–Whitney test) at the 48 hours evaluation.
Among the vehicle-treated male TGM3/KO mice (n¼14), the averageDET reached 2±3mm at 24 hours and 10±10mm at 48 hours. Whereas in the vehicle-treated male WT group (n¼5), these values were 3±4mm at 24 hours and 7±6mm at 48 hours, showing no significant difference between vehicle- treated groups (data not shown).
Increased cutaneous inflammation in FITC sensitized TGM3/KO mice
In parallel with theDET, the skin histology from the removed ears in FITC-treated TGM3/KO and WT mice showed a dermal infiltration of lymphocytes and neutrophils around the dilated small arterioles and capillaries; however, the inflammation was more pronounced /þþ/ in TGM3/KO than in WT /þ/ animals by semiquantitative evaluation as described in Materials and Methods. Both the TGM3/
KO /þþ/ and WT /þ/ FITC-treated animals developed epidermal hyperproliferation and spongiosis. None of the vehicle-treated animals displayed histological signs of inflammation. (Figure 2c).
By toluidine blue staining, the number of subepidermal mast cells did not differ in the FITC-treated TGM3/KO and WT mice or in the vehicle-treated groups (data not shown). The average mast cell number was 410 intensely stained mast cells per field.
Demonstration of FITCþcells in draining lymph nodes (LNs) and increased level of activated T lymphocytes in FITC-sensitized TGM3/KO animals
LN cell suspensions of FITC-treated KO and WT mice (n¼5 per group) were studied by flow cytometry. First, we wanted to explore whether in FITC-challenged mice fluorescent cells appear in the draining LNs. We could detect slightly more FITCþ cells in TGM3/KO mice than in WT ones, indicating that more FITCþ non-lymphocytic cells arrive from the epidermis following FITC sensitization (data not shown).
Next, we wondered whether draining LNs from TGM3/KO animals developed increased lymphocyte activation after FITC re-exposure. As shown in Figure 3, CD4þCD25þ cells corresponding to the activated T-helper cells were highly elevated in the TGM3/KO group compared with the WT controls (Po0.01, Mann–Whitney test). In the case of the vehicle treatment, there was no difference between the WT and KO populations (data not shown).
Significantly elevated total serum IgE levels in FITC-treated TGM3/KO mice
In parallel with T-cell activation, a significant growth in serum IgE levels was measured in sera from FITC-treated TGM3/KO mice compared with WT mice (n¼5 in each group).
The total serum IgE levels in FITC-treated WT mice was 868 ng ml1±107 (SEM), whereas the total serum IgE in FITC- treated TGM3/KO mice increased to 2,810 ng ml1±796 (SEM), the difference proved to be significant ((Po0.05) P¼0.042, Student’st–test; Figure 4).
Wild type
255
127
0
Level
4530 15 0
0 100 200 300 400
X (μm)
Y (μm)
500 600 700 800
0 100 200 300 400
X (μm) 500
50 μm
50 μm 50 μm
50 μm 200 μm
50 μm 50 μm
200 μm 200 μm
600 700 800 0 100 200 300 400
X (μm)
500 600 700 800
0 100 200 300 400 500 600 700 800
Y (μm)
0 100 200 300 400 500 600 700 800 Z (μm)Z (μm)
80 60 40 20
0 Z (μm)
80 60 40 20 0 45 3015 0
100 0
200 300 400 X (μm) 500 600 700 800
Z (μm)
255
127
0
Level
TGM-3
Figure 1. Penetration of FITC through stratum corneum in transglutaminase 3 knockout (TGM3/KO) and wild-type (WT) mice skinin vivoby two-photon microscopy.(a,b) xz-Multitracking sections composed from a stack of xy-optical sections with 8mm distance were recorded from the skin surface (Z¼0mm) down to the bottom. The representation reveals the frontal penetration profile of FITC in the TGM3/KO skin reaching an average ofB20mm depth after 30 minutes.
A more limited FITC uptake was detected in WT skin both by line analysis (a) and by fluorescence imaging (b). The line analysis demonstrates the average fluorescence intensity (on vertical axis) measured along 850mm length of the tissue sample (horizontal axis) (a). (c,d) Three-dimensional images also demonstrated marked differences in FITC distribution pattern. Interconnected layers of coalescent FITC staining were found in TGM3/KO skin, whereas fine scattered FITC fluorescence was found in the WT skin (d,c). 850mm length of the tissue sample is presented in panelsa–c. On orthogonal cuts, a distinctive fluorescence pattern labeled more intensively the cornified cell envelope and some corneocytes in KO than in WT animals and indicated different penetration through the barrier.
Quantification data showed significant 4.5±0.5-fold increase of FITC fluorescence in TGM3/KO mice compared with WT skin (bars¼200mm) (d) (study performed altogether in three mice of each group; representative data are shown).
Contrary, there was no significant difference in serum IgE levels between FITC-naive TGM3/KO and WT mice (n¼5 in each group; data not shown).
No difference in mouse ear swelling test (MEST) between TGM3/KO and WT mice after intradermalPropionibacter acnesinjection
To investigate whether the immune system of the TGM3/KO mice are generally more reactive to antigenes compared with WT ones, we injected animals either withP. acnessuspension or with phosphate-buffered saline (PBS) intradermally into their two different earlobes (n¼3 per group). Under these circumstances, independently of the epidermal barrier, the same amount of antigen load met the immune system of KO and WT animals.
We evaluated the inflammation by MEST serving the contral- ateral PBS-treated ear as control (Nakatsuji etal, 2009).
The average ET rate at 48 hours afterP. acnesinjection was related to that after PBS injcetion and the difference was 27%±19.3% in TGM3/KO and 25%±12.2% in WT mice, respectively (These values indicated no significant difference between the two groups (P¼0.2254, Man–Whitney test;
Figure 5.). These data support the hypothesis that the higher rate of CH to FITC in TGM3/KO mice is rather a consequence FITC-treated groups Vehicle-treated groups
150 100 50 0
150 100 50 0
Histology
*
Δ Ear thickness (μm) (in vivo)
*** ***
24 h 24 h 48 h 48 h 24 h 24 h 48 h 48 h
Figure 2. Significant ear thickening and histological signs of inflammation to FITC sensitization in transglutaminase 3 knockout (TGM3/KO) compared with wild-type (WT) mice.On the vertical axis, ear thickening is indicated inmm. ‘‘&’’ TGM3/KO, ‘‘D’’ WT mice. A significant ear thickening was detectable upon FITC treatment, between KO and WT animals at 48 hours (a). Although the difference was not significant, there was also more thickening in the vehicle-treated KO mice than in the vehicle WT mice (b). (c) Histology is shown for the filled symbols. TGM3/KO mice at 48 hours showed with prominent inflammation, dermal infiltration, epidermal thickening, spongiosis, and notable crust formation (marked with ‘‘*’’). WT mice developed mild-to-moderate inflammatory cell infiltration and thickened epidermis upon FITC sensitization. Vehicle-treated WT and TGM3/KO mice showed only mild edema. ***Pp0,0001, Mann–Whitney test.
Bar¼40mm.
30
TGM3 KO 104
104 103
103 102
102
CD4
CD25 101
101 100
100
** WT
25 20 15 10
% Lymphocyte gate
5 0
CD4+ CD25 + CD4+ CD25 + Figure 3. FACS analysis of draining lymph nodes shows an increased population of activated T-helper cells upon FITC treatment in
transglutaminase 3 knockout (TGM3/KO) mice.Cells were isolated from draining lymph nodes 48 hours after re-exposure to FITC. In the inset (upper right corner), distribution of lymph node cells are shown in a FITC-treated TGM3/KO mice. Empty bars refer to TGM3/KO, black bars for wild-type (WT) mice. Data are mean±SEM (n¼5). Activated T-helper cells were highly elevated in the FITC-treated TGM3/KO group when compared with the FITC-treated WT controls (**Po0.01, Mann–Whitney test).
4,000 *
3,000 2,000 1,000
Serum IgE ng ml–1
0
TGM3/KO WT
TGM3/KO WT
Figure 4. Significantly elevated total serum IgE levels in FITC-treated transglutaminase 3 knockout (TGM3/KO) mice.Significantly higher serum IgE levels in sera from FITC-treated TGM3/KO mice when compared with wild-type (WT) mice. Total serum IgE level in FITC-treated WT mice was 868 ng ml1±107 (SEM), whereas the total serum IgE in FITC-treated TGM3/KO mice increased to 2,810 ng ml1±796 (SEM). Empty bars refer to TGM3/KO, black bars to WT female mice. Data are mean±SEM (n¼5;
*Po0.05, Student’st-test).
5045 40 3530 2520
Δ ET %
15 105 0
WT TGM3/KO
Figure 5. Propionibacter acnesinduced mouse ear swelling test response 1014 colony-forming unit ofP. acneswere injected intradermally to earlobes of transglutaminase 3 knockout (TGM3/KO) and wild-type (WT) mice.DEar thickness (ET) was evaluated at 24 hours. On the vertical axis,DET is shown in percentage (data are mean±SEM,n¼3), empty column refers to TGM3/KO, black to WT mice. Ear swelling response toP. acnesantigen load does not show significant difference between the two groups.
of an impaired skin barrier than an increased activity of the TGM3/KO immune system.
DISCUSSION
Defects of structural proteins like filaggrin (Sandilands et al., 2007; Giwercmanet al., 2008), or protease inhibitors (serine protease inhibitor Kazal-type 5) and cross-linking enzymes such as TG1, have been shown to be associated with damaged cornified cell envelope formation and an enhanced percutaneous sensitization rate (reviewed by Kubo et al., 2012). The role of TG3, a transglutaminase present in the cornified cell envelop and the uppermost layer of the stratum granulosum, however, remains largely unexplored in these processes. Unexpectedly, the recently developed TGM3/KO mice did not show any major barrier defect under steady-state conditions as indicated by the normal transepidermal water loss, dye penetration, and intact skin structure, although an increased fragility of the isolated corneocytes was detected (Johnet al., 2012).
To further analyze the function and pathology of the apparently normal cutaneous barrier in animals without TG3, we chose to study the development of CH in a well- characterized FITC-induced CH mouse model. Using MEST, we detected a more severe inflammatory response in the KO animals as compared with the control group, peaking at 48 hours. Vehicle (aceton/DBP)-treated control mice showed only mild edema without significant inflammatory infiltration.
KO mice showed somewhat more reaction than WT animals, but without reaching significance (Figure 2).
Although the detailed immunological analysis of FITC- induced CH generally was beyond the scope of this paper, we evaluated the CD4/CD25-activated T-cell population collected from the draining LNs, and TGM3/KO mice had significantly more activated T cells than WT cells upon FITC re-exposure, a further indicator of CH. Considering that immune responses on the background of TGM3/KO mice (C57BL/6 strain) are predominantly Th-1-biased (Takeshita et al., 2004), the observed significant increase in serum IgE levels in FITC-sensitized TGM3/KO animals suggested a percutaneously induced Th2-dominated adaptive immune response (Dearman and Kimber, 2000, Larsonet al., 2010).
To test the non-percutaneously induced immune reactivity of TGM3/KO mice, we injectedP. acnesintradermally to the ears of untreated mice. These bacteria are known to evoke a strong, long-lasting immune response in loco (Nakatsujiet al., 2009). The similar reactivity of KO and WT animals to P. acnes indicated that the more severe CH provoked by FITC in TGM3/KO mice is due to an impaired skin barrier rather than a generally increased reactivity of the cutaneous immune system for other reasons.
Contrary to the normal fluorescent dye penetration observed by John et al. (2012), in this study we experienced an enhanced FITC entry through the cornified envelope. The different outcome can be due to the stereochemically different dyes used; Lucifer yellow has a larger molecular mass, and a vastly different water/lipid solubility as opposed to FITC, the dye that we studied. Furthermore, the penetration studies were performed previously on cadaver back skin of newborn mice,
whereas in our experiments we studied 8- to 12-week-old animals and focused on the ear. It is well -known that there are structural and physiological differences between the two skin areas. Also, two-photon microscopy is considered to be a much more sensitive and precise technique than plain fluorescence microscopy, which enables us to follow real- time dye penetration.
The different FITC penetration patterns in KO and WT animals and a 4.5±0.5-fold FITC fluorescence increment in TGM3/KO compared with WT skin detected by in vivotwo- photon microscopy may serve as a further proof of damaged skin barrier function in TGM3/KO animals. The normal transepidermal water loss in these animals do not contradict our results, as the filaggrin-deficient flacky-tail mice also showed almost normal transepidermal water loss but exhibited a paracellular barrier defect and a reduced inflammatory threshold to haptens and irritants (Scharschmidtet al.,2009).
All these studies verified a clinically latent barrier defect in TGM3/KO mice, which is associated with a significant susceptibility to sensitization upon percutaneous FITC chal- lenge and indicates a reduced inflammatory threshold.
Consequently, these data suggest that the enzymatic activity of TG3 has a remarkable contribution to the epidermal barrier function.
MATERIALS AND METHODS Mice
TGM3/KO mice (John et al, 2012) on a C57/BL6 backround (males n¼32, females n¼32) and WT animals (females n¼25, males n¼11) were studied for CH (8- to 12-week old). Further 6-6 mice were used for two-photon microscopy andP. acnesstudies. Animals were provided food and water without restrictions, and were placed separately in cages for 24 hours before the experiment. The experiments were approved by the local ethical committee.
Contact sensitization and MEST
In all mice, the abdomen was shaved on testday (day) 0 (one day before the epicutanoeous patch installation). On day 1, an occlusive patch (Finn Chamber, diameter 18 mm (Phoenix, AZ)) saturated with 160ml of 0.5% FITC solved in acetone/ DBP (all reagents were purchased from Sigma-Aldrich, St Louis, MO) 1:1 (v/v) mixture was fixed with adhesive tape to the prepared skin for 24 hours in knockout and WT mice.
Control groups of KO and WT mice were exposed to solvent (acetone/
DBP) only. The patches were removed after 24 hours (on day 2).
On day 7, the same area of the abdomen was shaved again, and on day 8, the mice were again exposed here to FITC, or to the solvent under occlusive patches.
On day 15, the baseline ET (0 hour) was measured with a digital thickness gauge just below the apex of the ear. Then the mice were challenged by 20ml of FITC solution (0.5% FITC in acetone/DBP) on the back of both ears of the FITC-exposed animal. The control group was challenged with 20ml of acetone/DBT. Thickening of both ears was measured at 24 and 48 hours.
Histology
Immediately after the 48 hours ET evaluation, the mice were eutha- nized with sodium thiopenthal (Sandoz Pharmaceutical Company, Budapest, Hungary), and both earlobes were removed.
The earlobe samples were fixed in 10% neutrally buffered formalin, and were subjected to a standard protocol of dehydration, paraffin embedding, sectioning, and staining with hematoxylin and eosin. The histological evaluation was performed blinded. We used the methods described by Hvidet al.(2009) with modifications. To assess the grade of inflammation, we scored the epidermal hyperplasia, spongiosis, and the presence of inflammatory cell infil- tration in the dermis. A grading scale from ‘‘0’’ (no histopathological findings of inflammation) to ‘‘þþ’’ (severe inflammatory reaction) was used through the study.
The average number of mast cells with strong toluidine blue staining in the subepidermal area was also determined in five randomly selected microscopic fields at 200 magnification. The used ‘‘mast cell grading scale’’ was as follows: ‘‘0’’¼0–5 mast cells per field, ‘‘þ’’: 6–10 mast cells per field, and ‘‘þþ’’410 intensely stained mast cells per field.
Flow cytometry
Forty-eight hours after the FITC challenge on the earlobes, the draining brachial LNs (LN; 2–4 LNs per animal) were removed and single-cell suspension was prepared by gentle teasing with needles.
Cells were stained with phycoerythrin-conjugated anti-mouse CD3, Peridinin Chlorophyll Protein Complex-conjugated anti-mouse CD4, and phycoerythrin-conjugated anti-mouse CD25 antibodies (all from BD Biosciences, San Jose, CA, USA). Measurments were also performed on unlabeled LN cells in order to detect the fluorescence at the wavelength of FITC in the non-lymphoid gate. The cells were studied by a Becton Dickinson FACSCalibur flow cytometer (Becton Dickinson, San Jose, CA), and the results were evaluated by the CellQuest programme version 3.1 (San Jose, CA).
Serum IgE ELISA
At the 48 hours ET evaluation, sera were obtained from both FITC-treated TGM3/KO and WT mice, and kept frozen at 20 C1 until ELISA measurements.
Total serum IgE levels were measured with a commercially available mouse IgE ELISA KIT (BD Biosciences, Mouse IgE ELISA set, cat. no. 555248) together with the additional reagent set (BD Biosciences, OptEIA Reagent Set B (pH9.5 buffer) cat. no 550534) according to instructions provided by the manufacturer.
In vivotwo-photon microscopy to analyze cutaneous FITC penetration in TGM3/KO and WT mice
Mice (n¼3 per group) were anesthetized and their earlobes were attached to microscopic slides with Vetbond 3M (3M, St Paul, MN) tissue adhesive.
FITC stock solution (5 mg ml1in dimethyl sulfoxide) was diluted 1:100 in nanopure water. A 2ml drop was deposited onto the dorsal skin surface of the ear and was allowed to dry. Penetration of the fluorophore was measured byin vivotwo-photon absorption fluor- escence microscopy (Denk et al, 1990) and evaluated after 15, 30, and 40 minutes by a Carl Zeiss LSM 7 MP laser scanning microscope (Carl Zeiss, Jena, Germany). An optically pumped mode-locked Ti:sapphire laser (FemtoRose 100 TUN NoTouch, R&D Ultrafast Lasers, Budapest, Hungary) was used as a two-photon excitation source at a center wavelength of B795 nm. The laser delivered B190 fs pulses at a repetiton rate ofB76 MHz and had a Gaussian beam profile. The FITC fluorophore could be effectively excited at this
wavelength (Periasamy, 2001). The average power was set by an acousto-optic device with a slight chromatic dispersion (DlFWHM B40 nm), not affecting the optical pulse focusability in a spectral bandwidth ofDlFWHMB5 nm. The average laser power was set to B20 mW, providing a high-fluorescence signal but no thermal or genetic damage to the sample (Antal and Szipocs, 2012). Laser beam+ was focused by a 20 water immersion objective, which also collected the fluorescent signal from the sample to a non-descanned detector. The signal passed a long pass (l4680 nm) dichroic filter, a corresponding laser-blocking filter, and a 500–550 nm bandpass filter before reaching the non-descanned detector.
Tissue samples (85085080mm3) from anesthetized KO and WT animals were optically sliced starting from the outer surface of stratum corneum in 8mm increments (z-stack measurements). The Three-dimensional images were captured and analyzed by the commercial ZEN software (Carl Zeiss) of the two-photon microscope.
Quantification of fluorescein imaging was performed at 30 minutes based on three independent experiments using three representative orthogonal cuts of 11 layers at 8mm distance from each other, and were visualized as line analysis individually measured. For fluorescence intensity analysis, publicly free access UTHSCA Image Tool for Windows version 3.00 was used. Integrated fluorescence density was calculated on the full area of orthogonal cuts (Breuniget al, 2012, Ko¨nig, 2000)
P. acnesinduced ear swelling
TGM3/KO and WT mice (n¼3 per group) were injected with 20ml of P. acnessuspended in sterile PBS (11014colony-forming unit) into the dorsal proximal site of left earlobe. As a negative control, the right earlobe was similarly treated with 20ml PBS.
After 48 hours, the ear swelling response was measured with a digital thickness gauge.
The rate of left ear swelling to P. acneswas related to the PBS- induced ET and was given in percentage.
Statistical analysis
Data were analyzed by IBM SPSS Statistics 19 Software (IBM, Armonk, NY) using standard non-parametric Mann–Whitney test or Student’st-test.
CONFLICT OF INTEREST
The authors state no conflict of interest.
ACKNOWLEDGMENTS
We thank Judit Harsing and Daniella Kuzmanovszki (from Semmelweis Univer- sity, Department of Dermatology, Venereology and Dermato-oncology, Budapest, Hungary) for their help in histological evaluation. We also thank Petra Misjak (from Department of Genetics, Cell- and Immune Biology, Semmelweis Univer- sity, Budapest, Hungary) for her help in flow cytometry and data assessment.
Excellent technical assistance throughout the study by Mercedesz Mazan and Dora Pinter (from Semmelweis University, Department of Dermatology, Venereol- ogy and Dermato-oncology, Budapest, Hungary) is also gratefully acknowledged.
This study was supported by TA´MOP—4.2.1/B-09/1/KMR-2010-0001 and OTKA:
K73296 and also by the Hungarian Development Agency (NFU¨ ) under contract no. TECH-09-A2-2009-0134. Neil Smyth is funded by MRC grant G0501515***, and Mats Paulsson by the Deutsche Forschungsgemeinschaft SFB 829.
REFERENCES
Ammasi Periasamy (ed) (2001) Methods in Cellular Imaging. Oxford University Press: New York
Antal PG, Szip+ocs R (2012) Tunable, low-repetition-rate, cost-efficient femto- second Ti:sapphire laser for nonlinear microscopy.Appl PhysB 107:17–22
Breunig HG, Bu¨ckle R, Kellner-Ho¨fer M et al. (2012) Combined in vivo multiphoton and CARS imaging of healthy and disease-affected human skin.Microsc Res Tech75:492–8
Clarke DD, Mycek MJ, Neidle Aet al.(1959) The incorporation of amines into proteins.Arch Biochem Biophys79:338–54
Denk W, Strickler JH, Webb WW (1990) Two-photon laser scanning fluorescence microscopy.Science248:73–6
Dearman RJ, Kimber I (2000) Role of CD4(þ) T helper 2-type cells in cutaneous inflammatory responses induced by fluorescein isothiocyanate.
Immunology101:442–51
Eckert RL, Sturniolo MT, Broome AMet al.(2005) Transglutaminase function in epidermis.J Invest Dermatol124:481–92
Giwercman C, Lerbaek A, Bisgaard Het al.(2008) Classification of atopic hand eczema and the filaggrin mutations.Contact Dermatitis59:257–60 Griffin M, Casadio R, Bergamini CM (2002) Transglutaminases: nature’s
biological glues.Biochem J368(Pt 2):377–96
Hitomi K, Horio Y, Yamanishi K et al. (2001) Analysis of epidermal-type transglutaminase (Tgase 3) expression in mouse tissues and cell lines.Int J Biochem Cell Biol33:491–8
Huber M, Rettler I, Bernasconi K et al. (1995) Mutations of keratinocyte transglutaminase in lamellar ichthyosis.Science267:525–8
Hvid M, Jensen HK, Deleuran Bet al.(2009) Evaluation of FITC-induced atopic dermatitis-like disease in NC/Nga mice and BALB/c mice using computer- assisted stereological toolbox, a computer-aided morphometric system.
Int Arch Allergy Immunol149:188–94
Imai Y, Kondo A, Iizuka Het al. (2006) Effects of phthalate esters on the sensitization phase of contact hypersensitivity induced by fluorescein isothiocyanate.Clin Exp Allergy36:1462–8
John S, Thiebach L, Frie Cet al.(2012) Epidermal transglutaminase (TGase 3) is required for proper hair development, but not the formation of the epidermal barrier.PLoS One7:e34252
Ko¨nig K (2000) Multiphoton microscopy in life sciences.J Microsc200:83–104 Kripke ML, Munn CG, Jeevan A et al. (1990) Evidence that cutaneous antien presenting cells migrate to regional lymph nodes during contact sensitization.J Immunol145:2833–8
Kubo A, Nagao K, Amagai M (2012) Epidermal barrier dysfunction and cutaneous sensitization in atopic diseases.J Clin Invest122:440–7 Larson RP, Zimmerli SC, Comeau MRet al.(2010) Dibutyl phthalate-induced
thymic stromal lymphopoietin is required for Th2 contact hypersensitivity responses.J Immunol184:2974–84
Maruyama T, Iizuka H, Tobisawa Yet al.(2007) Influence of local treatments with capsaicin or allyl isothiocyanate in the sensitisation phase of a fluorescein-isothiocyanate-induced contact sensitivity model. Int Arch Allergy Immunol143:144–54
Matsuki M, Yamashita F, Ishida-Yamamoto Aet al.(1998) Defective stratum corneum and early neonatal death in mice lacking the gene for transglutaminase 1 (keratinocyte transglutaminase). Proc Natl Acad Sci USA95:1044–9
Nakatsuji T, Kao MC, Fang JYet al.(2009) Antimicrobial property of lauric acid againstPropionibacterium acnes: its therapeutic potential for inflamma- tory acne vulgaris.J Invest Dermatol129:2480–8
Pisano JJ, Finlayson JS, Peyton MP (1968) Cross-link in fibrin polymerized by factor 13: epsilon-(gamma-glutamyl) lysine.Science160:892–3 Russell LJ, DiGiovanna JJ, Rogers GRet al.(1995) Bale mutations in the gene
for transglutaminase 1 in autosomal recessive lamellar ichthyosis.Nat Genet9:279–83
Sandilands A, Smith FJ, Irvine AD et al.(2007) Filaggrin’s fuller figure: A Glimpse into the Genetic Architecture of Atopic Dermatitis. J Invest Dermatol127:1282–4
Scharschmidt TC, Man M-Q, Hatano Y et al. (2009) Filaggrin deficiency confers a paracellular barrier abnormality that reduces inflammatory thresholds to irritants and haptens.J Allergy Clin Immunol124:496–506 Sardy M, Karpati S, Merkl Bet al.(2002) Epidermal transglutaminase (Tase 3) is
the autoantigen of dermatitis herpetiformis.J Exp Med195:747–57 Sato K, Imai Y, Irimura T (1998) Contribution of dermal macrophage trafficking
in the sensitisation phase of contact hypersensitivity. J Immunol 161:6835–44
Takeshita K, Yamasaki T, Akira S et al. (2004) Essential role of MHC II- independent CD4þ T cells, IL-4 and STAT6 in contact hypersensitivity induced by fluorescein isothiocyanate in the mouse.Int Immunol16:
685–95